Báo cáo y học: "Identification of signaling components required for the prediction of cytokine release in RAW 264.7 macrophages" pdf
Bạn đang xem bản rút gọn của tài liệu. Xem và tải ngay bản đầy đủ của tài liệu tại đây (567.34 KB, 14 trang )
Genome Biology 2006, 7:R11
comment reviews reports deposited research refereed research interactions information
Open Access
2006Pradervandet al.Volume 7, Issue 2, Article R11
Research
Identification of signaling components required for the prediction of
cytokine release in RAW 264.7 macrophages
Sylvain Pradervand
¤
*†
, Mano R Maurya
¤
*†
and Shankar Subramaniam
*†‡
Addresses:
*
Bioinformatics and Data Coordination Laboratory, Alliance for Cellular Signaling, San Diego Supercomputer Center, University of
California at San Diego, Gilman Drive, La Jolla, CA 92093, USA.
†
Department of Bioengineering, University of California at San Diego, Gilman
Drive, La Jolla, CA 92093, USA.
‡
Department of Chemistry and Biochemistry, University of California at San Diego, Gilman Drive, La Jolla, CA
92093, USA.
¤ These authors contributed equally to this work.
Correspondence: Shankar Subramaniam. Email:
© 2006 Pradervand et al.; licensee BioMed Central Ltd.
This is an open access article distributed under the terms of the Creative Commons Attribution License ( which
permits unrestricted use, distribution, and reproduction in any medium, provided the original work is properly cited.
Cytokine release prediction<p>An integrative approach is used to identifying the pathways responsible for the release of seven cytokines in response to selected lig-ands.</p>
Abstract
Background: Release of immuno-regulatory cytokines and chemokines during inflammatory
response is mediated by a complex signaling network. Multiple stimuli produce different signals that
generate different cytokine responses. Current knowledge does not provide a complete picture of
these signaling pathways. However, using specific markers of signaling pathways, such as signaling
proteins, it is possible to develop a 'coarse-grained network' map that can help understand
common regulatory modules for various cytokine responses and help differentiate between the
causes of their release.
Results: Using a systematic profiling of signaling responses and cytokine release in RAW 264.7
macrophages made available by the Alliance for Cellular Signaling, an analysis strategy is presented
that integrates principal component regression and exhaustive search-based model reduction to
identify required signaling factors necessary and sufficient to predict the release of seven cytokines
(G-CSF, IL-1α, IL-6, IL-10, MIP-1α, RANTES, and TNFα) in response to selected ligands. This study
provides a model-based quantitative estimate of cytokine release and identifies ten signaling
components involved in cytokine production. The models identified capture many of the known
signaling pathways involved in cytokine release and predict potentially important novel signaling
components, like p38 MAPK for G-CSF release, IFNγ- and IL-4-specific pathways for IL-1a release,
and an M-CSF-specific pathway for TNFα release.
Conclusion: Using an integrative approach, we have identified the pathways responsible for the
differential regulation of cytokine release in RAW 264.7 macrophages. Our results demonstrate
the power of using heterogeneous cellular data to qualitatively and quantitatively map intermediate
cellular phenotypes.
Published: 20 February 2006
Genome Biology 2006, 7:R11 (doi:10.1186/gb-2006-7-2-r11)
Received: 26 August 2005
Revised: 25 November 2005
Accepted: 18 January 2006
The electronic version of this article is the complete one and can be
found online at />R11.2 Genome Biology 2006, Volume 7, Issue 2, Article R11 Pradervand et al. />Genome Biology 2006, 7:R11
Background
A main component of the inflammatory response is the pro-
duction and release of immuno-regulatory cytokines and
chemokines by macrophages. Pro-inflammatory cytokines,
such as tumor necrosis factor (TNF)α, interleukin (IL)-1, IL-
6, IL-12, granulocyte macrophage colony stimulating factor
(GM-CSF) and interferon (IFN)γ, induce both acute and
chronic inflammatory responses; the chemokines MIP(mac-
rophage inflammatory protein)-1α and RANTES (Regulated
on Activation, Normal T Expressed and Secreted) are
involved in the chemotaxis of leucocytes; and anti-inflamma-
tory cytokines, such as IL-4, IL-10 and transforming growth
factor (TGF)β, limit the magnitude and the extent of inflam-
mation [1,2]. Activated macrophages synthesize and secrete
cytokines [3]. This process is mainly regulated transcription-
ally, although post-transcriptional and translational mecha-
nisms may also play a role [4,5]. Several pathways transmit
the signals that trigger cytokine production. Among them, the
nuclear factor kappa B (NF-κB) pathway plays an essential
role in activating genes encoding cytokines [6]. Other signal-
ing pathways, such as mitogen-activated protein kinases
(MAPK), signal transducer and activator of transcription
(STAT), cAMP-protein kinase A (PKA), interferon regulatory
factor (IRF) or CAAT/enhancer-binding proteins (C/EBP),
have also been described to be invoked in macrophages [1,7].
These pathways are not distinct entities, but are part of a gen-
eral network whose different signals are produced by multiple
stimuli that generate different cytokine responses.
Systems Biology approaches to cellular networks are based on
integration of diverse read-outs from cells. The contextual
dependence of the pathways on the cell state and its response
to specific inputs renders our ability to understand every net-
work in entire detail a near impossibility. However, quantita-
tive mapping of the input to response of a given phenotype
often can be achieved in a more coarse-grained manner with
appropriate analyses of the read-outs. This is our leitmotif in
this work. Such an approach allows the elucidation of the
common and different signaling modules required for the
release of different cytokines, and the quantitative prediction
of amounts of cytokines released.
The Alliance for Cellular Signaling (AfCS) [8,9] has recently
generated a systematic profiling of signaling responses in
RAW 264.7, a macrophage-like cell line (AfCS data center
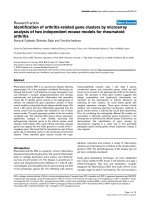
[9]). From this dataset, an input-output model is generated in
which signaling responses (input) are used to predict cytokine
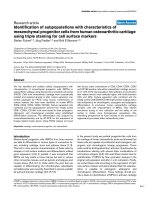
release (output) (Figure 1). Since all signaling pathway activa-
tions are not measured (for example, STAT6), our model
includes an alternative branch going directly from the stimu-
lus to the response that accounts for ligand-specific unmeas-
ured pathways. Here, we propose a novel integrated approach
that uses principal-component-regression (PCR) and a
model-reduction procedure to develop necessary and suffi-
cient models that predict cytokine release based on signaling
pathway activation [10]. Given that these minimal models
contain only the essential components, the number of signal-
ing predictors not biologically involved in cytokine release
(false positives) is reduced considerably. We show that this
data-driven approach is able to capture most of the known
signaling pathways involved in cytokine release and is able to
predict potentially important novel signaling components.
This strategy allows classification of cytokine responses based
on the activation of their signaling modules and predicts an
estimate of the amount of cytokine released.
Results
Signaling pathways and cytokine release after ligand
stimulation
The AfCS provides a global profiling of signaling responses
and cytokine release to a set of 22 ligands applied alone or in
combinations of two (AfCS data center [9]). Global-response
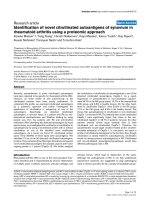
patterns to single-ligand stimulations were first visualized
using two-way hierarchical clustering (Figure 2a, b). Cluster-
ing of activated signaling proteins (studied through phospho-
protein measurements) and cAMP production after ligand
stimulation showed a consistent classification of ligands
along their known families (Figure 2a). We observed a cluster
of STAT activator cytokines (GM-CSF, IL-6, IL-10, IFNα,
IFNβ and IFNγ), a cluster of Toll-like receptor-activating lig-
ands (R-848, LPS, PAM 2 and PAM 3), a cluster of G protein
α
q
-activating ligands (2MA, PAF, UDP), which strongly acti-
vate ERK1/2 and p38 but not JNKs, a cluster of G protein α
s
-
Schematic representation of the experimental dataFigure 1
Schematic representation of the experimental data. RAW 264.7
macrophages were stimulated with different combinations of ligands.
Signals leading to cytokine release were transmitted not only through the
22 signaling proteins and a second messenger that were recorded
(measured pathways), but also through other pathways (unmeasured
pathways).
Cytokine release
Measured
pathway
Other
pathways
Ligand stimulation
Genome Biology 2006, Volume 7, Issue 2, Article R11 Pradervand et al. R11.3
comment reviews reports refereed researchdeposited research interactions information
Genome Biology 2006, 7:R11
activating ligands (ISO and PGE), and a cluster of
lysophospholipid agonists (LPA, S1P). IL-1β, which did not
show any strong response, and IL-4, whose main signaling
target (STAT6) was not measured, clustered together as weak
inducers. Although not directly related, G protein α
i
-activat-
ing ligand C5a and tyrosine kinase receptor ligand M-CSF
were classified together for their strong activation of Akt. In
hierarchical clustering of signaling responses, a strong corre-
lation was observed between ERK1/2 activation and the acti-
vation of their downstream target RSK, as well as between
ERK1/2 activation and p38 activation. Clustering of the
cytokine release data showed an overall similar pattern for all
cytokines released, with a strong response to Toll-like recep-
tor (TLR) ligands and a weaker or no response to other lig-
ands (Figure 2b). The release of a few cytokines were strongly
affected by some ligands; for example, IL-1α by IFNγ and IL-
4, and IL-10 by IL-4 and IL-6. These clustering analyses gave
a first insight into the connectivity between signaling pathway
activation and cytokine release by looking at responses trig-
gered by the same set of ligands. For example, a strong con-
nectivity can be derived between phosphoproteins JNKs and
NF-κB p65 and all cytokines from the fact that TLR ligands
strongly activate all of them.
Correlations between signaling pathway activation and
cytokine release
To further investigate the association between signaling path-
way responses and cytokine release, correlation coefficients
were calculated based on data from single- and double-ligand
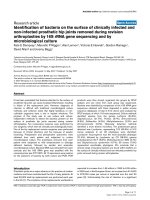
screens. As shown in Figure 3a, the overall patterns of corre-
lation were similar for different cytokine releases. Indeed, sig-
nificant positive correlations were observed between
activation of any of ERK1/2, GSK3A, GSK3B, JNKs, p38, NF-
κB, PKCµ2, RSK or Rps6 and any of the cytokine releases
(except between GSK3B and IL-10/IL-1α). The only remain-
ing significant positive correlation was between Akt phospho-
rylation and TNFα release. Significant negative correlations
were observed between production of the second messenger
cAMP and all cytokine releases except GCSF and RANTES, as
well as between SMAD2 phosphorylation and TNFα release.
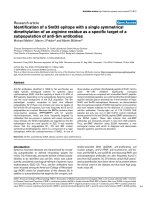
Two-way hierarchical clustering of the RAW 264.7Figure 2
Two-way hierarchical clustering of the RAW 264.7 macrophage. (a) Signaling pathway responses and (b) cytokine release after single ligand stimulations.
Average linkage clustering was performed using un-centered Pearson's correlation metrics on log-transformed and variance-normalized data. Data are
averages over the different time points and across repeated experiments. Red = positive change; green = negative change.
(b)(a)
GM-CSF
IL-6
IL-10
IFNb
IFNa
IFNg
C5a
M-CSF
R-848
LPS
P2C
P3C
2MA
UDP
PAF
LPA
S1P
IL-4
IL-1b
TGF
ISO
PGE
cAMP
AKT
JNK lg
JNK sh
ERK1
ERK2
RSK
p38
PKCmu2
GSK3A
GSK3B
Rps6
p40Phox
SMAD2
NFkB p65
Ezr/Rdx
MSN
PKCd
STAT1a
STAT1b
STAT3
STAT5
IFNg
M-CSF
IL-10
GM-CSF
UDP
IL-1b
IFNb
IFNa
PAF
S1P
LPA
C5a
2MA
LPS
P2C
P3C
R-848
PGE
ISO
IL-4
TGF
IL-6
IL-1a
IL-10
TNFa
MIP-1a
RANTES
IL-6
G-CSF
R11.4 Genome Biology 2006, Volume 7, Issue 2, Article R11 Pradervand et al. />Genome Biology 2006, 7:R11
Since TLR ligands strongly activate most of the signaling
pathways, correlations were computed after omission of TLR
ligand data in order to uncover potentially important features
(Figure 3b). Without TLR ligand data, only a few positive cor-
relations were observed, most of them involving TNFα. The
phosphorylation of STAT proteins showed weak correlations
with IL-1α, IL-10, MIP-1α and RANTES responses that were
not significant when TLR ligand data were included. All sig-
nificant negative correlations between cAMP production and
the different cytokines released were conserved except for
release of IL-1α. These correlation coefficients suggest direct
connections between signaling proteins and cytokines. How-
ever, simple correlation coefficients do not take into account
the high correlations among signaling proteins themselves
and include a large number of non-causal relationships.
Identification of cytokine regulatory signals among
measured signaling pathways
In order to define the contributions of each signaling compo-
nent to cytokine release, PCR models were developed. PCR
was chosen as the method for analysis because it takes into
account correlations among predictors (that is, signaling
pathway activation) and reduces the dimension of the data set
in order to define a linear model that predicts the responses
(that is, cytokine release). PCR and related modeling tech-
niques have been shown to be appropriate choices for analy-
ses of biological data that are highly variable in nature [11].
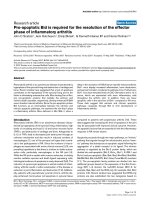
Figure 4 displays the significance of the regression coeffi-
cients for the 22 signaling pathway predictors with (Figure
4a) and without (Figure 4b) TLR ligand data. As expected,
strong similarities are observed between correlation coeffi-
cients and significant PCR regression coefficients. When TLR
ligands were included, the strongest overall regression coeffi-
cients were for the two JNK isoforms, p38 and NF-κB p65.
PKCµ2 was less prominent, but was still significant for all
except IL-6. ERK1, ERK2 and RSK shared a similar profile
and were all significant for G-CSF, IL-1α, MIP-1α, RANTES
and TNFα. Most of these coefficients lost their strength when
data from TLR ligands were removed (Figure 4b). The
remaining positive coefficients were p38 for G-CSF and TNFα
and RSK for TNFα. As for correlation coefficients, STAT pro-
teins became significant for releases of IL-1α (STAT1α/β), IL-
10 (STAT3), MIP-1α (STAT1α/β and 3) and RANTES
(STAT1α/β). In both datasets, cAMP had a significant nega-
tive coefficient for IL-10, MIP-1α, TNFα and IL-6 (the las-
tonly when without TLR ligand data). This PCR analysis
captured cytokine release associated with signaling pathways
for which measurements are available. However, it is well
established that other pathways (for example, STAT6, IRFs,
C/EBPβ) are important in cytokine synthesis and release.
Analysis of the residuals to identify significant ligands
In order to take into account the participation of pathways
not associated with measurements, we repeated PCR analysis
on the part of the cytokine responses that was not fitted by the
measured activated signaling pathways (that is, residuals). In
this instance, we used the ligands as predictors to fit the resid-
ual. Few correlations emerged among regression coefficients
of the ligands and only a few ligands were statistically signifi-
cant (Figure 5a, b). The significant positive coefficients were:
IL-4 for IL-1α, IL-6 and IL-10 releases (in the case of IL-6 and
IL-10, only when TLR-ligand data was not used); IFNγ for IL-
1α release; LPS for IL-6 and RANTES releases; as well as 2MA
for G-CSF and TNFα releases in non-TLR ligand data (Figure
5a, b). Significant negative coefficients seemed to be compen-
satory. Indeed, IFNγ strongly activated both STAT1α/β phos-
phorylation and IL-1α release, whereas IFNα strongly
activated STAT1α/β phosphorylation, but did not activate IL-
1α release (Figure 2). Since part of the effect of IFNγ on IL-1α
was captured by the positive regression coefficients of
STAT1α and β, this might be compensated in the residuals
through a negative coefficient for IFNα. Similar arguments
can be applied for the negative coefficients of P2C for IL-6
and RANTES releases. Indeed, regression coefficients of the
different measured pathways activated by TLR ligand may
have been overestimated in trying to fit the specific LPS effect.
The negative coefficients of PAF for G-CSF and TNFα releases
(TLR ligand data) should be evaluated along with the positive
coefficients of 2MA (non-TLR ligand data). Indeed, both
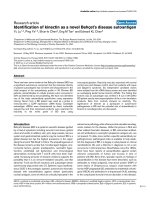
Correlation coefficients between signaling responses and cytokine releaseFigure 3
Correlation coefficients between signaling responses and cytokine release.
Pearson's correlation coefficients were computed for each pair of signaling
responses and cytokines using data from single- and double-ligand
stimulations. Data from TLR ligand stimulation were (a) included in the
procedure or (b) excluded from the procedure. Data were log-
transformed and variance-normalized. Significance of correlations was
assessed following a t distribution. Heat maps were produced from
significant correlation coefficients (red = positive correlation; green =
negative correlation).
cAMP
AKT
ERK1
ERK2
Ezr/Rdx
GSK3A
GSK3B
JNK lg
JNK sh
Msn
p38
p40Phox
NFkB p65
PKCd
PKCmu2
RSK
Rps6
SMAD2
STAT1a
STAT1b
STAT3
STAT5
G-CSF
IL-1a
IL-6
IL-10
MIP-1a
RANTES
TNFa
(b)
(a)
cAMP
AKT
ERK1
ERK2
Ezr/Rdx
GSK3A
GSK3B
JNK lg
JNK sh
Msn
p38
p40Phox
NFkB p65
PKCd
PKCmu2
RSK
Rps6
SMAD2
STAT1a
STAT1b
STAT3
STAT5
G-CSF
IL-1a
IL-6
IL-10
MIP-1a
RANTES
TNFa
Genome Biology 2006, Volume 7, Issue 2, Article R11 Pradervand et al. R11.5
comment reviews reports refereed researchdeposited research interactions information
Genome Biology 2006, 7:R11
ligands are strong activators of ERK1/2 and p38. With TLR
ligand data, these two signaling pathways had large regres-
sion coefficients that captured G-CSF and TNFα responses
after 2MA stimulation accurately, but overestimated them
after PAF stimulation. Without TLR ligand data, regression
coefficients of ERK1/2 and p38 were smaller and not suffi-
cient to capture the response after 2MA stimulation. A final
related observation was that the overall patterns of regression
coefficients for G-CSF and TNFα release were highly similar
and may reveal a common regulatory mechanism.
Minimal models of cytokine release
In the above PCR models, a predictor might be declared sig-
nificant only because of its high correlation with other impor-
tant predictors. In order to identify the required signaling
pathways and ligands for the cytokine responses, we devel-
oped a minimal PCR model. Before model reduction, it was
confirmed that PCR models based only on the significant pre-
dictors were able to fit the data as well as models based on all
predictors (data not shown). Then we identified the smallest
set of predictors able to fit the data statistically as compared
to a detailed model consisting of all 22 signaling-proteins and
22 ligands (see Materials and methods). This procedure was
performed with and without TLR ligand data. The two sets of
predictors in the models based on data including or excluding
TLR ligands were then combined to produce a single minimal
model. All possible combinations of predictors in this single
minimal model were tested and the model corresponding to
absolute minimal fit error over training data was retained
(Table 1). Several regulatory modules were immediately evi-
dent from these minimal models. The first module consisted
of NF-κB p65 and one of the JNK isoforms and translated the
common dependency to TLR ligands for all cytokine releases
(except MIP-1α, which did not retain NF-κB p65). The second
module included p38 and PAF (as a negative ligand predictor)
and underlined a common regulatory mechanism for three
different cytokines (G-CSF, MIP-1α and TNFα). The third
module is defined by STAT1 transcription factors and is
required for the prediction of the release of MIP-1α and
RANTES. The last module involving measured signaling
activity is inhibitory and is defined by cAMP. IFNγ, IL-4 and
LPS were all required for the prediction of more than one
cytokine release and each of them may reflect other important
regulatory modules. Finally, some ligands were specific in
predicting the release of one cytokine (IFNβ for IL-6, IL-6 for
IL-10 and M-CSF for TNFα). Figure 6 displays the fits of these
different minimal models for training and test data. Most of
the training and test data points were inside two root-mean-
squared errors of the training data. In the case of MIP-1α,
predictors did not yield a good fit. After inclusion of NF-κB
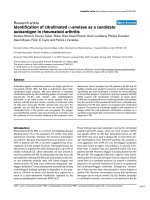
Significance of signaling-pathway predictors for cytokine releaseFigure 4
Significance of signaling-pathway predictors for cytokine release. Data from TLR ligand stimulation were (a) included or (b) excluded. PCR analyses were
performed as described in Materials and methods. For a given output, significance of signaling responses was measured as the ratio of their regression
coefficients (coef.) divided by the standard deviation (std) of coefficients corresponding to random outputs from the same population as the actual outputs
(see Materials and methods). Averaged ratios outside a 95% confidence interval (horizontal dashed lines) are considered significant.
(b)
−5
0
5
cAMP
AKT
ERK1
ERK2
Ezr/Rdx
GSK3A
GSK3B
JNK lg
JNK sh
MSN
p38
p40Phox
NFkB p65
PKCd
PKCmu2
RSK
Rps6
SMAD2
STAT1a
STAT1b
STAT3
STAT5
Ratio of coef. to std.
−5
0
5
cAMP
AKT
ERK1
ERK2
Ezr/Rdx
GSK3A
GSK3B
JNK lg
JNK sh
MSN
p38
p40Phox
NFkB p65
PKCd
PKCmu2
RSK
Rps6
SMAD2
STAT1a
STAT1b
STAT3
STAT5
Ratio of coef. to std.
G-CSF
IL-1a
IL-6
IL-10
MIP-1a RANTES
TNFa
G-CSF
IL-1a
IL-6
IL-10
MIP-1a RANTES
TNFa
(a)
R11.6 Genome Biology 2006, Volume 7, Issue 2, Article R11 Pradervand et al. />Genome Biology 2006, 7:R11
p65, an obvious false negative predictor [12], the fit-error
improved only slightly (from 2.57 to 2.53 on the training data
and from 2.88 to 2.49 on the test data). MIP-1α data are char-
acterized by a high variance and data can simply be difficult
to fit because of imprecision in the measurements. G-CSF and
TNFα have corresponding outlier points. All over-predicted
points involved 2MA stimulation and might be due to an
overweighting of the role of p38. The under-predicted points
carried an especially low value for the JNK large isoform, NF-
κB p65 or p38 and, therefore, may be considered as outliers.
Network reconstruction
In order to develop a coarse-grained network of cytokine pro-
duction, 152 independent analyses of variance (ANOVA; 7
cytokines times 22 ligands minus 2 cytokines that are also lig-
ands) that identified ligands that significantly enhance
cytokine release and 462 independent ANOVA (21 phospho-
proteins times 22 ligands) that identified ligands that signifi-
cantly enhance signaling-protein phosphorylations were
considered. The case of cAMP is treated independently and
only two ligands (isoproterenol and prostaglandin E2) signif-
icantly stimulate its production. To declare a ligand-cytokine
or ligand-phosphoprotein link significant, two criteria were
used: a P value cutoff of 0.05 after correction for multiple
testing (Dunn-Sidak); and an absolute change outside a 90%
confidence interval of all the basal values for the particular
measurements. Connections were then drawn from the lig-
ands that significantly stimulate cytokines to the signaling
pathway identified in the PCR minimal models according to
activations identified by ANOVA (Figure 7). Ligands from the
PCR minimal model that were not consistently identified by
ANOVA after single ligand stimulation were investigated for
interaction effects using a distinct ANOVA model. IFNβ was
shown to have a significant positive interaction with all four
TLR ligands on IL-6 release. These networks are compared
with known activations from the literature in the discussion.
Discussion
Cytokines and chemokines released by activated macro-
phages modulate the inflammatory response [3]. Thus,
understanding the regulation of the expression and release of
these mediators is crucial for understanding the course of the
inflammation process. Here we propose models that derive
the responses of seven cytokines from the activation of sign-
aling pathways. These models reasonably predicted cytokine
release and identified a total of ten signaling components
involved in cytokine release (Figure 8). Four components
Significance of ligand predictors for cytokine release residualsFigure 5
Significance of ligand predictors for cytokine release residuals. Data from TLR ligand stimulation were (a) included or (b) excluded. Residuals of cytokine
release measurements were calculated from PCR models using signaling pathways as predictors. PCR analyses were performed on the residuals as
described in Materials and methods. Averaged ratios outside a 95% confidence interval after noise correction (horizontal dashed lines) are considered
significant. Since these residuals also carry noise, we applied a corrective factor to set a higher confidence interval to identify significant ligands (see
Materials and methods).
(a)
(b)
−5
0
5
2MA
R-848
C5a
GM−CSF
IL-4
IL−6
IL−10
IL−1b
IFNa
IFNb
IFNg
ISO
LPA
LPS
M-CSF
P2C
P3C
PAF
PGE
S1P
TGF
UDP
Ratio of coef. to std.
−5
0
5
2MA
C5a
GM−CSF
IL-4
IL−6
IL−10
IL−1b
IF
Na
IFNb
IFNg
ISO
LPA
M-CSF
PAF
PGE
S1P
TGF
UDP
Ratio of coef. to std.
G-CSF
IL-1a
IL-6
IL-10
MIP-1a RANTES
TNFa
G-CSF
IL-1a
IL-6
IL-10
MIP-1a RANTES
TNFa
Genome Biology 2006, Volume 7, Issue 2, Article R11 Pradervand et al. R11.7
comment reviews reports refereed researchdeposited research interactions information
Genome Biology 2006, 7:R11
were defined by measured signaling pathways and six compo-
nents were defined by ligand-specific signaling pathways.
Among them, a NF-κB p65-JNK component was required for
the prediction of all cytokine releases and reflected the
dependency on TLR ligand inputs. A TLR4 specific compo-
nent (identified by LPS ligand) was required for the predic-
tion of RANTES and IL-6. The other components reflected
TLR ligand independent pathways. Regulation of cytokine
expression has been studied extensively (Table 2). Therefore,
for each cytokine, information available from the literature
was used to evaluate and validate our models.
G-CSF
G-CSF specifically regulates the production of neutrophilic G
granulocytes and enhances the functional activities of mature
neutrophils [13]. The expression of the gene encoding G-CSF
is regulated by a combination of transcriptional and post-
transcriptional mechanisms [14]. Three conserved upstream
regions have been identified in the G-CSF promoter, includ-
ing binding sites for OCT (octamer), NF-κB and C/EBPβ. The
last two have been shown to be required for the induction of
the gene [13,15]. Our model identified NF-κB, JNK and p38
pathways (Figure 8). C/EBPβ activation was not measured in
our experimental data. However, its role may be inferred by
the presence of JNK. Indeed, JNK was proposed to contribute
to the transcriptional activation of C/EBPβ in macrophages
[16]. The presence of p38 in our minimal model may be
related to post-transcriptional regulation. It has been shown
that G-CSF mRNA contains AU-rich destabilizing elements
(AREs) in the 3'-untranslated region [17] and recent evidence
suggests a role for the p38 pathway in regulation of ARE
mRNA stability [18].
IL-1α
IL-1α is a pro-inflammatory mediator distinct from IL-1β that
is produced by monocytes after various stimulation [19]. In
contrast to IL-1β, few studies have investigated the
mechanisms that mediate expression of the gene encoding IL-
1α [20]. Among transcription factors, AP-1 (a JNK target),
Prediction of training and test data on cytokine release using PCR minimal modelsFigure 6
Prediction of training and test data on cytokine release using PCR minimal
models. Measured versus predicted log-transformed concentration values
are indicated for training data (unfilled circles) and test data (filled
triangles). Dashed and dotted lines indicate one and two standard
deviations, respectively, from the average predicted fit of the training data.
−2 0 2 4 6 8 10
−2
0
Predicted
Measured
IL-1a
IL-6 IL-10
MIP-1a RANTES
TNFa
G-CSF
012345
5
−10123456
6
0246
0 5 10 15
10
15
0246810
10
0 5 10 15
0
4
6
10
2
8
4
3
2
1
0
5
4
3
2
1
0
6
4
2
0
5
0
8
6
4
2
0
2
4
6
8
10
12
14
Table 1
Predictors identified in the PCR minimal model
Cytokine Signaling pathways Ligands
G-CSF JNK lg PAF (-)
NF-κB p65
p38
IL-1α JNK lg IFNγ
NF-κB p65 IL-4
IL-6 cAMP (-) IFNβ
JNK lg IL-4
NF-κB p65 LPS
IL-10 JNK sh IL-4
NF-κB p65 IL-6
MIP-1α cAMP (-) PAF (-)
JNK lg
p38
STAT1α
RANTES JNK lg LPS
NF-κB p65
STAT1β
TNFα cAMP(-) IFNγ
JNK lg M-CSF
NF-κB p65 PAF (-)
p38
(-), negative predictor.
R11.8 Genome Biology 2006, Volume 7, Issue 2, Article R11 Pradervand et al. />Genome Biology 2006, 7:R11
NF-κB and Sp1 were shown to regulate expression of this gene
[21-23]. In our model, these known activators are reflected
through JNK and NF-κB (Figure 8). We also identified IFNγ
and IL-4 as potential novel activators through independent
pathways.
IL-6
IL-6 is a pleiotropic cytokine whose expression is mediated by
a wide range of signaling pathways that may vary depending
on the cell type [24]. In monocytes, a NF-κB site is crucial for
LPS-induced expression of the gene encoding IL-6 [25]. In
these cells, it has also been shown that a synergistic induction
by IFNγ and TNFα involves cooperation between IRF-1 and
NF-κB p65 homodimers [26]. IRF-1 is also a down-stream
target of IFNβ [27] and has been designated as an immediate-
early LPS-inducible gene [28]. In order to activate IRF-1, LPS
acts through a MyD88-independent pathway not shared by
other TLR ligands [29]. Therefore, in our model, IRF-1 may
be represented both as the LPS- and as the IFNβ-specific
pathway. The other important non-constitutive transcription
factors involved in IL-6 gene activation include AP-1, C/
EBPβ, which work synergistically with NF-κB and may be
captured by the JNK component of our minimal model [30].
IL-4 and cAMP are the remaining two components of our
model (Figure 8). Using ANOVA analysis, we did not see any
significant induction of IL-6 production by IL-4; neither did
we see any interactive effect of IL-4 with other ligands. IL-4 is
known for its inhibitory effects on pro-inflammatory
cytokines, although it has been shown to stimulate IL-6 in
osteoblast-like cells [31]. Therefore, we may not give a high
confidence to an effect of an IL-4 specific pathway on IL-6
cytokine release. A similar problem is observed with cAMP,
which was identified as a negative predictor. Several reports
have indicated activation of the IL-6 gene by cAMP in mono-
cytes [25], although other reports have shown no response
[32]. In our PCR analysis, a lack of response may be trans-
lated to an anti-correlated predictor. Since the ligands that
lead to elevated levels of cAMP did not decrease IL-6
production, the negative sign of cAMP may not reflect an
inhibitory action.
IL-10
IL-10 is a pleiotropic cytokine that has dominant suppressive
effects on the production of pro-inflammatory cytokines by
monocytes [33]. Promoter analysis in RAW 264.7 macro-
phages stimulated by LPS showed a central role for a Sp1
binding site in the activation of the gene encoding IL-10 [34].
On the other hand, this study and others suggest no contribu-
tion for NF-κB [35]. The activation of the IL-10 gene by Sp1
was later suggested to be p38 dependant [36]. In addition to
Sp1, C/EBPβ and δ factors are also involved in LPS-induced
gene expression of IL-10 [37]. Thus, contrary to the other
cytokines, TLR ligand pathways that activate IL-10 are p38-
Sp1 and C/EBP dependent. Our model only partially reflects
Topologies of signaling networks leading to cytokine releases derived from PCR minimal models and ANOVA analysisFigure 7
Topologies of signaling networks leading to cytokine releases derived from PCR minimal models and ANOVA analysis. In each panel, nodes in the upper
row represent ligands that significantly regulate respective cytokines (ANOVA). Nodes in the middle row represent significant pathways identified by PCR
minimal models. Edges between top and middle rows represent significant signaling pathway regulation by the given ligands (ANOVA). Edges between top
and bottom rows, or middle and bottom rows, represent significant participation identified by PCR minimal models. Weak activation of signaling pathways
is indicated by dashed edges. Light gray: pathways demonstrated in the literature to not play any role (false positives).
p38
LPS
P2C
P3C
R-848
TLR2/1, TLR2/6,
TLR4, TLR7
G-CSF
ISO
Adrb2
2MA
P2X, P2Y
NF-κB JNK
JNK NF-κB
IL-1α
IL-4
IL-4R
IFNγ
IFNGR
LPS
P2C
P3C
R-848
TLR2/1,TLR2/6,
TLR4, TLR7
NF-κB
LPS
P2C
P3C
R-848
TLR2/1, TLR2/6,
TLR4, TLR7
2MA
P2X, P2Y
M-CSF
CSF-1R
JNK
IFNα
IFNβ
IFNAR
IL-10
IL-4
IL-4R
IL-6
gp130
NF-κB
R-848
P2C
P3C
TLR2/1,
TLR2/6, TLR7
LPS
TLR4
JNK
RANTES
STAT1
IFNβ
IFNAR
JNK
R-848
P2C
P3C
TLR2/1,
TLR2/6, TLR7
LPS
TLR4
NF-κB
IL-6
cAMP
ISO
Adrb2
IFNβ
IFNAR
IL-4
IL-4R
NF-κB
LPS
P2C
P3C
R-848
TLR2/1, TLR2/6,
TLR4, TLR7
2MA
UDP
P2X, P2Y
M-CSF
CSF-1R
p38 JNK cAMP
IFNβ
IFNAR
TNFα
ISO
Adrb2
IFNγ
IFNGR
JNK
LPS
P2C
P3C
R-848
TLR2/1, TLR2/6,
TLR4, TLR7
STAT1
cAMP
TGF
TβR-I,
TβR-II
MIP-1α
p38
IFNβ
IFNAR
ISO
Adrb2
2MA
UDP
P2X, P2Y
Genome Biology 2006, Volume 7, Issue 2, Article R11 Pradervand et al. R11.9
comment reviews reports refereed researchdeposited research interactions information
Genome Biology 2006, 7:R11
these facts through the presence of JNK (Figure 8). Another
missing predictor is cAMP, since it is known to elevate IL-10
production [38]. Two ligands (IL-4 and IL-6) were found to
have specific pathways that activate IL-10 release. The effects
of IL-4 on IL-10 production in macrophages have been con-
tradictory [39]. Indeed, IL-4 suppresses LPS-induced IL-10
production by peripheral blood mononuclear cells, but
increases LPS-induced IL-10 production by monocyte-
derived macrophages. Stimulation of IL-10 by IL-6 has been
reported [40]. It may involve C/EBPβ since several C/EBPβ
binding sites are found in the IL-10 promoter [37] and C/
EBPβ is a well known down-stream target of IL-6 signaling
[41].
MIP-1α
MIP-1α belongs to the group of CC chemokines that modulate
several aspects of the inflammatory response, including traf-
ficking, adhesion and activation of leukocytes, as well as the
fever response [42]. Our minimal model identified four
regulatory modules for MIP-1α: JNK, p38-PAF, cAMP and
STAT1 (Figure 8). In macrophages, MIP-1α mRNA is rapidly
induced by TLR ligands and IFNγ (whose effect could be
represented by STAT1 in our model), and this effect can be
down-regulated by dibutyryl cAMP [43,44]. DNA-binding
studies revealed a role for C/EBPβ, NF-κB and c-Ets tran-
scription factors [12]. As discussed earlier, C/EBPβ may be
inferred by the presence of JNK in our model. NF-κB may
have been omitted due to the high variability of the MIP-1α
data leading to a less precise model. Since NF-κB seems to be
a false negative predictor and is retained with JNK for all
other minimal models, the JNK-NF-κB module is shown acti-
vating MIP-1α in Figure 8. MIP-1α mRNA also contains ARE
motifs known to be implicated in mRNA stability and transla-
tional control [43]. This process is under the control of p38
[45] and, therefore, may be reflected in the p38-PAF compo-
nent of our model.
RANTES
RANTES/CCL5 is a CC chemokine that is predominantly
chemotactic for monocytes/macrophages and lymphocytes
[46]. Three main pathways have been demonstrated to be
important for its gene induction in macrophages: JNK, NF-
κB and interferon regulatory factors (IRFs) [46]. Transcrip-
tional activation of the RANTES promoter is dependent on
specific AP-1 and NF-κB response elements, which are regu-
lated by JNK and NF-κB kinase cascades, respectively [47]. It
is well established that IFNγ and TNFα cooperatively induce
RANTES gene expression, although no STAT binding ele-
ments have been identified in the promoter [48,49]. The syn-
ergy between IFNγ and TNFα may involve IRFs since it was
demonstrated to require STAT1 activation and to be depend-
ent on protein synthesis [50]. Indeed, IRF-1 was shown to
bind the RANTES promoter [51]. As seen previously, LPS, but
not the other TLR ligand, activates IRFs via a MyD88-inde-
pendent pathway [29]. Therefore, the STAT1 and LPS-
dependent pathway identified in our minimal model can be
explained by the role of IRF-1/IRF-3 (Figure 8).
TNFα
TNFα is essential for normal host defense in mediating
inflammatory and immune responses [52]. Signal transduc-
tion mechanisms that regulate TNFα production have been of
considerable interest. In macrophages, TNFα production has
been shown to undergo transcriptional and post-transcrip-
tional controls [53]. NF-κB is the best described transcrip-
tional activator, with three binding sites on the TNFα
promoter [54]. Its inhibition by overexpression of its natural
inhibitor IκB alpha reduced LPS-induced TNFα production
by 80% [55]. The other transcription factors recruited to the
TNFα promoter involve Sp1, the ERK targets Egr-1, Ets and
Elk-1 [56], as well as the JNK targets c-Jun and ATF-2 [57].
Transcription of TNFα is augmented by IFNγ [58] and inhib-
ited by the cAMP/PKA pathway [59]. Post-transcriptional
regulation of TNFα production also involves ARE elements
under the control of p38 [45,60,61]. Therefore, except for the
ERK pathway, our minimal model identified the known sign-
aling mechanism responsible for the regulation of TNFα (Fig-
ure 8). Moreover, it also identified an independent M-CSF
specific pathway. M-CSF treatment was shown to trigger
TNFα production by monocytes [62]. However, to our knowl-
edge, the underlying mechanism is not known. This study
suggests that it follows a pathway independent of NF-κB, JNK
or p38.
Evaluation of our models using literature data shows good
agreement, although a precise assessment should be done in
vitro in RAW264.7 macrophages since regulation of cytokine
production is cell-type and sometimes cell-state dependent.
Our minimal model covers all known mechanisms of activa-
tion of G-CSF and highlights a potential role for p38 in its
post-transcriptional regulation. For IL-1α release, besides all
known activators, IFNγ and IL-4 are identified as potential
novel independent activators. For IL-6 release, four
predictors were corroborated by literature data whereas
cAMP and IL-4 may be false positives, although the role of IL-
4 is controversial. IL-10 response yielded the least convincing
Table 2
Cytokine gene regulation
Cytokine Signaling pathways/transcription factors
G-CSF NF-κB, C/EBPβ, Oct, post-transcriptional
regulation
IL-1α NF-κB, AP-1, Sp1
IL-6 NF-κB, AP-1, Sp1, IRF-1, C/EBPβ
IL-10 C/EBPβ, C/EBPδ, Sp1, cAMP/PKA
MIP-1α NF-κB, Ets, C/EBPβ, cAMP/PKA,
posttranscriptional regulation
RANTES NF-κB, AP-1, IRF-1, IRF-3
TNFα Egr-1, Ets/Elk, NF-κB, c-jun/ATF-2, cAMP/PKA,
post-transcriptional regulation (p38 dependent)
References can be found in the text.
R11.10 Genome Biology 2006, Volume 7, Issue 2, Article R11 Pradervand et al. />Genome Biology 2006, 7:R11
model, with a misidentification of NF-κB and a non-identifi-
cation of p38 and cAMP as positive predictors. Another
obvious missing predictor was NF-κB for MIP-1α release.
However, in this model, all other important signaling path-
ways were represented. For RANTES release, all known
mechanisms of activation were found. Finally, all known sig-
naling pathways with the exception of ERK were found for
TNFα release. This last minimal model also identified a
potentially new M-CSF specific pathway for the activation of
TNFα. Overall, the performance of our strategy is excellent,
with a 1.2% false positive rate and a 13% false negative rate.
Conclusion
We designed an input-output modeling approach that inte-
grates PCR and exhaustive-search-based model reduction.
We have demonstrated that this approach is applicable to het-
erogeneous types of data through combining western blot
phosphorylation and cAMP measurements, and is extendable
to other types of data, such as those measured by mass
spectrometry. Regarding the issue of scalability to much
larger data sets, we note that the PCR part solves a set of lin-
ear equations and hence scales well for large systems with
thousands of predictors. The minimization part warrants
combinatorial optimization, is computationally intensive and
hence can go up to exponential complexity in the number of
predictors. Nevertheless, it is tractable for up to a few hun-
dred predictors, which is adequate for most cellular interme-
diate phenotype measurements.
Cytokines mediate pathogenesis of many diseases (for exam-
ple, chronic inflammatory diseases, autoimmune diseases,
cancer). With increasing quantitative knowledge about the
important pathways in the production of cytokines, model
building as presented in this study will help identify novel tar-
gets in order to maximize the efficacy of a drug such that it
affects one or few cytokines while minimizing the effect on the
homeostasis of other cytokines. The results of the present
study demonstrate the power of using heterogeneous cellular
data to qualitatively and quantitatively map intermediate cel-
lular phenotypes. These predictive models of the physiologi-
cal process of cytokine release are important for a
quantitative understanding of macrophage activation during
the inflammation process.
Materials and methods
Data
Single- and double-ligand screen experimental data were
obtained from the AfCS Data Center [9]. To generate these
data, RAW 264.7 macrophages were stimulated with a variety
of receptor-specific ligands applied alone or in combinations
of two. Time-dependent changes in signaling-protein phos-
phorylations, intracellular cAMP concentrations and extra-
cellular cytokines released were measured. Assays included
immunoblots to detect phosphorylation of signaling proteins
at 1, 3, 10 and 30 minutes after stimulation (AfCS protocols
#PP00000177 and #PP00000181 [63]), competitive enzyme-
linked immunosorbant assays to measure cAMP concentra-
tions at 20, 40, 90, 300 and 1,200 seconds after stimulation
(AfCS protocol #PP00000175 [63]), and a multiplex suspen-
sion array system (Bio-Plex, Bio-Rad, #171-F11181) to meas-
ure concentrations of cytokines in the extracellular medium
at 2 hours, 3 hours and 4 hours after stimulation (AfCS proto-
cols #PP00000209 and #PP00000223 [63]).
ANOVA analysis
To quantitatively estimate the contributions of various exper-
imental and biological factors to signaling-protein phosphor-
ylations and cytokine release, statistical models of single-
ligand screens are defined as:
c
ijk
= µ + T
i
+ L
j
+ E
k
+ TL
ij
+ TE
ik
+ LE
jk
+ e
ijk
where c
ijk
is the measured response at time T
i
for ligand con-
dition L
j
in experiment E
k
. L is defined as a particular ligand
being present or absent (the corresponding control). Interac-
tion term TLK is included in the random error (e). ANOVA
were performed on log transformed data (base e). Significant
terms were identified after correction for multiple testing
(Dunn-Sidak method). In the case of protein phosphorylation
data, the 30 minutes time point was discarded and the
remaining time points (1, 3 and 10 minutes) were each ran-
domly paired to one of the three measurements of basal phos-
phorylation. Studentized residuals were assessed on residual
and quantile-quantile (Q-Q) plots.
Data pre-processing
The input matrix was constructed from cAMP and signaling-
protein phosphorylation data and the output matrix was con-
structed from cytokine release data. For signaling-protein
phosphorylation, a fold change over basal was calculated
(AfCS protocol #PP00000181 [63]). For cAMP, the corre-
sponding control concentration was subtracted and one was
Combined network of signaling components required for the production of cytokinesFigure 8
Combined network of signaling components required for the production
of cytokines. Upper row represents the different signaling pathway
components. Lower row represents the different cytokines. Bold face:
signaling component identified from measured signaling pathways. Italic
face: signaling component identified from residuals and representing ligand-
specific unmeasured pathways.
NF-κB
JNK
p38
PAFM-CSF cAMP STAT1
TNFα
IFNγ
MIP-1α IL-1αG-CSF
LPS
RANTES IL-6 IL-10
IL-4IFNβ IL-6
Genome Biology 2006, Volume 7, Issue 2, Article R11 Pradervand et al. R11.11
comment reviews reports refereed researchdeposited research interactions information
Genome Biology 2006, 7:R11
added. In both cases, the natural logarithm was taken and
data were averaged across time points after removing time-
series with missing values. Means and standard deviations
were obtained from replicate experiments. Most of the meas-
urements had three or more replicates. A few measurements
did not have any replicates, but were still incorporated. Extra-
cellular cytokine concentrations were log-transformed after
subtraction of the corresponding controls concentration and
addition of one. Signal-to-noise ratios were also calculated as
the difference between treated and control measurements
divided by the standard deviation of the control measure-
ments. Cytokines with an average signal-to-noise ratio lower
than five were discarded. The remaining seven cytokines (G-
CSF, IL-1a, IL-6, IL-10, MIP-1α, RANTES and TNFα) were
retained for further analysis. Time-series with missing values
were discarded and outliers, defined as repeats with z-scores
outside a 95% confidence interval, were removed. Data were
averaged across time points. Means, variances and standard
deviations were obtained from replicate experiments. For
each cytokine, variance distributions were assessed and
stimulation conditions with large variances (outside a 95%
confidence interval) were discarded. A matrix of m stimula-
tion conditions × n
1
predictors (independent block) was con-
structed from the mean values (across time-points and
repeats) for cAMP and protein phosphorylation
measurements. A matrix of m stimulation conditions × n
2
responses (dependent block) was constructed from the mean
values for cytokines release.
Identification of significant predictors
Significant predictors (that is, phosphoproteins and ligands)
were identified through a PCR [10] and significance-test
based procedure. The significant-test was carried out by com-
paring the predictor coefficients in the PCR model with the
standard deviation in the coefficients corresponding to a PCR
model with random outputs. The predictors with a ratio
higher than a threshold, r
th
= 1.96 corresponding to 95% con-
fidence, were considered significant. In principal, the meth-
odology is similar to the bootstrap method in which randomly
shuffled outputs are used to develop random models [11], but
in our novel procedure these random models are never actu-
ally identified. Instead, an indirect procedure is used in which
the desired standard deviation is calculated implicitly by uti-
lizing the latent variables of the input data and the standard
deviation of the population of output data. The procedure is
given below.
Step 1: Principal component decomposition of the input data
Let X be the normalized input data (zero-mean, unit-stand-
ard deviation), of size m × n
1
and Y be the normalized output
data (zero-mean), of size m × n
2
. Compute the eigen values
(λ
i
, i = 1, , n
1
) and eigen vectors (loadings, v
i
) of the covari-
ance matrix of X, S. Calculate the scores (latent variables, T
i
):
T
i
= X *v
i
.
Step 2: PCR model
For k latent variables, let V = [v
1
v
2
v
k
], Λ
k
= diag([λ
1
λ
2
λ
k
]), and T = [T
1
T
2
T
k
] = X*V. Then, the PCR model for j
th
output (Y
j
) is:
Y
j
= X*B
j,k
with the coefficients
B
j,k
= V*(Λ
k
*(m - 1))
-1
*T
T
*Y
j
Step 3: Ratio of the coefficients B
j,k
to the standard deviation of
coefficients for random models (
σ
j,k
)
In a boot-strap approach, many random shufflings of the out-
put are considered. For each, a model is built. Then the stand-
ard deviation (σ
j,k
) of the coefficients in these models is
calculated. Here we use a novel implicit (indirect) approach to
estimate σ
j,k
. Consider a random model with coefficients
corresponding to the output values , the l
th
random shuf-
fling of the j
th
output Y
j
. Then:
= V * (Λ
k
* (m - 1))
-1
* T
T
*
and hence
σ
j,k
= std() = diag(V * (Λ
k
* (m - 1))
-1
* V
T
)* std()
where std refers to standard deviation and diag (A), A being a
square matrix, is a column vector containing the diagonal ele-
ments of A. Since (∀ l) belong to the same population as
Y
j
, std() ≈ std(Y
j
) (observed computationally too), and
hence:
σ
j,k
= std() ≈ diag(V * (Λ
k
* (m - 1))
-1
* V
T
)* std(Y
j
)·r
j,k
=
B
j,k
/σ
j,k
.
Step 5: Identification of significant predictors
Repeat Steps 2 and 3 for k = k
min
, , k
max
, where k
min
and k
max
are the number of latent variables needed to capture 80% and
95%, respectively, variance in X. Compute the average of r
j,k
,
, and the threshold r
th
= the confidence interval of normal
distribution for a specified significance (r
th
= 1.96 for 95%
confidence, t test with infinite degree of freedom). The i
th
pre-
dictor is significant if > r
th
( is the i
th
element of ).
Step 6: Development of a model based upon PCR
Choose the number of latent variables (k) corresponding to
the minimum fit-error to develop a model.
β
j
l
Ψ
j
l
β
j
l
Ψ
j
l
β
j
l
Ψ
j
l
Ψ
j
l
Ψ
j
l
β
j
l
r
j
r
ji,
r
ji,
r
j
R11.12 Genome Biology 2006, Volume 7, Issue 2, Article R11 Pradervand et al. />Genome Biology 2006, 7:R11
One model is developed for each cytokine (output). First, all
the measured phosphoproteins and cAMP are used to develop
a phosphoproteins model (PP-model) to explain extracellular
cytokine levels from signaling pathway activation. Then, the
residuals are calculated and used to identify if the inclusion of
one or more ligands in the model can significantly improve
the fit of the data. If so, it is inferred that the PP-model alone
does not capture all the important pathways and that the
inclusion of ligands captures pathways from the ligands to the
output through unmeasured signaling-proteins (Figure 1).
Here ligands serve as predictors and residuals serve as out-
puts. In the residuals-model, r
th
= * 1.96 = 2.7719 is used
since residuals themselves have a strong random component.
The factor corresponds to the standard deviation of
difference of two random variables (that is, mean of random
coefficients – random coefficients) drawn from standard nor-
mal distribution.
Development of minimal models
To reduce the number of false-positives, a model with a min-
imal number of predictors (minimal model) is developed that
has a statistically similar fit-error as the detailed model with
all the predictors. A two-level procedure is used. At level one,
using the significant phosphoproteins identified based upon
the detailed model, one or more minimal PP-models are
developed by a combined sequential and combinatorial
(exhaustive search) model-reduction procedure. Once a min-
imal PP-model is generated, the residuals are generated for
this minimal PP-model. At level two, the residuals are used to
identify important ligands by developing a minimal residuals
model using the same approach. The overall minimal model
is the combination of the minimal PP-model and the minimal
residuals model. The procedure for the identification of the
minimal model containing the necessary and sufficient set of
predictors is summarized below. This procedure is used at
both level one and level two for each cytokine.
Starting with a model that includes all the significant predic-
tors, to test if the model is good, the following criteria are
used:
1. Statistically same fit-error for the minimal models and the
detailed model (F-test): let e
d
and e
r
be the root-mean-
squared-errors (RMSE) for the detailed and the candidate
minimal model. This criterion is satisfied (that is, null
hypothesis H
0
is accepted) if / <finv(p, d
1
, d
2
) where p
= 1 - α, α is the significance-level (0.05), and d
1
and d
2
are the
degrees of freedom for and , respectively. For the resid-
uals model, instead of e
d
, the fit-error for the significant-pre-
dictors model (e
s
) is used to avoid over-fitting.
2. The fit-error for minimal models should be statistically
lesser (F-test used) than the fit-error for a zero-predictor
model (mean-model), that is, the alternative hypothesis (H
1
)
is accepted. Else, the mean-model is the minimal model. The
logic behind this criterion is that if a model with one or more
predictors does not improve the fit over a trivial model, then
those predictors should not be included in the minimal
model. For this test, p = 0.95 is used for the PP-model and p
= 0.68 (that is, somewhat lesser improvements also are
accepted) is used for the residuals model.
If the model satisfies the two criteria listed above, eliminate
the least significant predictor from the current list of predic-
tors (based upon the original ranking from the detailed
model). Develop a model using the remaining predictors and
test if the model satisfies the two criteria. Repeat until no fur-
ther reduction is possible. If this minimal model has more
than one predictor then test all possible combinations of one
or more predictors (from the original list of all significant pre-
dictors). During this phase, it is also required that the signs of
the coefficients of the predictors in the minimal model be the
same as the sign of the coefficients of the corresponding pre-
dictors in the detailed model. The smallest good model(s) are
the minimal model(s). If multiple minimal models are gener-
ated, then the model with least fit-error is considered.
To validate the minimal models, test data are used. If valida-
tion fails, the test data are also included in the training set and
the model-reduction procedure is repeated. Additional
details are provided in Additional data file 1.
Matlab code and the data can be obtained upon request.
Additional data files
The following additional data are available with the online
version of this paper. Additional data file 1 contains a detailed
description of the procedure for the validation of the model.
Additional File 1A detailed description of the procedure for the validation of the modelA detailed description of the procedure for the validation of the model.Click here for file
Acknowledgements
We would like to acknowledge the Cell Preparation and Analysis Labora-
tory of the Alliance for Cellular Signaling (University of Texas Southwestern
Medical Center) and the Antibody Laboratory of the Alliance for Cellular
Signaling (University of Texas Southwestern Medical Center) for experi-
mental data. We would like to acknowledge Robert C Hsueh (Cell Prepa-
ration and Analysis Laboratory, Alliance for Cellular Signaling) and Ronald
Taussig (Cell Preparation and Analysis Laboratory, Alliance for Cellular Sig-
naling, and Department of Pharmacology, University of Texas Southwest-
ern Medical Center) for a preliminary review of this manuscript and
insightful discussions. This research was supported by National Institute of
Health Collaborative Grant U54 GM62114 (Alliance for Cellular Signaling),
National Institute of Health/Purdue University grant 1 R01-GM068959 (SS)
and a grant from the Hilblom foundation (SS).
References
1. Oppenheim JJ, Feldman M, Durum SK, Hirano T, Vilcek J, Nicola NA:
Cytokine Reference: A Compendium of Cytokines and Other Mediators of
Host Defense 1st edition. San Diego: Academic Press; 2000.
2. Oppenheim JJ, Feldmann M: Introduction to the role of cytokines
in innate host defense and adaptive immunity. In Cytokine Ref-
erence: A Compendium of Cytokines and Other Mediators of Host Defense
Volume 1. 1st edition. Edited by: Oppenheim JJ, Feldman M, Durum
2
2
e
r
2
e
d
2
e
r
2
e
d
2
Genome Biology 2006, Volume 7, Issue 2, Article R11 Pradervand et al. R11.13
comment reviews reports refereed researchdeposited research interactions information
Genome Biology 2006, 7:R11
SK, Hirano T, Vilcek J, Nicola NA. San Diego: Academic Press;
2000:3-20.
3. Ma J, Chen T, Mandelin J, Ceponis A, Miller NE, Hukkanen M, Ma GF,
Konttinen YT: Regulation of macrophage activation. Cell Mol
Life Sci 2003, 60:2334-2346.
4. Shaw G, Kamen R: A conserved AU sequence from the 3'
untranslated region of GM-CSF mRNA mediates selective
mRNA degradation. Cell 1986, 46:659-667.
5. Kontoyiannis D, Pasparakis M, Pizarro TT, Cominelli F, Kollias G:
Impaired on/off regulation of TNF biosynthesis in mice lack-
ing TNF AU-rich elements: implications for joint and gut-
associated immunopathologies. Immunity 1999, 10:387-398.
6. Barnes PJ, Karin M: Nuclear factor-kappaB: a pivotal transcrip-
tion factor in chronic inflammatory diseases. N Engl J Med
1997, 336:1066-1071.
7. Ozato K, Tsujimura H, Tamura T: Toll-like receptor signaling and
regulation of cytokine gene expression in the immune
system. Biotechniques 2002:66-68. 70, 72 passim.
8. Gilman AG, Simon MI, Bourne HR, Harris BA, Long R, Ross EM, Stull
JT, Taussig R, Bourne HR, Arkin AP, et al.: Overview of the
Alliance for Cellular Signaling. Nature 2002, 420:703-706.
9. The Alliance for Cellular Signaling (AfCS). [n
aling-gateway.org/]
10. Geladi P, Kowalski BR: Partial least-squares regression: a
tutorial. Analytica Chimica Acta 1986, 185:1-17.
11. Janes KA, Kelly JR, Gaudet S, Albeck JG, Sorger PK, Lauffenburger
DA: Cue-signal-response analysis of TNF-induced apoptosis
by partial least squares regression of dynamic multivariate
data. J Comput Biol 2004, 11:544-561.
12. Grove M, Plumb M: C/EBP, NF-kappa B, and c-Ets family mem-
bers and transcriptional regulation of the cell-specific and
inducible macrophage inflammatory protein 1 alpha imme-
diate-early gene. Mol Cell Biol 1993, 13:5276-5289.
13. Nagata S: G-CSF. In Cytokine Reference: A Compendium of Cytokines
and Other Mediators of Host Defense Volume 1. 1st edition. Edited by:
Oppenheim JJ, Feldman M, Durum SK, Hirano T, Vilcek J, Nicola NA.
San Diego: Academic Press; 2000:935-940.
14. Boneberg EM, Hartung T: Molecular aspects of anti-inflamma-
tory action of G-CSF. Inflamm Res 2002, 51:119-128.
15. Dunn SM, Coles LS, Lang RK, Gerondakis S, Vadas MA, Shannon MF:
Requirement for nuclear factor (NF)-kappa B p65 and NF-
interleukin-6 binding elements in the tumor necrosis factor
response region of the granulocyte colony-stimulating factor
promoter. Blood 1994, 83:2469-2479.
16. Cho YH, Lee CH, Kim SG: Potentiation of lipopolysaccharide-
inducible cyclooxygenase 2 expression by C2-ceramide via c-
Jun N-terminal kinase-mediated activation of CCAAT/
enhancer binding protein beta in macrophages. Mol Pharmacol
2003, 63:512-523.
17. Putland RA, Sassinis TA, Harvey JS, Diamond P, Coles LS, Brown CY,
Goodall GJ: RNA destabilization by the granulocyte colony-
stimulating factor stem-loop destabilizing element involves
a single stem-loop that promotes deadenylation. Mol Cell Biol
2002, 22:1664-1673.
18. Frevel MA, Bakheet T, Silva AM, Hissong JG, Khabar KS, Williams BR:
p38 Mitogen-activated protein kinase-dependent and -inde-
pendent signaling of mRNA stability of AU-rich element-
containing transcripts. Mol Cell Biol 2003, 23:425-436.
19. Dinarello CA: Biologic basis for interleukin-1 in disease. Blood
1996, 87:2095-2147.
20. Auron PE, Webb AC: Interleukin-1: a gene expression system
regulated at multiple levels. Eur Cytokine Netw 1994, 5:573-592.
21. Bailly S, Fay M, Israel N, Gougerot-Pocidalo MA: The transcription
factor AP-1 binds to the human interleukin 1 alpha
promoter. Eur Cytokine Netw 1996, 7:125-128.
22. McDowell TL, Symons JA, Duff GW: Human interleukin-1alpha
gene expression is regulated by Sp1 and a transcriptional
repressor. Cytokine 2005, 30:141-153.
23. Mori N, Prager D: Transactivation of the interleukin-1alpha
promoter by human T-cell leukemia virus type I and type II
Tax proteins. Blood 1996, 87:3410-3417.
24. Matsuda T, Hirano T: IL-6. In Cytokine Reference: A Compendium of
Cytokines and Other Mediators of Host Defense Volume 1. 1st edition.
Edited by: Oppenheim JJ, Feldman M, Durum SK, Hirano T, Vilcek J,
Nicola NA. San Diego: Academic Press; 2000:537-563.
25. Dendorfer U, Oettgen P, Libermann TA: Multiple regulatory ele-
ments in the interleukin-6 gene mediate induction by pros-
taglandins, cyclic AMP, and lipopolysaccharide. Mol Cell Biol
1994, 14:4443-4454.
26. Sanceau J, Kaisho T, Hirano T, Wietzerbin J: Triggering of the
human interleukin-6 gene by interferon-gamma and tumor
necrosis factor-alpha in monocytic cells involves cooperation
between interferon regulatory factor-1, NF kappa B, and Sp1
transcription factors. J Biol Chem 1995, 270:27920-27931.
27. Decker T: The molecular biology of type I interferons (IFN-a/
b) (gene activation, promoters, proteins induced). In Inter-
feron Therapy in Multiple Sclerosis Edited by: Reder AT. New York:
Marcel Dekker; 1997:41-76.
28. Barber SA, Fultz MJ, Salkowski CA, Vogel SN: Differential expres-
sion of interferon regulatory factor 1 (IRF-1), IRF-2, and
interferon consensus sequence binding protein genes in
lipopolysaccharide (LPS)-responsive and LPS-hyporespon-
sive macrophages. Infect Immun 1995, 63:601-608.
29. Takeda K, Kaisho T, Akira S: Toll-like receptors. Annu Rev Immunol
2003, 21:335-376.
30. Faggioli L, Costanzo C, Donadelli M, Palmieri M: Activation of the
Interleukin-6 promoter by a dominant negative mutant of c-
Jun. Biochim Biophys Acta 2004, 1692:17-24.
31. Silfversward CJ, Frost A, Brandstrom H, Nilsson O, Ljunggren O:
Interleukin-4 and interleukin-13 potentiate interleukin-1
induced secretion of interleukin-6 in human osteoblast-like
cells. J Orthop Res 2004, 22:1058-1062.
32. Sehgal PB: Regulation of IL6 gene expression. Res Immunol 1992,
143:724-734.
33. de Waal Malefyt R: IL-10. In Cytokine Reference: A Compendium of
Cytokines and Other Mediators of Host Defense Volume 1. 1st edition.
Edited by: Oppenheim JJ, Feldman M, Durum SK, Hirano T, Vilcek J,
Nicola NA. San Diego: Academic Press; 2000:165-185.
34. Brightbill HD, Plevy SE, Modlin RL, Smale ST: A prominent role for
Sp1 during lipopolysaccharide-mediated induction of the IL-
10 promoter in macrophages. J Immunol 2000, 164:1940-1951.
35. Bondeson J, Browne KA, Brennan FM, Foxwell BM, Feldmann M:
Selective regulation of cytokine induction by adenoviral
gene transfer of IkappaBalpha into human macrophages:
lipopolysaccharide-induced, but not zymosan-induced,
proinflammatory cytokines are inhibited, but IL-10 is nuclear
factor-kappaB independent. J Immunol 1999, 162:2939-2945.
36. Ma W, Lim W, Gee K, Aucoin S, Nandan D, Kozlowski M, Diaz-
Mitoma F, Kumar A: The p38 mitogen-activated kinase path-
way regulates the human interleukin-10 promoter via the
activation of Sp1 transcription factor in lipopolysaccharide-
stimulated human macrophages. J Biol Chem 2001,
276:13664-13674.
37. Liu YW, Tseng HP, Chen LC, Chen BK, Chang WC: Functional
cooperation of simian virus 40 promoter factor 1 and
CCAAT/enhancer-binding protein beta and delta in lipopol-
ysaccharide-induced gene activation of IL-10 in mouse
macrophages. J Immunol 2003, 171:821-828.
38. Platzer C, Docke W, Volk H, Prosch S: Catecholamines trigger
IL-10 release in acute systemic stress reaction by direct
stimulation of its promoter/enhancer activity in monocytic
cells. J Neuroimmunol 2000, 105:31-38.
39. Bonder CS, Finlay-Jones JJ, Hart PH: Interleukin-4 regulation of
human monocyte and macrophage interleukin-10 and inter-
leukin-12 production. Role of a functional interleukin-2
receptor gamma-chain. Immunology 1999, 96:529-536.
40. Ding YZ, Fu S, Zamarin D: Interleukin-10. In The Cytokine Handbook
Volume 1. 4th edition. Edited by: Thomson AW, Lotze MT. London:
Academic Press; 2003:603-625.
41. Poli V: The role of C/EBP isoforms in the control of inflamma-
tory and native immunity functions. J Biol Chem 1998,
273:29279-29282.
42. Sherry B, Franchin G: MIP-1a/CCL3, MIP-1b/CCL4. In Cytokine
Reference: A Compendium of Cytokines and Other Mediators of Host
Defense Volume 1. 1st edition. Edited by: Oppenheim JJ, Feldman M,
Durum SK, Hirano T, Vilcek J, Nicola NA. San Diego: Academic Press;
2000:1171-1213.
43. Davatelis G, Tekamp-Olson P, Wolpe SD, Hermsen K, Luedke C,
Gallegos C, Coit D, Merryweather J, Cerami A: Cloning and char-
acterization of a cDNA for murine macrophage inflamma-
tory protein (MIP), a novel monokine with inflammatory and
chemokinetic properties. J Exp Med 1988, 167:1939-1944.
44. Martin CA, Dorf ME: Differential regulation of interleukin-6,
macrophage inflammatory protein-1, and JE/MCP-1
cytokine expression in macrophage cell lines. Cell Immunol
1991, 135:245-258.
R11.14 Genome Biology 2006, Volume 7, Issue 2, Article R11 Pradervand et al. />Genome Biology 2006, 7:R11
45. Dean JL, Sarsfield SJ, Tsounakou E, Saklatvala J: p38 Mitogen-acti-
vated protein kinase stabilizes mRNAs that contain cycloox-
ygenase-2 and tumor necrosis factor AU-rich elements by
inhibiting deadenylation. J Biol Chem 2003, 278:39470-39476.
46. Rossi D, Zlotnik A: The biology of chemokines and their
receptors. Annu Rev Immunol 2000, 18:217-242.
47. Hiura TS, Kempiak SJ, Nel AE: Activation of the human RANTES
gene promoter in a macrophage cell line by lipopolysaccha-
ride is dependent on stress-activated protein kinases and the
IkappaB kinase cascade: implications for exacerbation of
allergic inflammation by environmental pollutants. Clin
Immunol 1999, 90:287-301.
48. Danoff TM, Lalley PA, Chang YS, Heeger PS, Neilson EG: Cloning,
genomic organization, and chromosomal localization of the
Scya5 gene encoding the murine chemokine RANTES. J
Immunol 1994, 152:1182-1189.
49. Rathanaswami P, Hachicha M, Sadick M, Schall TJ, McColl SR: Expres-
sion of the cytokine RANTES in human rheumatoid synovial
fibroblasts. Differential regulation of RANTES and inter-
leukin-8 genes by inflammatory cytokines. J Biol Chem 1993,
268:5834-5839.
50. Ohmori Y, Schreiber RD, Hamilton TA: Synergy between inter-
feron-gamma and tumor necrosis factor-alpha in transcrip-
tional activation is mediated by cooperation between signal
transducer and activator of transcription 1 and nuclear fac-
tor kappaB. J Biol Chem 1997, 272:14899-14907.
51. Miyamoto NG, Medberry PS, Hesselgesser J, Boehlk S, Nelson PJ,
Krensky AM, Perez HD: Interleukin-1beta induction of the
chemokine RANTES promoter in the human astrocytoma
line CH235 requires both constitutive and inducible tran-
scription factors. J Neuroimmunol 2000, 105:78-90.
52. Beutler B, Cerami A: The biology of cachectin/TNF – a primary
mediator of the host response. Annu Rev Immunol 1989,
7:625-655.
53. Campbell J, Ciesielski CJ, Hunt AE, Horwood NJ, Beech JT, Hayes LA,
Denys A, Feldmann M, Brennan FM, Foxwell BM: A novel mecha-
nism for TNF-alpha regulation by p38 MAPK: involvement of
NF-kappa B with implications for therapy in rheumatoid
arthritis. J Immunol 2004, 173:6928-6937.
54. Kuprash DV, Udalova IA, Turetskaya RL, Kwiatkowski D, Rice NR,
Nedospasov SA: Similarities and differences between human
and murine TNF promoters in their response to
lipopolysaccharide. J Immunol 1999, 162:4045-4052.
55. Foxwell B, Browne K, Bondeson J, Clarke C, de Martin R, Brennan F,
Feldmann M: Efficient adenoviral infection with IkappaB alpha
reveals that macrophage tumor necrosis factor alpha pro-
duction in rheumatoid arthritis is NF-kappaB dependent.
Proc Natl Acad Sci USA 1998, 95:8211-8215.
56. Tsai EY, Falvo JV, Tsytsykova AV, Barczak AK, Reimold AM, Glimcher
LH, Fenton MJ, Gordon DC, Dunn IF, Goldfeld AE: A lipopolysac-
charide-specific enhancer complex involving Ets, Elk-1, Sp1,
and CREB binding protein and p300 is recruited to the
tumor necrosis factor alpha promoter in vivo. Mol Cell Biol
2000, 20:6084-6094.
57. Diaz B, Lopez-Berestein G: A distinct element involved in
lipopolysaccharide activation of the tumor necrosis factor-
alpha promoter in monocytes. J Interferon Cytokine Res 2000,
20:741-748.
58. Hayes MP, Freeman SL, Donnelly RP: IFN-gamma priming of
monocytes enhances LPS-induced TNF production by aug-
menting both transcription and MRNA stability. Cytokine
1995, 7:427-435.
59. Ollivier V, Parry GC, Cobb RR, de Prost D, Mackman N: Elevated
cyclic AMP inhibits NF-kappaB-mediated transcription in
human monocytic cells and endothelial cells. J Biol Chem 1996,
271:20828-20835.
60. Carballo E, Lai WS, Blackshear PJ: Feedback inhibition of macro-
phage tumor necrosis factor-alpha production by
tristetraprolin. Science 1998, 281:1001-1005.
61. Kotlyarov A, Neininger A, Schubert C, Eckert R, Birchmeier C, Volk
HD, Gaestel M: MAPKAP kinase 2 is essential for LPS-induced
TNF-alpha biosynthesis. Nat Cell Biol 1999, 1:94-97.
62. Sasaki E, Tashiro T, Kuroki M, Seki M, Miyazaki Y, Maesaki S, Tomono
K, Kadota J, Kohno S: Effects of macrophage colony-stimulating
factor (M-CSF) on anti-fungal activity of mononuclear
phagocytes against Trichosporon asahii. Clin Exp Immunol 2000,
119:293-298.
63. AfCS Protocols. [ />colLinks.html]