Báo cáo y học: "Comparative profiling of the sense and antisense transcriptome of maize lines" pptx
Bạn đang xem bản rút gọn của tài liệu. Xem và tải ngay bản đầy đủ của tài liệu tại đây (553.1 KB, 18 trang )
Genome Biology 2006, 7:R22
comment reviews reports deposited research refereed research interactions information
Open Access
2006Maet al.Volume 7, Issue 3, Article R22
Research
Comparative profiling of the sense and antisense transcriptome of
maize lines
Jiong Ma, Darren J Morrow, John Fernandes and Virginia Walbot
Address: Department of Biological Sciences, Stanford University, Stanford, CA 94305-5020, USA
Correspondence: Virginia Walbot. Email:
© 2006 Ma et al.; licensee BioMed Central Ltd.
This is an open access article distributed under the terms of the Creative Commons Attribution License ( which
permits unrestricted use, distribution, and reproduction in any medium, provided the original work is properly cited.
Transcriptomes of different maize lines<p>Comparative transcriptome profiling of inbred maize lines demonstrates remarkable similarities and a large number of antisense tran-scripts.</p>
Abstract
Background: There are thousands of maize lines with distinctive normal as well as mutant
phenotypes. To determine the validity of comparisons among mutants in different lines, we first
address the question of how similar the transcriptomes are in three standard lines at four
developmental stages.
Results: Four tissues (leaves, 1 mm anthers, 1.5 mm anthers, pollen) from one hybrid and one
inbred maize line were hybridized with the W23 inbred on Agilent oligonucleotide microarrays
with 21,000 elements. Tissue-specific gene expression patterns were documented, with leaves
having the most tissue-specific transcripts. Haploid pollen expresses about half as many genes as
the other samples. High overlap of gene expression was found between leaves and anthers. Anther
and pollen transcript expression showed high conservation among the three lines while leaves had
more divergence. Antisense transcripts represented about 6 to 14 percent of total transcriptome
by tissue type but were similar across lines. Gene Ontology (GO) annotations were assigned and
tabulated. Enrichment in GO terms related to cell-cycle functions was found for the identified
antisense transcripts. Microarray results were validated via quantitative real-time PCR and by
hybridization to a second oligonucleotide microarray platform.
Conclusion: Despite high polymorphisms and structural differences among maize inbred lines, the
transcriptomes of the three lines displayed remarkable similarities, especially in both reproductive
samples (anther and pollen). We also identified potential stage markers for maize anther
development. A large number of antisense transcripts were detected and implicated in important
biological functions given the enrichment of particular GO classes.
Background
Maize geneticists and breeders utilize thousands of inbred
and hybrid lines in their research. The diversity of extant lines
reflects both the ease of crossing corn (Zea mays L.) and the
long life of seeds. These lines are derived from hundreds of
landraces collected in US farmers' fields and from native
Americans beginning in the early 20th century. Lineage
records track these materials, the crosses among them, and
the inbred lines derived over the past century [1,2]. Pheno-
typic differences between inbreds can be subtle or dramatic as
lines were bred for size, floral morphology, days to flowering,
seed constituents, and myriad other traits; distinctive alleles
Published: 13 March 2006
Genome Biology 2006, 7:R22 (doi:10.1186/gb-2006-7-3-r22)
Received: 2 November 2005
Revised: 13 January 2006
Accepted: 8 February 2006
The electronic version of this article is the complete one and can be
found online at />R22.2 Genome Biology 2006, Volume 7, Issue 3, Article R22 Ma et al. />Genome Biology 2006, 7:R22
as well as epistatic interactions between loci are the genetic
basis for these traits. Differences among lines are notable in
genetic analysis when a particular allele, such as a new
mutant allele, is introgressed into a range of inbred lines:
there can be a striking impact in some lines but a quenching
of the expected phenotypes in other lines [3]. Climatic condi-
tions at specific locations also constrain which lines will flour-
ish, reflecting differences in environmental responses.
Therefore, it is of great interest to quantify line-specific
aspects of gene expression that are the underlying basis for
phenotypic variation among inbreds and hybrids and to
determine the characteristic patterns of gene expression in
specific organs in multiple wild-type lines before examining
the impact of mutations on the transcriptome of developing
organs.
One complication in defining gene functions in maize is that
the species has a tetraploid genome from an event about 11 to
15 mya. The genome retains most of the duplicated chromo-
somal segments as well as more recently generated duplicated
genes [4]. Based on approximately 407,000 public Expressed
Sequence Tags, representing parts of gene transcripts, there
are 31,375 tentative contigs plus 27,207 singleton sequences
totaling approximately 58,582 possible genes (The Institute
for Genomic Research (TIGR) Maize Gene Index release 15.0,
September 2004), a number likely to shrink to approximately
50,000 with more complete transcript sequencing. Despite
the apparent redundancy of genes within this assembly, visi-
ble mutants are readily recovered [5]. At present, 6,505 maize
loci are defined [6]. Therefore, alleles of many individual
genes have distinctive functions in at least one tissue or organ
compared to related loci.
A key question that can be addressed with transcriptome pro-
filing is whether lines express the same loci in specific organs
and tissues. That is, does the normal phenotype of an organ
require that nearly all of the same genes be expressed and in
a quantitatively similar manner or can the wild-type condi-
tion be achieved despite significant variation in the transcrip-
tome? A related question is how distinctive the progression in
gene expression can be during organ development in pheno-
typically distinctive maize lines. A third question considers
whether some organs show more highly conserved patterns of
gene expression in diverse lines than other organs, suggesting
canalization of the regulatory alleles and of their targets in
specifying certain plant parts.
The topic of organ-specific gene expression within one hybrid
line was addressed previously by Cho et al. [7], who examined
7 organs of maize in a hybrid line composed of 75% inbred
K55, 20% W23, and 5% Robertson's Mutator stocks; for roots,
leaf blades, and leaf sheaths several developmental stages
were examined. A printed cDNA microarray containing
approximately 5,600 different genes was used for transcrip-
tome profiling, and the data generated were sufficient to
organize a hierarchy of relatedness among the tested organs.
As expected, all leaf blade samples clustered together with
leaf sheaths as a close sister group; organs associated with
reproduction, whether photosynthetic husk leaves or floral
organs, clustered together. A major limitation in this study
was that cross-hybridization among family members would
be expected to obscure many interesting patterns of gene
expression; indeed, only 7% of the queried cDNAs showed
organ-specific expression, as would be expected if a gene class
was required in all the examined organs [7]. The cDNA array
format could not determine which member of a recently
duplicated gene pair or gene family was expressed in each
organ; on a limited scale, suites of oligonucleotide probes
printed on the same slide for a few selected gene families
showed that short oligonucleotide probes could provide gene-
specific data necessary to resolve which family members are
expressed in specific patterns [7].
To begin to answer the question of organ-specific expression
and to determine the congruence in transcriptomes among
lines, a new microarray platform containing in situ synthe-
sized 60-mer oligonucleotide probes was employed. A refer-
ence design experiment comparing the W23 and A619
derivative lines and W23 and the F1 ND101/W23 hybrid was
used with samples from juvenile leaves, mature pollen, and
two stages of anther development. In this way, we could
examine overlap in gene expression between vegetative, flo-
ral, and haploid gametophyte stages as well as determining
the similarities between lines. For our validation analysis,
both quantitative RT-PCR and hybridization to a second oli-
gonucleotide-based microarray platform were employed.
Results
Biological materials and study design
The W23, ND101, and an A619 derivative are Corn Belt Dent
varieties, a classification based on origin and seed morphol-
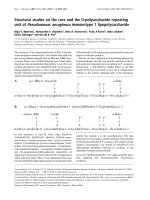
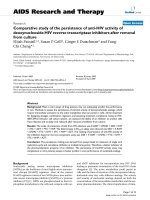
Design of the array experimentsFigure 1
Design of the array experiments. Thirty-six independent biological samples
(or pools of staged tissues from the same tassel in the case of the anthers
and pollen) were used for eight comparisons. The same aliquot of the
W23 sample was used to hybridize to ND101/W23 and A619. Fluorescent
dye labeling of each sample is indicated with colors: red for Cy5 and green
for Cy3.
juvenile
leaf
anther
1.5 mm
pollen
anther
1
mm
W23
ND101/W23
A619
Genome Biology 2006, Volume 7, Issue 3, Article R22 Ma et al. R22.3
comment reviews reports refereed researchdeposited research interactions information
Genome Biology 2006, 7:R22
ogy, but they share no recent common ancestor [1]. They are
very similar in gross morphology at all stages of development,
but can be distinguished in quantitative traits such as days to
flowering, typical seed set, leaf length and width (data not
shown). One specific motivation for choosing these lines is
that we have begun analyzing male-sterile mutants of maize
that are available in these three particular backgrounds. The
lines were grown in a common field and four organ types -
juvenile leaf blade, 1 mm anther, 1.5 mm anther, and haploid
pollen - were recovered for comparison. Mature anthers are
sacs composed of four concentric rings of somatic tissue lay-
ers; in the middle of each anther hundreds of pre-germinal
cells initiate meiosis [8]. Four haploid gametophytes (pollen
grains) develop from each meiosis; each pollen grain contains
two sperm cells required for the double fertilization charac-
teristic of maize and other flowering plants. Based on Cho et
al. [7], the expectation was that leaf, anther, and pollen sam-
ples would exhibit approximately an equal number of organ-
specific transcripts and that the two anther stages would be
significantly more similar to each other than to either leaf or
pollen. Although these two stages are only one day apart, they
are very distinctive developmentally. Within the 1 mm anther,
cell divisions are common in the epidermis, in the three inter-
nal somatic layers (endothecium next to the epidermis, mid-
dle layer, and then tapetum), and in the innermost cell group
of pre-germinal cells [9]. Although the somatic cells are
already organized into the concentric rings characteristic of a
mature anther, cellular specializations are incomplete; the
pre-germinal cell population is still expanding, and there is
no evidence of pre-meiotic cells (data not shown). At the 1.5
mm stage, each of the cell layers has further differentiated
and, based on chromosomal condensation characteristics,
meiosis will soon initiate in some of the pre-germinal cells (L
Harper and WZ Cande, personal communication).
Complementary RNAs (cRNAs) from the four tissue stages of
A619, hybrid ND101/W23, and inbred W23 were used in two-
sample comparisons on a 60-mer in situ synthesized array
platform (Agilent platform; see Materials and methods for
details). As shown in Figure 1, 36 independent biological sam-
ples were used for 8 comparisons. The reference design pro-
duced six hybridization results for each W23 stage, and there
are three biological replicates of the other two lines at each
stage. W23 is the standard inbred line for our introgression
program and has been previously employed in transcriptome
profiling experiments involving leaf tissue [10]; it is the maize
line with the most publicly available transcriptome profiling
results at the present time.
Because the maize genome has not yet been sequenced, the
22,000 probes for the Agilent arrays were designed from the
MaizeGDB December 2003 EST assemblies [11]. Later these
probes were mapped onto the TIGR Maize Gene Index assem-
blies (release 15.0, September 2004). In summary, these
probes represent approximately 8,000 sense transcripts,
approximately 5,000 antisense transcripts, and approxi-
mately 8,000 transcripts with undetermined orientation in
this classification. Probes showing significant hybridization
were manually analyzed to refine their classification as sense
or antisense, and we estimate the array had probes to approx-
imately 13,000 sense transcripts. Note that in the rest of the
text, transcripts denote RNA species that were detected on
the arrays because they hybridized to one or more oligo
probes, either sense or antisense. Generally, the number of
hybridized probes is larger than the number of possible tran-
scripts, because there are two or more probes for a subset of
genes. When we discuss antisense transcripts, we refer to
RNA species that overlap with a known or highly likely cDNA
on the reverse strand. The exact length of overlap is not
known, but one or more probes to the antisense strand
hybridized to the RNA sample with a dye signal above the
background threshold. A concern regarding such transcripts
might be their generation during cDNA synthesis through
fold back self-priming. This will not be a significant problem
for the oligo array platform because cRNAs were produced
and labeled for hybridizations, although the precise represen-
tation of most transcripts was not independently verified in
the cRNAs (see Materials and methods).
To identify probes that hybridized, we used an iterative
approach and generated statistics from probes that are above
background signals in all hybridizations (see Materials and
methods for details). Analysis of the final results showed that
the thresholds chosen were around the 90th percentile of
median signals for the known antisense probes, most of which
fail to hybridize with target RNAs, providing a reasonable
cross validation of the approach (data not shown). Another
benefit of this approach is to remove variances between bio-
logical replicates reflecting environmental factors, although
this kind of difference is small compared to true line-specific
expression differences. For the whole probe set, the correla-
tion coefficients of the raw dye median intensities between
each pair of biological replicate are mostly between 0.95 and
0.98, even when they were labeled with different dyes and
presumably dye bias could have an effect. This is comparable
to technical variances as assessed by duplicated probes on the
arrays and both can be removed effectively by our approach.
Distinctive patterns of gene expression in organs and
by genetic background
As shown in Table 1, approximately 5,700 transcripts showed
a positive hybridization signal in each anther and juvenile leaf
sample. In contrast, about half as many transcript types were
detected in pollen samples. Because the probe designs were
based on EST data, they are weighted toward more highly
expressed genes, and we therefore consider it significant that
specific probes fail to hybridize with certain tissue samples.
The total transcriptome of each sample is likely to be consid-
erably larger than reported here, because the array platform
contains probes to detect only about 25% of the expected gene
transcripts of maize [12].
R22.4 Genome Biology 2006, Volume 7, Issue 3, Article R22 Ma et al. />Genome Biology 2006, 7:R22
In terms of gene expression patterns, the juvenile leaves had
the most distinctive transcriptome, with approximately 18%
tissue-specific transcripts in A619, ND101/W23 and W23
compared to anthers or pollen. Pollen, representing a 10 to 20
minute interval during pollen shed from the anther, was the
most discrete stage collected in terms of temporal develop-
ment; pollen contained approximately 14% sample-specific
transcripts in the three lines examined. Anther stages, which
differ by one or two days of development, exhibited approxi-
mately 5% stage-specific transcripts at the 1 mm size and
approximately 4% stage-specific transcripts at the 1.5 mm
stage. If the anther data are combined and treated as one
stage for comparison to pollen and juvenile leaf, anther-spe-
cific transcripts increase to 20% (Figure 2f), and collectively
exceed the juvenile leaves.
Because a two-color hybridization protocol was employed in
which each A619 or hybrid ND101/W23 sample was com-
pared to W23, it was also feasible to define differentially
expressed genes in the paired tests. A619 showed more differ-
ences compared to W23 than did the F1 hybrid of ND101 with
W23; there were approximately 300 differentially expressed
genes in each anther stage and in leaf in the A619-W23 com-
parison and fewer than 100 for pollen. The number of differ-
ences in the W23-ND101/W23 comparison was about half of
the A619 differences in the anther samples but very similar
for the other two tissues. Although parentage should be
highly predictive of gene expression patterns, and it would
therefore be logical to expect A619 to be more distinctive than
the F1 hybrid, hybrid vigor is an important consideration.
This phenomenon was discovered in maize at the beginning
of the 20th century [13]; after inbreeding depresses plant
yield and growth, combination with another inbred line typi-
cally yields an F1 hybrid far superior to either parent, suggest-
ing significant changes in gene expression. Nonetheless, for
the lines examined here, the ND101/W23 hybrid is more sim-
ilar to W23 than the heterologous A619 line.
The complete results from the analysis of the common and
unique transcript types in each genotype as well as across tis-
sues are shown using Venn diagrams in Figure 2. Pollen and
both anther stages have highly conserved transcriptome pat-
terns, because fewer than 1% (both pollen and 1 mm anther)
or about 1% (1.5 mm anther) of the transcripts are uniquely
expressed in one line compared to the total shared in all 3
genotypes. In contrast, approximately 3% of the transcripts
are line-specific in juvenile leaves. A global genotype analysis
was conducted (Figure 2e) in which all four tissue samples
were combined within each genotype. Comparing the three
genotypes on this basis again highlights that A619 is the most
distinctive, while W23 and the hybrid ND101/W23 are much
closer in transcriptome pattern. In the global tissue analysis
(Figure 2f), only transcripts that are expressed in all 3 lines
(7,367 in total) were considered, and the 2 anther stages were
treated as a single tissue type. There were 2,038 transcript
types in common among the three biological sample types,
the beginning of an enumeration of constitutively expressed
or 'housekeeping' genes for maize. In the global assessment it
is also clear that juvenile leaf and anthers share many tran-
scripts in common (2,571), twice the number that each organ
uniquely expressed. Pollen and the other two tissue types
share approximately 150 transcripts each, about 11% of the
2,691 pollen transcripts found, indicating that although fewer
transcripts are expressed than in other tissues examined
(compare to 5,925 for anthers and 5,693 for leaf), there is a
distinctive suite of transcripts present in pollen (>13% unique
transcripts).
An alternative method of assessing the relatedness among the
samples is to construct clustering trees as shown in Figure 3.
In Figure 3a, the tree is based on the log2 ratios of A619 and
ND101/W23 transcripts each in comparison to the W23
inbred line. Pollen is the most distinctive sample type, while
leaves and anthers cluster together. In this diagram, it is clear
that the 1.0 and 1.5 mm anther stages of each genotype share
more in common than the length-based stage of one genotype
shares with the comparable length sample from the second
genotype. Although length is a reliable classification method
in the sense that anthers elongate and enlarge progressively
throughout development, the precise developmental stage in
terms of transcriptome is clearly complicated by genotype dif-
ferences and unavoidable inaccuracies in sample collection.
Table 1
Transcript expression analyzed by biological sample type
A619 ND101/W23 W23
Total Tissue-
specific
Diff. exp
(vs W23)
Total Tissue-
specific
Diff. exp
(vs W23)
Total Tissue-
specific
Anther 1 mm 5,647 261 288 5,544 222 157 5,612 274
Anther 1.5 mm 5,714 201 278 5,564 155 163 5,690 214
Pollen 2,699 338 87 2,709 356 84 2,704 343
Juvenile leaf 5,873 967 320 5,810 971 237 5,770 909
Classes of hybridization are defined as follows: Total is the sum of all hybridizing transcripts; Tissue-specific probes exhibited positive hybridization
signals in only one sample type, and differentially expressed (Diff. exp) transcripts were up- or down-regulated compared to the W23 reference
samples in a particular tissue comparison. See Materials and methods for details.
Genome Biology 2006, Volume 7, Issue 3, Article R22 Ma et al. R22.5
comment reviews reports refereed researchdeposited research interactions information
Genome Biology 2006, 7:R22
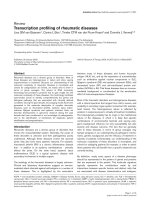
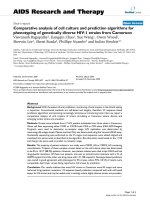
Venn diagrams of transcript representationFigure 2
Venn diagrams of transcript representation. (a-d) Tissue analysis: the transcripts shared among the three genotypes at the four developmental stages
examined are depicted. (e) Overlap between transcripts pooled for each line. (f) Overlap between conserved transcripts among the three lines for each
tissue type. Transcripts hybridized in either of the two anther samples were combined to form a single collection.
25
5,471
6
45
106
22
13
A619
(5,647)
ND101/W23
(5,544)
W23
(5,612)
1 mm anther
30
5,476
8
50
158
30
26
A619
(5,714)
ND101/W23
(5,564)
W23
(5,690)
1.5 mm anther
4
2,691
10
4
0
4
9
A619
(2,699)
ND101/W23
(2,709)
W23
(2,704)
mature pollen
121
5,693
26
42
17
49
11
A619
(5,873)
ND101/W23
(5,810)
W23
(5,770)
juvenile leaf
108
7,367
33
41
114
49
39
A619
(7,630)
ND101/W23
(7,490)
W23
(7,569)
all 4 tissues combined
1176
2,038
356
140
2,571
157
927
anthers
(5925)
pollen
(2,691)
juvenile leaf
(5,693)
conserved expression transcripts
(e)
(a) (b)
(c) (d)
(f)
R22.6 Genome Biology 2006, Volume 7, Issue 3, Article R22 Ma et al. />Genome Biology 2006, 7:R22
This conclusion is reinforced when the normalized log2 abso-
lute intensities from all three genotypes are used for
constructing the tree (Figure 3b). The hierarchy of related-
ness is similar to the global tissue analysis in Figure 2 in
which pollen is the most distinctive and juvenile leaves cluster
(distantly) with the anther samples.
These data also greatly extend the list of presumptive stage-
specific genes in maize, and because 60-mer oligonucleotide
probes were used, an assignment of a specific locus is usually
secure. Lists of stage-specific genes that are expressed in all
three lines are in Additional data files 1, 2, 3, 4. Figure 4 shows
some of the potential markers identified. The expression val-
ues are log2 of absolute dye signals normalized against the
median of all the hybridized probes in a given sample; there-
fore, they are comparable between lines and tissues. The
accession numbers are from MaizeGDB [11], TIGR [14], or
NCBI GenBank. It is quite striking that some of the
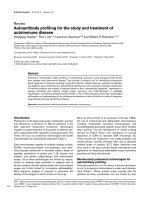
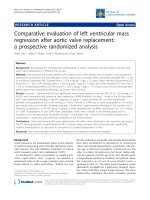
Average linkage clustering trees based on correlation measure based distance (uncentered)Figure 3
Average linkage clustering trees based on correlation measure based distance (uncentered). Distances are calculated from (a) log2 ratios of either A619
versus W23 or ND101/W23 versus W23 and (b) normalized log2 absolute intensities. See Materials and methods for details.
A619
ND101/W23
ND101/W23
A619
ND101/W23 (1 mm)
ND101/W23 (1.5 mm)
A619 (1 mm)
A619 (1.5 mm)
juvenile leaf
anther
pollen
0 0.291 0.581 0.872
(a)
(b)
juvenile leaf
anther
pollen
W23
ND101/W23
A619
ND101/W23 (1 mm)
ND101/W23 (1.5 mm)
W23 (1 mm)
W23 (1.5 mm)
A619 (1 mm)
A619 (1.5 mm)
ND101/W23
W23
A619
0
0.255 0.509 0.764
Genome Biology 2006, Volume 7, Issue 3, Article R22 Ma et al. R22.7
comment reviews reports refereed researchdeposited research interactions information
Genome Biology 2006, 7:R22
photosynthesis genes, including two Photosystem I assembly
protein ycf3 homologs (TC250914 and ZMtuc03-08-
11.22787) and a chloroplast 50S ribosomal protein L16
(TC258783), are highly expressed not only in the leaf as
expected but also in the early anther stage (1 mm stage).
These transcripts decrease at the next stage of anther devel-
opment just prior to meiosis, although they were still detect-
able. A cigulin-like gene (AW065766), a nucleolar gene
(TC259684), and an unknown gene (TC262912) are poten-
tially markers for the 1 mm anther stage (Figure 4). There are
also several good marker candidates for the more advanced
1.5 mm anther stage, including a putative nonsense-mediated
mRNA decay trans-acting factor (TC278427) and a male fer-
tility protein (TC276985), annotated as a strictosidine syn-
thase, a key enzyme in alkaloid biosynthesis. TC276985
turned out to be the ms45 gene; the gene product was found
to be localized to the tapetum and expressed maximally dur-
ing the early vacuolate microspore stage of anther develop-
ment [15]. This literature report validates one of the stage
markers and increases confidence in the additional proposed
markers.
Enrichment of Gene Ontology classes
To gain further insight into processes that change during
anther development, we analyzed the functional interactions
between gene classes in the transcriptomes under study.
There is currently no official release of Gene Ontology (GO)
annotations for maize genes; therefore, we used the program
Blast2GO [16] to assign GO terms based on protein sequence
similarities and associations. We also downloaded GO anno-
tations for the TIGR Maize Gene Index sequences, if availa-
ble. Subsequently, the Gossip program was used to find
statistically significant enrichment of certain GO terms in the
test group against a reference group [17]. For the expressed
sequences, 5,338 were successfully assigned at least one GO
term. Each test group is a specific class of transcripts, for
example, anther-specific transcripts. For this test group, the
reference group was the remaining GO-annotated transcripts
that do not belong to the test group; these test and reference
groups were compared to search for significant enrichment
(Table 2).
In general, the GO analysis displayed very consistent patterns
in accordance with already well-known functions of a given
tissue type (Table 2). Leaf-specific genes are abundant with
terms related to the plastid (GO:9536) and the key step in
photosynthesis, oxygen binding (GO:19825). Over-repre-
sented GO terms for anther-specific genes include cyclin-
dependent protein kinase regulator activity (GO:16538), DNA
replication initiation (GO:6270), and a great number of genes
involved in nucleic acid metabolism (GO:6139). On the other
hand, pollen-specific genes are enriched in pectin esterase
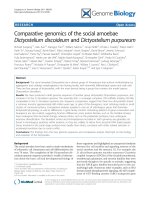
Potential marker genes for the two anther stages based on similar expression values in all three linesFigure 4
Potential marker genes for the two anther stages based on similar expression values in all three lines. The coloring is based on the log2 values of absolute
dye intensities normalized to the median value of all hybridized probes in a given tissue sample. The high and low expression probes are shown in red and
green, respectively: the higher the absolute value of the hybridization signals deviates from the median, the brighter the color. A, A619; N, ND101/W23
hybrid; W, W23.
6,629 TC250914 Photosystem I assembly protein ycf3 homologue
16,421 TC258783 Chloroplast 50S ribosomal protein L16
20,464 ZMtuc03-08-11.22787 Photosystem I assembly protein ycf3 homologue
9,594 TC261538 unknown
7,453 TC267764 unknown
3,676 ZMtuc02-12-23.7573 unknown
9,976 AI987363.1 unknown
2,011 ZMtuc03-08-11.26391 similar to 26S proteasome regulatory particle non-ATPase subunit10
9,061 TC278427 Similarity to nonsense-mediated mRNA decay trans-acting factors
15,967 TC273116 unknown
18,153 TC276985 homologue to Male fertility protein (MS45)
1,102 TC257338 Proline-rich protein-like
15,632 AW163847.1 Beta-N-acetylhexosaminidase-like protein
12,067 TC259684 Nucleolar protein
7,693 AW065766 Cingulin-like
19,113 TC262912 unknown
anther 1 mm
anther1.5 mm
pollen
juvenile leaf
A N W A N W A N W A N W
Probe Acc.# Gene product
R22.8 Genome Biology 2006, Volume 7, Issue 3, Article R22 Ma et al. />Genome Biology 2006, 7:R22
Table 2
Significantly enriched GO terms in transcript groups
GO term Number in test group Number in
reference group
GO description
Anther-specific (667)
16,538 7 2 Cyclin-dependent protein kinase regulator activity
6,139 120 591 Nucleobase, nucleoside, nucleotide and nucleic acid metabolism
6,270 5 1 DNA replication initiation
Pollen-specific (165)
30,599 9 10 Pectinesterase activity
4,857 10 23 Enzyme inhibitor activity
16,787 54 789 Hydrolase activity
31,410 39 513 Cytoplasmic vesicle
16,023 39 513 Cytoplasmic membrane-bound vesicle
16,789 10 38 Carboxylic ester hydrolase activity
4,553 12 62 Hydrolase activity, hydrolyzing O-glycosyl compounds
45,045 39 547 Secretory pathway
46,903 39 550 Secretion
16,798 12 69 Hydrolase activity, acting on glycosyl bonds
5,576 8 28 Extracellular region
42,545 4 2 Cell wall modification
6,810 57 1,063 Transport
51,234 57 1,065 Establishment of localization
3,779 6 16 Actin binding
51,179 57 1,068 Localization
8,092 7 25 Cytoskeletal protein binding
30,234 10 65 Enzyme regulator activity
45,330 3 1 Aspartyl esterase activity
7,010 10 68 Cytoskeleton organization and biogenesis
3,824 94 2,170 Catalytic activity
5,618 6 22 Cell wall
30,312 6 24 External encapsulating structure
8,150 136 3,596 Biological_process
30,036 5 16 Actin cytoskeleton organization and biogenesis
Leaf-specific (490)
9,536 152 1,073 Plastid
19,825 5 3 Oxygen binding
Expressed in all three tissue types (1,091)
12,505 29 43 Endomembrane system
Differentially expressed, ND101/W23 pollen versus W23 pollen (47)
43,067 4 28 Regulation of programmed cell death
42,981 4 28 Regulation of apoptosis
6,916 3 12 Anti-apoptosis
43,069 3 14 Negative regulation of programmed cell death
43,066 3 14 Negative regulation of apoptosis
Differentially expressed, ND101/W23 juvenile leaf versus W23 juvenile leaf (158)
16,491 22 304 Oxidoreductase activity
9,507 15 169 Chloroplast
9,579 7 40 Thylakoid
Only transcripts that showed detectable expression in all three lines were considered. The number of transcripts with GO terms assigned for each
test group is shown in parentheses following the group description. The reference group comprises the rest of the transcriptome. The p values for
each GO term are: p < 0.0005 for single testing, FWER adjusted p < 0.1 and FDR < 0.1. See Materials and methods for details.
Genome Biology 2006, Volume 7, Issue 3, Article R22 Ma et al. R22.9
comment reviews reports refereed researchdeposited research interactions information
Genome Biology 2006, 7:R22
activity (GO:30599), a gene family that has been shown to
function specifically late in pollen development [18],
hydrolase activity (GO:16787), secretory pathway and secre-
tion (GO:46903), transport (GO:6810), cell wall modification
and cytoskeleton activities, among many other cellular func-
tionalities that underlie a series of biological processes during
pollen maturation. Not surprisingly, the ubiquitous
endomembrane system (GO:12505) is represented in all tis-
sue types. These results indirectly confirmed the utility of
mining the GO data structure by this method. When we tested
the differentially expressed gene groups, none showed any
significant over-representation except in the comparison of
W23 samples to the ND101/W23 pollen and juvenile leaf
(Table 2). Interestingly, the GO analysis showed that the
differentially expressed genes in the ND101/W23 hybrid pol-
len sample are enriched in negative regulators of apoptosis
and programmed cell death (GO:43067, GO:6916). In the leaf
sample, genes involved in oxidoreductase activity (GO:16491)
and chloroplast (GO:9507) functions are differentially regu-
lated. The functional significance of these gene regulations to
the plant and their possible connection to the hybrid genomic
background remain to be tested.
Antisense transcripts detected for many genes
Natural antisense transcripts (NATs) have been identified
experimentally and predicted computationally from many
organisms, including human, mouse, yeast, fruit fly, and Ara-
bidopsis [19-23]. By definition, NATs contain sequences com-
plementary to the sense transcripts of protein-coding genes.
They may be transcribed in cis from the reverse strand (called
cis-NAT) or in trans from separate loci (called trans-NAT). In
eukaryotes, the majority of NATs are of the cis type. Unex-
pectedly, NATs are common: up to 20% of human genes have
a NAT. Furthermore, many NATs are conserved, implying
regulatory functions for these transcripts in eukaryotic gene
expression [22,24,25]. To address the question of what frac-
tion of maize genes might be regulated through an antisense
transcript, the array platform was constructed to contain
approximately 5,000 probes to detect the antisense strand of
gene models constructed from EST assemblies; in some cases
more than one 60-mer antisense oligo was designed per gene.
In Table 3, the percentages in the antisense category versus
the total transcripts detected (Table 1) are shown for all four
developmental stages in the three genotypes. The percentages
of antisense transcripts are highly consistent within each tis-
sue type but there is substantial diversity among the tissues.
In detail, the three tissue samples with approximately 5,700
hybridizing probes in toto exhibited different percentages of
antisense transcripts: 11% for juvenile leaf, 6.5% for 1 mm
anther, and 7.5% for 1.5 mm anther. Even more strikingly,
14.3% of the pollen transcriptome consists of antisense tran-
scripts. These results indicate that a surprisingly large frac-
tion of maize genes are represented by a detectable antisense
transcript. As with sense transcripts, there is considerable
overlap in the tissue distribution of the antisense transcripts,
although very consistent percentages of the transcripts were
tissue-specific. Strikingly, more than one-third of the
antisense transcripts in juvenile leaves are found only in that
tissue source in each genotype, with about 10% stage-specific
antisense transcript present in the pollen and 1.5 mm anthers
while only about 4% of the detected antisense transcripts in 1
mm anther were found only in that stage (Table 3).
The distribution patterns of these detected antisense tran-
scripts among the three lines are shown in a Venn diagram
(Figure 5a). These patterns are extremely similar to the distri-
bution of overall (both sense and antisense) transcripts; only
about 2% of the antisense transcripts are unique to one line,
and more than 95% are shared among the three lines. This
Table 3
Analysis of antisense transcripts in the total transcriptome
N (%/total) Tissue-specific (%) Differentially expressed
A619 Anther 1 mm 377 (6.6) 16 (4.2) 3
Anther1.5 mm 435 (7.6) 39 (8.9) 5
Pollen 388 (14.3) 44 (11.3) 2
Juvenile leaf 644 (10.9) 214 (33.2) 4
ND101/W23 Anther 1 mm 372 (6.7) 17 (4.6) 0
Anther1.5 mm 399 (7.2) 23 (5.8) 0
Pollen 387 (14.3) 46 (11.9) 0
Juvenile leaf 638 (11.0) 215 (33.7) 15
W23 Anther 1 mm 366 (6.5) 15 (4.1) -
Anther1.5 mm 433 (7.6) 40 (9.2) -
Pollen 387 (14.3) 44 (11.4) -
Juvenile leaf 642 (11.1) 215 (33.5) -
R22.10 Genome Biology 2006, Volume 7, Issue 3, Article R22 Ma et al. />Genome Biology 2006, 7:R22
striking consistency makes it likely that these antisense tran-
scripts are biologically functional rather than array artifacts.
In Figure 5b, we then combined the two anther stages and
considered only the 756 antisense transcripts (Figure 5a)
shared among all three lines. Compared to the global distribu-
tion, there are both more tissue-specific (41% ((58 + 45 +
210)/756) compared to 33%) and more common (shared
among all 3 tissue types; 37% compared to 28%) antisense
transcripts. Furthermore, the percentages of antisense
transcripts versus the corresponding total transcript category
(Figure 2f) are vastly disparate. Specifically, only 5% of the
anther-specific transcripts (58 out of 1,176) are categorized as
antisense, compared to 13% of pollen-specific and 23% of
leaf-specific transcripts. Therefore, the transcriptomes of
both pollen and leaf contain more tissue-specific antisense
species than do anthers; anthers express mainly common
antisense transcripts. An outcome of considering the anti-
sense transcripts separately is that approximately 14% (278
out of 2,038) of the total common transcripts shared among
all 3 tissue types and 14% of the transcripts shared between
pollen and anthers are antisense. In pair-wise comparisons,
only 4% of the transcripts shared between leaf and anthers
are antisense, in sharp contrast to the transcripts shared
between only pollen and leaf, 29% of which are likely to be
antisense.
Because NATs are often discussed in the context of the corre-
sponding sense transcripts, we identified 1,063 potential
transcripts on the array that are represented by at least one
pair of sense-antisense probes. Considering all the hybridiza-
tion data, for 136 such pairs both probes hybridized, indica-
tive of both sense and antisense transcripts in the RNA
samples (see Additional data file 5), for 665 only sense probes
hybridized, and for 41 only antisense probes hybridized (data
not shown).
A GO classification was conducted to determine the represen-
tation of antisense transcripts detected by the arrays. We
were able to assign GO annotations to 732 transcripts that
showed above-background hybridizations to at least one anti-
sense probe. When comparing the represented genes with the
whole set of hybridized transcripts with GO terms assigned,
two classes dominated the GO classifications (Table 4). One
belongs to organismal physiological processes (GO:50874);
these are processes pertinent to the organism functions above
the cellular level and include the integrated processes of tis-
sues and organs. Other enriched terms include perception of
light and photosynthetic electron transport. A large fraction
of these are 'organismal physiological processes'. Another
unexpected finding was the over-representation in the
antisense group of cell cycle related transcripts (Table 4),
especially genes with homologies to spindle pole and spindle
body related genes in other organisms, although plants lack a
spindle pole during mitosis. There are 21 genes in the cell
cycle related sub-classes that have detectable antisense
transcripts, and each of the three tissue types expresses at
least 14 of them. Three of the 21 had transcripts in both sense
and antisense orientation. In addition, fifty-seven genes in
these sub-classes had only sense probes on the arrays. The
relationships between these GO terms are diagramed in
Figure 6. The prevalence of antisense transcripts for genes
involved in such critical cellular processes will motivate a
more detailed study of the true function of these antisense
transcripts.
Validation of microarray data
Two approaches were employed to validate the results of the
array hybridization experiments. Quantitative real-time PCR
(qRT-PCR), which has been widely used for selective verifica-
tion of array results, was employed for 23 examples of genes
expressed in all or a subset of specific tissue types. The
expression levels of these genes cover a wide spectrum so that
we could compare the resolution and relative accuracy of the
two techniques. We picked two internal standards for each
tissue stage based on published results [26] or their known
stable expression in a given tissue in maize or other plant
organisms, for example the heat shock 70 kDa protein (see
Additional data file 6). Again we used the four stages from
W23 and ND101/W23 with which we did the microarrays,
and two to four biological replicates of independent biological
samples were tested for this panel of genes. The results were
averaged to remove both biological variances caused by envi-
ronmental factors and technical variances. As shown in Fig-
ure 7, there is a good correspondence (r
2
= 0.61 when
excluding 9 apparent outliers) between the qRT-PCR log2
ratios and the array log2 ratios (ND101/W23 compared to
W23). Of the 18 transcripts whose expressions were not
detected by the arrays for any given stage (not plotted in Fig-
ure 7; see Additional data file 6), 14 were not detected by qRT-
PCR either, further confirming the correspondence between
the two methods. It also provided supporting evidence for our
assessment of a gene transcript being 'present' or 'absent'
solely based on array hybridization intensities. The 'outliers'
were most likely caused by cross hybridizations from highly
Distribution of antisense transcriptsFigure 5
Distribution of antisense transcripts. (a) Global analysis of antisense
transcripts in all four tissue samples combined. (b) Tissue analysis of the
756 antisense transcripts conserved in all three lines, after pooling data for
the two anther stages into one collection.
9
756
2
1
18
2
4
A619
(784)
ND101/W23
(761)
W23
(780)
all 4 tissues combined
58
278
45
19
101
45
210
anthers
(456)
pollen
(387)
juvenile leaf
(634)
conserved anti-sense transcripts
(a) (b)
Genome Biology 2006, Volume 7, Issue 3, Article R22 Ma et al. R22.11
comment reviews reports refereed researchdeposited research interactions information
Genome Biology 2006, 7:R22
similar gene family members in the array results. Any further
analysis of these probes/genes will have to wait until the com-
plete genome sequence becomes available.
A more complete validation was performed by repeating the
A619/W23 hybridizations with the identical anther RNA
samples utilized on the 60-mer in situ synthesized array to a
second microarray platform consisting of 70-mer spotted oli-
gonucleotides on 2 slides. Slide A of this platform contained
29,270 maize gene oligos plus a number of controls, and thus
has more than twice as many sense gene probes as the Agilent
platform. There are 3,568 genes represented on both plat-
forms in the same orientation: 1,155 of these partially overlap
(that is, they were designed to the same region of the gene)
and 2,413 of the probes are designed to different parts of the
same gene model. As shown in Figure 8a, for the probes
designed to the same region of the gene (within 30 bases),
there is a very good correspondence (r
2
= 0.77) between the
log2 intensity ratios. These data cross-validate the two
platforms as reporting the same transcriptome information
for many genes. The correspondence is good for probes that
hybridize to different parts of a gene transcript (Figure 8b; r
2
= 0.56). Slide B of the second platform has 27,339 maize gene
oligos. Of these, 4,092 match genes represented on the Agi-
lent array with 1,294 designed to the same gene region and
2,798 oligos in different gene regions. Similar correlation
coefficients were observed for the log2 ratios for the two
categories of oligos (r
2
= 0.75 and 0.44, respectively; data not
shown).
Discussion
Maize has been shown to display considerable genomic heter-
ogeneity and non-colinearity between inbred lines. These dif-
ferences reflect mostly insertions of many transposable
elements and translocation of individual loci from one chro-
mosome to another, a process likely mediated by transposons
[27,28]. Brunner et al. [28] recently examined more than 2.8
Mb of maize syntenic chromosomal regions in two inbred
lines and found more than one-third of the loci are absent in
one inbred. Therefore, a key question is whether lines express
the same loci in specific organs and tissues even when loci are
in a new chromosomal context. Our results showed that
despite the many likely instances of genomic non-colinearity
in the 3 lines examined, they share more than 95% of their
transcripts (Figure 2e). Furthermore, quantitatively about
95% of the transcriptomes are expressed at comparable levels
between the two inbred lines W23 and A619; there is an even
Table 4
Significantly enriched GO terms in antisense transcripts
GO term Number in
test group
Number in
reference group
GO description
Antisense (732)*
50,874 23 51 Organismal physiological process
50,953 6 2 Sensory perception of light
7,601 6 2 Visual perception
5,816 8 6 Spindle pole body
5,815 12 17 Microtubule organizing center
922 12 17 Spindle pole
43,228 78 317 Non-membrane-bound organelle
43,232 78 317 Intracellular non-membrane-bound
organelle
9,767 4 0 Photosynthetic electron transport
16,028 6 3 Rhabdomere
Expressed sense-antisense pairs (120)
5,730 7 42 Nucleolus
6,575 7 44 Amino acid derivative metabolism
42,401 4 9 Biogenic amine biosynthesis
6,520 11 121 Amino acid metabolism
9,063 4 10 Amino acid catabolism
9,310 4 11 Amine catabolism
44,270 4 11 Nitrogen compound catabolism
9,072 5 23 Aromatic amino acid family
metabolism
9,308 11 135 Amine metabolism
*The number of transcripts with GO terms assigned is shown in parentheses following the group description. See legend to Table 2 for details.
R22.12 Genome Biology 2006, Volume 7, Issue 3, Article R22 Ma et al. />Genome Biology 2006, 7:R22
greater congruence between W23 and the hybrid ND101/W23
(Table 1; Figure 3b). Thus, although there is high nucleotide
polymorphism in maize genes, the 60-mer and 70-mer
probes are likely to hybridize well across lines. We conclude,
therefore, that the non-colinearity observed for maize inbred
lines seems to have little effect on the transcriptome in three
major organs - leaf, anther and pollen. A related question con-
cerns development per se: does the normal phenotype of an
organ require that nearly all of the same genes be expressed
and in a quantitatively similar manner, or can it be achieved
GO analysis of detected antisense transcriptsFigure 6
GO analysis of detected antisense transcripts. Dark squares indicate statistically significant over-representation of GO terms among 732 antisense
transcripts with assigned GO annotations (see text and Table 4 for details; a list of expressed 'spindle pole' and related genes are given in Additional data
file 7).
cellular component
cell
intracellular
organelle
cytoplasm
intracellular organelle
non-membrane-bound
organelle
intracellular
non-membrane-bound organelle
microtubule organizing
center
cytoskeleton
microtubule cytoskeleton
spindle
spindle pole
spindle pole body
is a
part of
Genome Biology 2006, Volume 7, Issue 3, Article R22 Ma et al. R22.13
comment reviews reports refereed researchdeposited research interactions information
Genome Biology 2006, 7:R22
with significant variation in the transcriptome? Because of
the very high overlap in expression among the lines at each
stage, the normal phenotypes are achieved with near-identi-
cal patterns of gene expression. The differences identified,
although relatively few in number, will be important in fur-
ther studies to relate the quantitative phenotypic differences
distinguishing each line to the expression of specific
transcripts.
It should be cautioned that transcriptome analysis using
microarrays is plagued by two universal caveats: cross
hybridization and the limitation in detection resolution. It
may be even more severe for the maize genome given the high
polymorphisms between inbred lines and the prevalence of
duplicated genes. The problem of cross hybridization can be
circumvented by careful probe design. Because the maize
genome has not been completely sequenced, the probes on
our arrays may cross hybridize with yet undefined gene tran-
scripts. Therefore, our conclusions attest mainly to the con-
gruence of overall gene expression in the three genetic
backgrounds. In considering the second problem, statistically
insignificant expression differences may be biologically sig-
nificant and cause quantitative phenotypic differences. In
recent years, efforts have been made to map gene expression
quantitative trait loci (eQTL) and link them with classic quan-
titative traits. Both cis and trans-acting eQTLs have been
identified for regulatory loci in yeast, maize, Arabidopsis,
human and mice [29-32]. Thus combining microarray and
eQTL analyses has proven to be more powerful in elucidating
genetic control of gene expression in maize and other
organisms.
A third question concerns how distinctive gene expression is
among the organs examined. If we look only at the transcripts
that are expressed in all three lines (thus with a high confi-
dence of their expression), more than one-third of the tran-
scripts for any single tissue are shared among all three tissues,
and for pollen the frequency increases to more than three-
quarters (Figure 2f). This might reflect the bias of the probes
towards highly to moderately expressed genes. Nonetheless,
compared to the work of Cho et al. [7] showing that only 7%
of transcripts were tissue-specific after hybridization to a
cDNA array platform, we find that one-third of the combined
transcripts are tissue-specific. Even more striking is the large
number of transcripts shared between leaf and anther,
including several photosynthesis genes that are expressed
highly in early anther (Figures 2f and 4). This certainly pro-
Correspondence of qRT-PCR and array hybridization resultsFigure 7
Correspondence of qRT-PCR and array hybridization results. Outliers
that were excluded from the regression analysis are indicated in red.
Primer sequences, putative gene products for the probes, and expression
values are given in Additional data file 6.
r
2
= 0.61
-6
-4
-2
0
2
4
6
-5 -4 -3 -2 -1 0 1 2 3 4 5
Microarray Log2 Ratio
qRT-PCR Log2 Ratio
Comparison of hybridization results between the 60-mer Agilent and 70-mer University of Arizona (slide A) array platformsFigure 8
Comparison of hybridization results between the 60-mer Agilent and 70-
mer University of Arizona (slide A) array platforms. Probes from the two
sets designed for the same gene/EST sequences were divided into two
groups: (a) within 30 bases of each other; and (b) more than 30 bases
apart. Data in the plots were from hybridizations using the same 1.5 mm
anther tissue samples and the same design as in Figure 1. A similar analysis
was performed for slide B of the Arizona set (data not shown).
−3 −2 −1
−2
Arizona Log2 Ratio
Agilent Log2 Ratio
3210
6420
−3 −2 −1
Arizona Log2 Ratio
3210
−2
Agilent Log2 Ratio
6420
(a)
(b)
R22.14 Genome Biology 2006, Volume 7, Issue 3, Article R22 Ma et al. />Genome Biology 2006, 7:R22
vides evidence to strengthen the model that anthers and other
floral organs are modified leaves.
A fourth question considers whether some organs show more
highly conserved patterns of gene expression in diverse lines,
which may indicate canalization of the regulatory genes and
of their targets in specifying certain plant parts. From the
transcriptome analysis, reproductive tissues, represented by
anther and pollen, express a more conserved transcriptome
than vegetative tissues, represented by leaf. Both A619 and
ND101/W23 had much more line-unique transcripts that are
also specific for leaf than for either pollen or anther (Figure
2a–d). As for expression levels, both lines also showed more
differentially expressed transcripts in the leaf than in the
anthers (Table 1). The conservation of gene expression pat-
terns during anther development and pollen function may be
important to insure reproductive success.
Because ND101/W23 is a hybrid and much more robust than
W23, one interesting question to ask is whether heterosis
(hybrid vigor) is determined by drastic transcriptome
changes compared to a parental line. Fu and Dooner [33] pro-
posed that complementation of weak, line-specific alleles
could partially contribute to hybrid vigor. However, accumu-
lating evidence suggests that dosage-dependent, non-addi-
tive gene expression may play a bigger role [34]; that is,
epistatic interactions among new combinations of alleles
result in the significant phenotypic differences between many
hybrids and their parents. For example, Song and Messing
[35] found unexpected differences in the expression of shared
and line-specific genes in reciprocal hybrids of two maize
inbred lines. Our results demonstrate that the ND101/W23
hybrid is actually very close in gene expression to W23 in
every tissue sample tested (Figure 3). It does share about the
same number of common transcripts with either W23 or A619
(Figure 2e), however, suggesting an unbiased expression of
line-specific genes. Given the lack of data from reciprocal
hybrid lines between W23 and ND101, and also from the
parental ND101 inbred, we could only speculate on this
important question in maize genetics.
Natural antisense transcripts have been implicated in the reg-
ulation of a number of biological processes, including RNA
interference, translation regulation, alternative splicing,
genomic imprinting, and RNA editing. However, very few
NATs have been experimentally analyzed, and the exact roles
of the large number of NATs in seemingly every eukaryotic
genome analyzed so far remain elusive [19-25]. Nonetheless,
even though their possible functions in the maize genome are
largely unknown, the diversity of antisense transcripts dis-
covered in this study indicates that this class of RNAs is likely
to play important roles in maize development and physiology.
This report also provided a good cross validation between two
array platforms, each having specific strengths. The Agilent
platform displayed superb hybridization images and a very
consistent low background. On the other hand, the University
of Arizona platform provided many more probes and hence
much wider coverage of the maize transcriptome.
Conclusion
Despite the phenotypic and genotypic diversity of maize,
transcriptome profiling indicates that the three lines tested
share remarkable similarities in gene expression patterns
across diverse tissue types, especially in both reproductive
tissues (anther and pollen). Our ultimate goal is to define the
genetic basis for anther morphology and the functions of cells
within this floral organ. We are using diverse male-sterile
mutants that affect the differentiation of anther cell types at
specific stages to define organ ontogeny. As plants lack a germ
line, it is of particular interest to define the mechanisms
underlying pre-germinal fate determination, which requires
that somatic cells become competent to initiate meiosis. More
than 400 male-sterile mutations are available, but they are in
diverse genetic backgrounds. Because only two or three gen-
erations of corn can be grown annually, introgression to the
status of a near-isogenic inbred line can require years. We
were therefore motivated to determine the extent of line-spe-
cific gene expression in anthers that could confound
comparisons between different male-sterile mutants and a
reference male-fertile line into which all the mutants would
eventually be introgressed. Our results show that despite a
congruent transcriptome observed across the different
genetic backgrounds, the number of differentially expressed
genes is still considerable. Therefore, any mutant to wild-type
comparisons will be carried out using sterile and fertile sib-
lings in the same family to circumvent the problem.
Materials and methods
Biological materials and tissue collection
The ND101 line was supplied by P Bedinger and the A619
derivative by W Sheridan. The W23 line carrying the bz2
mutation (lack of anthocyanin accumulation) is maintained
in the Walbot laboratory by self-pollination. These materials
were grown at Stanford University in the summer of 2003
and phenotypes were quantified (data not shown); the lines
were propagated by self-pollination of male-fertile individu-
als and by crosses of W23 as pollen parent onto the ND101
male-fertile individuals. For collection of tissues, the result-
ing lines were grown in summer 2004 at Stanford University;
leaf and pollen samples were collected in the field, transferred
to a labeled plastic tube, and immediately frozen in liquid
nitrogen. Multiple biological samples from fully expanded
juvenile leaves (leaves 8, 9, 10 in these lines) on different
plants were harvested. At flowering, tassels were bagged to
collect pollen shed from exerted anthers, which was then
sieved to remove extraneous debris. Pollen from the same
individual was pooled to make one biological sample. Multi-
ple biological samples were collected over a period of several
days for each line. Anthers must be dissected from developing
Genome Biology 2006, Volume 7, Issue 3, Article R22 Ma et al. R22.15
comment reviews reports refereed researchdeposited research interactions information
Genome Biology 2006, 7:R22
flowers; to do this, plants of approximately the correct stage
were identified in the field on the basis of tassel size, and the
entire plant was harvested by cutting near ground level with a
knife. The harvested plants of each line were kept in separate
buckets of water in an air-conditioned field laboratory. A
maize tassel contains hundreds of flowers, borne in pairs
called the upper and lower floret. Each floret contains three
anthers. Because the upper florets mature more quickly than
the lower florets, and the two floret types exhibit some tran-
scriptome differences at the 2 mm stage of development (D
Skibbe, personal communication), dissection was restricted
to upper florets. Anthers were dissected into 2.0 ml microfuge
tubes containing liquid nitrogen; the tubes were supported in
a styrofoam pad and periodically refilled with liquid nitrogen.
For 1 mm anthers, a sample of several hundred anthers was
collected for each genotype, typically from just one tassel.
Approximately 100 anthers at the 1.5 mm stage were suffi-
cient for an RNA extraction suitable for microarray and RT-
PCR analysis. Up to 15 replicate samples were obtained.
Array design and analysis - Agilent platform
Agilent Technologies microarrays are built using phosphora-
midite chemistry to synthesize 60-mers in situ on glass slides
[36]. There are 322 internal positive and 314 negative con-
trols on each maize array. Maize probes were designed from
the December 2003 maize EST assembly of MaizeGDB [11].
The 21,939 maize probes represent 21,782 unique probes,
with 157 probes duplicated. Hybridizations for duplicated
probes for the 8 experiments were highly correlated as
assessed from correlations between median signal intensities
(r
2
= 0.97 for both dyes; data not shown) and between log2
ratios of the signals (r
2
= 0.94; data not shown). Oligonucle-
otide sequences, gene identities and both raw and normalized
hybridization intensities for each probe can be downloaded
from our array data submitted to the Gene Expression Omni-
bus database [37].
To identify unique genes or transcripts, we mapped the probe
set to the TIGR Maize Gene Index (release 15.0, September
2004) [14]. The TIGR dataset provides annotations for each
Tentative Contig assembly based on protein similarity search
results and EST sequence orientation information (for exam-
ple, the presence of a poly-A tail). The assembly will be anno-
tated as 'coding strand' if there is strong supporting evidence.
By the stringent criterion of at most 2 mismatches over an
alignment length of 60 nucleotides (the full probe length), the
probes were found to represent approximately 21,132 unique
transcripts (either sense or antisense; see below).
Identification of antisense probes
We used a combination of two independent approaches to
identify antisense probes. First to avoid assembly errors, the
probes were mapped back to their original EST sequences
(downloaded from NCBI), and the corresponding EST
sequences (with an average length of 555 base-pairs) were
subjected to a BLASTX similarity search against a plant pro-
tein database extracted from UniProt (the December 2004
dump). The following criteria were used: first, the top hit
must be from peptide translated from the reverse strand of
the EST and the BLAST score >80; and second, if there is also
a hit(s) from the sense strand, its BLAST score must be below
50 and the top score must be over 100 (for a reverse hit). The
BLASTX results were cross-validated by mapping the probes
to the TIGR Maize Gene Index dataset, which provides addi-
tional information on the orientation of the TC sequences. A
probe is annotated as 'antisense' if both the BLASTX results
and TIGR Maize Gene Index evidence showed it to hybridize
to the reverse strand of a coding sequence. A total of 5,075
probes were identified as antisense probes. To further con-
firm this probe set, we randomly picked 100 probes and
manually verified that they were antisense probes given avail-
able information on the maize transcriptome.
RNA extraction, target cRNA preparation and array hybridization
Total RNA was extracted from 30 to 60 mg of frozen tissues
at each developmental stage using the RNeasy Plant Kit (Qia-
gen, Valencia, CA, USA) and subjected to DNase I (Invitro-
gen, Carlsbad, CA, USA) or Turbo DNase treatment (Ambion,
Austin, TX, USA) and a second round of RNeasy column puri-
fication (Qiagen). The yield and RNA purity were determined
spectrophotometrically with a SpectraMax 250 plate spectro-
photometer (Molecular Devices, Sunnyvale, CA, USA) and
verified by agarose gel analysis. Target cRNA was prepared
and labeled with either Cy-3 or Cy-5 dye (PerkinElmer, Bos-
ton, MA, USA) from 0.5 µg of total RNA using an Agilent Low
RNA Input Fluorescent Linear Amplification Kit. Array
hybridizations were carried out according to the manufac-
turer's instructions. Specifically, each array was hybridized
with two samples, each of 0.75 µg labeled target cRNA, for 17
hours at 60°C. Data were acquired with an Agilent G2565BA
scanner.
Microarray data analysis
Microarray experiments and data were managed and ana-
lyzed using a customized implementation of the BASE system
[38]. The reliability and reproducibility of analyses was
ensured by the use of triplicates in each experiment, the nor-
malization of all 24 arrays to the median probe intensity level
with background subtracted, and the use of well accepted and
freely available software packages. The slide images were
processed with FeatureExtraction v. 0.75 (Agilent). After fil-
tering out saturated spots flagged by FeatureExtraction, we
took an iterative approach to estimate non-specific hybridiza-
tions. For each of the three slides in a given experiment, we
first calculated thresholds for background hybridizations
with the 314 internal negative controls, as Average (median
intensities - background) of negative controls] + 2 × standard
deviation for both dyes. We then added to the 'non-hyb' (non-
hybridizing) set only probes that showed below-threshold sig-
nals in at least five out of the six median intensities for the
triplicates. Then iteratively, new thresholds for each slide
were calculated and new non-hybridizing probes identified
R22.16 Genome Biology 2006, Volume 7, Issue 3, Article R22 Ma et al. />Genome Biology 2006, 7:R22
until there were none left. Probes that showed above-thresh-
old signals in at least five out of the six median signals were
labeled as the 'all-hyb' set. Observing a strong dye bias, we
subjected the union of the 'all-hyb' sets for the 8 experiments
(7,900 probes in total) to normalization for each slide. We
chose the rank invariant method [39] for selecting non-differ-
entially expressed genes and subsequently a loess fitness
method for non-linear normalization using the identified
invariant genes. After normalization, scaling procedures were
applied to bring the variances of filtered and normalized
expression values among the triplicates to the same variation
level. Outliers were detected by a Grubb's test (p = 0.01) and
flagged. The procedures were carried out using a MadScan
BASE plug-in [40].
To estimate the number of transcripts for each tissue sample,
we furthermore identified probes that showed below-thresh-
old hybridizations for one dye but above-threshold hybridiza-
tions for the other. We required that all 3 dye intensities for
the hybridizing samples to be over the 90 percentile of the
median intensity of the 'all-hyb' set for it to be called 'present'.
In the case of W23, which was used as the reference, at least
five of the six dye intensities for a probe (from six hybridiza-
tions) must be larger than thresholds for it to be predicted as
'present' in W23 but 'absent' from the other two lines.
To assess differential expression, the Rank Products [41]
method was used, which is a non-parametric testing against a
random simulated background. It proves to be especially
robust for our dataset given the presence of a large number of
non-hybridizing probes and the single copy representation
for most of the probes. To be more conservative, a slight mod-
ification to the algorithm was made which required all three
log2 ratios to have the same sign ('+' for up-regulation and '-'
for down-regulation) in order for a transcript to be picked as
differentially expressed. The significance level was set to give
a false discovery rate (FDR) of 5%. Hierarchical clustering of
expressed genes was performed with EPCLUST [42], with
correlation measure based distance and average linkage clus-
tering methods. We used both normalized log2 ratios and
log2 values of normalized absolute median intensities for
clustering. When using absolute intensities, first we applied a
linear regression to one test sample (either ND101/W23 or
A619) based on normalized intensities of the common W23
reference tissue. Very good correlations were found between
the W23 references for each of the four sets of experiments
(all with r
2
> 0.90, data not shown). For W23 intensities, the
mean was taken after scaling. Finally the values log
2
(scaled
absolute intensity/median of the all-hyb set in the given tis-
sue) were fed to the clusters.
Array design and analysis - University of Arizona
platform
To provide an additional level of confirmation and compari-
son between in situ synthesis and spotted arrays, six addi-
tional spotted arrays were utilized as part of a beta-testing
study for the Maize Oligonucleotide Array Project (MOAP)
[43]. This platform has approximately 58,000 spotted 70-
mer oligonucleotide probes printed on two slides for each
array. These were used as technical replicates for the experi-
mental comparisons of the two anther stages between the
W23 and A619 background already completed with the Agi-
lent arrays. To minimize differences that might occur from
separate cRNA preparations and to utilize valuable labeled
sample, the protocol as recommended by MOAP was altered
in the following ways. DNA probe immobilization was
completed by placing each array DNA-side down over a 42°C
water bath for 5 to 10 seconds. Slides were then immediately
placed DNA-side up on a 70 to 80°C heat block and snap-
dried for 3 to 10 seconds. DNA probes were then UV cross-
linked to the slide at 65 mJ for 90 seconds using a UV Strata-
linker 1800 (Stratagene, LA Jolle, CA, USA). Slides were incu-
bated for 2 minutes in a 1% SDS bath, washed in a 95°C water
bath for 2 minutes with gentle shaking, and finally placed in a
water bath at room temperature to rinse briefly. Slides were
centrifuged at 500 rpm for 5 minutes to dry, and stored in the
dark at room temperature with desiccant until used. Hybrid-
ization methods were adopted from Agilent's protocol for
processing oligoarrays except that 750 ng of each labeled
cRNA sample was combined and hybridized to the slides at
55°C for 15 hours. Slide washing was done according to the
MOAP protocol [43] and scanned in an Agilent G2565BA
scanner.
The Arizona probe sequences were blasted against the set of
EST contigs and singletons used to generate the 60-mers for
the Agilent microarray. For each Arizona 70-mer, the top hit
in the same orientation was selected among those with a min-
imum e-value of 1E-8, a minimum alignment of 68 bases, a
maximum of 3 mismatches, and no gaps. There were 3,568
probe matches for slide A and 4,092 for slide B. The distance
between each pair of probes was determined by comparing
each Arizona probe's blast start position to the start position
of the matching Agilent probe within the source EST contig or
singleton. Scatter plots were generated using the basic plot
function in R.
Gene Ontology analysis
Because currently no maize GO project exists, we used the
Blast2Go program [16] for our GO data mining. Blast2Go
started with a Blastx similarity search (with e-value of 1E-10)
against the nr NCBI protein database. Statistically significant
matches were then assigned to each query, and GO annota-
tions were mapped from known associations. To reduce
errors we used GO annotations from the TIGR Maize Gene
Index dataset if provided, which covered more than 2,000
hybridizing transcripts on the array. To assess significant
over-representation of the GO terms we used Gossip [17],
which takes an heuristic approach to control the family-wise
error rate (FWER) as the multiple testing correction and out-
puts three p values: one for a single test, one adjusted p value
to control the FWER, and one adjusted p value to control the
Genome Biology 2006, Volume 7, Issue 3, Article R22 Ma et al. R22.17
comment reviews reports refereed researchdeposited research interactions information
Genome Biology 2006, 7:R22
FDR. For out tests, we required the p value for the single test
to be less than 0.005 and the other two adjusted p values to
be less than 0.1.
Quantitative real-time PCR verification
DNase-treated RNA was reverse transcribed with poly-dT
primer using a SuperScript III cDNA synthesis kit (Invitro-
gen), and stored at -20°C. Several reactions were pooled to
avoid reaction-related variations. Primers were designed
using Primer3 [44] and synthesized by Operon (Huntsville,
AL, USA). Primer sequences are provided in Additional data
file 6. All primers were tested to ensure amplification of single
discrete bands with no primer-dimers. Melting curves were
performed on the product to test if only a single product was
amplified. Samples were also evaluated on a 2% agarose gel to
confirm that a single product of the correct size was gener-
ated. The PCR products were purified from the gel and
sequenced to verify their identities in some cases. Real-time
PCR was carried out in a DNA Engine OPTICON2 (MJ
Research, part of Bio-Rad, Hercules, CA, USA). Each reaction
contained 1× buffer (with 2 mM MgCl
2
), 200 µM mixed
dNTPs, 0.4 µU DyNAzyme II (MJ Research), 0.5× SYBR
Green I (Molecular Probes, part of Invitrogen, Carlsbad, CA,
USA), 0.25 µM of each primer, and about 12.5 ng cDNA in a
final volume of 20 µl. Three replicates were performed for
each sample plus template-free samples as negative controls.
Cycling parameters consisted of an initial denaturation step
at 94°C for 3 minutes, followed by 35 amplification cycles at
94°C for 15 seconds, 58°C for 15 seconds, and 72°C for 25 sec-
onds. Fluorescence measurements were taken at the end of
the annealing phase at 78°C, 82°C, and 86°C. The qRT-PCR
data were analyzed using the 'mid-point' method, which cal-
culates amplification efficiencies for each sample from its
amplification profile [45]. Two internal standards were used
for each tissue stage (Additional data file 6) and results aver-
aged over all biological replications to reduce both systematic
and biological variances.
Additional data files
The following additional data are available with the online
version of this paper. Additional data file 1 is a spreadsheet
listing the putative stage-specific transcripts expressed in 1
mm anthers. Additional data file 2 is a spreadsheet listing the
putative stage-specific transcripts expressed in 1.5 mm
anthers. Additional data file 3 is a spreadsheet listing the
putative stage-specific transcripts expressed in mature pol-
len. Additional data file 4 is a spreadsheet listing the putative
stage-specific transcripts expressed in juvenile leaves. Addi-
tional data file 5 is a spreadsheet listing the transcripts with
both sense and antisense probes hybridized. Additional data
file 6 is a spreadsheet listing the primer sequences, putative
gene product, and expression values for the qRT-PCR valida-
tion experiments. Additional data file 7 is a spreadsheet list-
ing the transcripts potentially involved in cell cycle regulation
and processes.
Additional File 1Putative stage-specific transcripts expressed in 1 mm anthersPutative stage-specific transcripts expressed in 1 mm anthers.Click here for fileAdditional File 2Putative stage-specific transcripts expressed in 1.5 mm anthersPutative stage-specific transcripts expressed in 1.5 mm anthers.Click here for fileAdditional File 3Putative stage-specific transcripts expressed in mature pollenPutative stage-specific transcripts expressed in mature pollen.Click here for fileAdditional File 4Putative stage-specific transcripts expressed in juvenile leavesPutative stage-specific transcripts expressed in juvenile leaves.Click here for fileAdditional File 5Transcripts with both sense and antisense probes hybridizedTranscripts with both sense and antisense probes hybridized.Click here for fileAdditional File 6Primer sequences, putative gene product, and expression values for the qRT-PCR validation experimentsPrimer sequences, putative gene product, and expression values for the qRT-PCR validation experiments.Click here for fileAdditional File 7Transcripts potentially involved in cell cycle regulation and processesTranscripts potentially involved in cell cycle regulation and processes.Click here for file
Acknowledgements
We are grateful to David Duncan for help with collecting samples. We also
thank three anonymous reviewers for their valuable suggestions. This work
was supported by the National Science Foundation (98-72657). JM was sup-
ported by a National Library of Medicine Genome Training Grant awarded
to the Stanford Biomedical Informatics Program.
References
1. Gerdes JT, Tracy WF: Pedigree diversity within the Lancaster
Surecrop heterotic group of maize. Crop Sci 1994, 33:334-337.
2. Gerdes JT, Behr CF, Coors JG, Tracy WF: Compilation of North Amer-
ican Maize Breeding Germplasm Madison WI: Crop Science Society of
America; 1993.
3. Poethig RS: Heterochronic mutations affecting shoot develop-
ment in maize. Genetics 1988, 119:959-973.
4. Gaut BS: Patterns of chromosomal duplication in maize and
their implications for comparative maps of the grasses.
Genome Res 2001, 11:55-66.
5. Neuffer MG, Coe EH, Wessler SR: Mutants of Maize Plainview, NY:
Cold Spring Harbor Laboratory Press; 1997.
6. MaizeGDB [ />7. Cho Y, Fernandes J, Kim SH, Walbot V: Gene-expression profile
comparisons distinguish seven organs of maize. Genome Biol
2002, 3:research0045.
8. Kiesselbach TA: The structure and reproduction of corn.
Nebraska Agric Exp Stn Res Bull 1949, 161:1-96.
9. Chaubal R, Zanella C, Trimnell MR, Fox TW, Albertsen MC, Bedinger
P: Two male-sterile mutants of Zea Mays (Poaceae) with an
extra cell division in the anther wall. Am J Bot 2000,
87:1193-1201.
10. Casati P, Walbot V: Gene expression profiling in response to
ultraviolet radiation in maize genotypes with varying flavo-
noid content. Plant Physiol 2003, 132:1739-1754.
11. PlantGDB [ />12. Fu Y, Emrich SJ, Guo L, Wen TJ, Ashlock DA, Aluru S, Schnable PS:
Quality assessment of maize assembled genomic islands
(MAGIs) and large-scale experimental verification of pre-
dicted genes. Proc Natl Acad Sci USA 2005, 102:12282-12287.
13. Stuber CW: Mapping and manipulating quantitative traits in
maize. Trends Genet 1995, 11:477-481.
14. TIGR Maize Gene Index [ />T_index.cgi?species=maize]
15. Cigan AM, Unger E, Xu R, Kendall T, Fox TW: Phenotypic comple-
mentation of ms45 maize requires tapetal expression of
MS45. Sex Plant Reprod 2001, 14:135-142.
16. Conesa A, Gotz S, Garcia-Gomez JM, Terol J, Talon M, Robles M:
Blast2GO: a universal tool for annotation and visualization in
functional genomics research. Bioinformatics 2005,
21:3674-3676.
17. Gossip []
18. Wakeley PR, Rogers HJ, Rozycka M, Greenland AJ, Hussey PJ: A
maize pectin methylesterase-like gene, ZmC5, specifically
expressed in pollen. Plant Mol Biol 1998, 37:187-192.
19. Merino E, Balbas P, Puente JL, Bolivar F: Antisense overlapping
open reading frames in genes from bacteria to humans.
Nucleic Acids Res 1994, 22:1903-1908.
20. Yelin R, Dahary D, Sorek R, Levanon EY, Goldstein O, Shoshan A,
Diber A, Biton S, Tamir Y, Khosravi R, et al.: Widespread occur-
rence of antisense transcription in the human genome. Nat
Biotechnol 2003, 21:379-386.
21. Kiyosawa H, Yamanaka I, Osato N, Kondo S, Hayashizaki Y, RIKEN
GER Group., GSL Members: Antisense transcripts with
FANTOM2 clone set and their implications for gene
regulation. Genome Res 2003, 13:1324-1334.
22. Dahary D, Elroy-Stein O, Sorek R: Naturally occurring antisense:
transcriptional leakage or real overlap? Genome Res 2005,
15:364-368.
23. Wang XJ, Gaasterland T, Chua NH: Genome-wide prediction and
identification of cis-natural antisense transcripts in Arabidop-
sis thaliana. Genome Biol 2005, 6:R30.
24. Chen J, Sun M, Hurst LD, Carmichael GG, Rowley JD: Genome-
wide analysis of coordinate expression and evolution of
R22.18 Genome Biology 2006, Volume 7, Issue 3, Article R22 Ma et al. />Genome Biology 2006, 7:R22
human cis-encoded sense-antisense transcripts. Trends Genet
2005, 21:326-329.
25. Lavorgna G, Dahary D, Lehner B, Sorek R, Sanderson CM, Casari G:
In search of antisense. Trends Biochem Sci 2004, 29:88-94.
26. Casati P, Walbot V: Rapid transcriptome responses of maize
(Zea mays) to UV-B in irradiated and shielded tissues.
Genome Biol 2004, 5:R16.
27. Morgante M, Brunner S, Pea G, Fengler K, Zuccolo A, Rafalski A:
Gene duplication and exon shuffling by helitron-like trans-
posons generate intraspecies diversity in maize. Nat Genet
2005, 37:997-1002.
28. Brunner S, Fengler K, Morgante M, Tingey S, Rafalski A: Evolution of
DNA Sequence Nonhomologies among Maize Inbreds. Plant
Cell 2005, 17:343-360.
29. Brem RB, Yvert G, Clinton R, Kruglyak L: Genetic dissection of
transcriptional regulation in budding yeast. Science 2002,
296:752-755.
30. Schadt EE, Monks SA, Drake TA, Lusis AJ, Che N, Colinayo V, Ruff
TG, Milligan SB, Lamb JR, Cavet G, et al.: Genetics of gene expres-
sion surveyed in maize, mouse and man. Nature 2003,
422:297-302.
31. Hubner N, Wallace CA, Zimdahl H, Petretto E, Schulz H, Maciver F,
Mueller M, Hummel O, Monti J, Zidek V, et al.: Integrated tran-
scriptional profiling and linkage analysis for identification of
genes underlying disease. Nat Genet 2005, 37:243-253.
32. Decook R, Lall S, Nettleton D, Howell SH: Genetic regulation of
gene expression during shoot development in Arabidopsis.
Genetics 2005. doi: 10.1534/genetics.105.042275
33. Fu H, Dooner HK: Intraspecific violation of genetic colinearity
and its implications in maize. Proc Natl Acad Sci USA 2002,
99:9573-9578.
34. Birchler JA, Riddle NC, Auger DL, Veitia RA: Dosage balance in
gene regulation: biological implications. Trends Genet 2005,
21:219-226.
35. Song R, Messing J: Gene expression of a gene family in maize
based on noncollinear haplotypes. Proc Natl Acad Sci USA 2003,
100:9055-9060.
36. Hughes TR, Mao M, Jones AR, Burchard J, Marton MJ, Shannon KW,
Lefkowitz SM, Ziman M, Schelter JM, Meyer MR, et al.: Expression
profiling using microarrays fabricated by an ink-jet oligonu-
cleotide synthesizer. Nat Biotechnol 2001, 19:342-347.
37. Gene Expression Omnibus [ />projects/geo/query/acc.cgi?acc=GSE3640]
38. Saal LH, Troein C, Vallon-Christersson J, Gruvberger S, Borg A,
Peterson C: BioArray Software Environment (BASE): a plat-
form for comprehensive management and analysis of
microarray data. Genome Biol 2002, 3:SOFTWARE0003.
39. Tseng GC, Oh MK, Rohlin L, Liao JC, Wong WH: Issues in cDNA
microarray analysis: quality filtering, channel normalization,
models of variations and assessment of gene effects. Nucleic
Acids Res 2001, 29:2549-2557.
40. Le Meur N, Lamirault G, Bihouee A, Steenman M, Bedrine-Ferran H,
Teusan R, Ramstein G, Leger JJ: A dynamic, web-accessible
resource to process raw microarray scan data into consoli-
dated gene expression values: importance of replication.
Nucleic Acids Res 2004, 32:5349-5358.
41. Breitling R, Armengaud P, Amtmann A, Herzyk P: Rank products: a
simple, yet powerful, new method to detect differentially
regulated genes in replicated microarray experiments. FEBS
Lett 2004, 573:83-92.
42. EPCLUST [ />43. MOAP [ />44. Primer3 [ />45. Peirson SN, Butler JN, Foster RG: Experimental validation of
novel and conventional approaches to quantitative real-time
PCR data analysis. Nucleic Acids Res 2003, 31:e73.