Báo cáo y học: "Systems analysis of circadian time-dependent neuronal epidermal growth factor receptor signaling" pdf
Bạn đang xem bản rút gọn của tài liệu. Xem và tải ngay bản đầy đủ của tài liệu tại đây (751.08 KB, 15 trang )
Genome Biology 2006, 7:R48
comment reviews reports deposited research refereed research interactions information
Open Access
2006Zaket al.Volume 7, Issue 6, Article R48
Research
Systems analysis of circadian time-dependent neuronal epidermal
growth factor receptor signaling
Daniel E Zak
¤
*†
, Haiping Hao
¤
*
, Rajanikanth Vadigepalli
*
,
Gregory M Miller
*†
, Babatunde A Ogunnaike
†
and James S Schwaber
*
Addresses:
*
Daniel Baugh Institute for Functional Genomics and Computational Biology, Department of Pathology, Thomas Jefferson
University, Locust St, Philadelphia, PA, USA 19107.
†
Department of Chemical Engineering, University of Delaware, Academy St, Newark, DE,
USA 19716.
¤ These authors contributed equally to this work.
Correspondence: James S Schwaber. Email:
© 2006 Zak et al; licensee BioMed Central Ltd.
This is an open access article distributed under the terms of the Creative Commons Attribution License ( which
permits unrestricted use, distribution, and reproduction in any medium, provided the original work is properly cited.
Circadian epidermal growth factor signaling<p>A systems level analysis of circadian time-dependent signaling via the epidermal growth factor receptor in the suprachiasmatic nucleus suggests several transcription factors that mediate the transcriptional response to epidermal growth factor receptor signaling.</p>
Abstract
Background: Identifying the gene regulatory networks governing physiological signal integration
remains an important challenge in circadian biology. Epidermal growth factor receptor (EGFR) has
been implicated in circadian function and is expressed in the suprachiasmatic nuclei (SCN), the core
circadian pacemaker. The transcription networks downstream of EGFR in the SCN are unknown
but, by analogy to other SCN inputs, we expect the response to EGFR activation to depend on
circadian timing.
Results: We have undertaken a systems-level analysis of EGFR circadian time-dependent signaling
in the SCN. We collected gene-expression profiles to study how the SCN response to EGFR
activation depends on circadian timing. Mixed-model analysis of variance (ANOVA) was employed
to identify genes with circadian time-dependent EGFR regulation. The expression data were
integrated with transcription-factor binding predictions through gene group enrichment analyses
to generate robust hypotheses about transcription-factors responsible for the circadian phase-
dependent EGFR responses.
Conclusion: The analysis results suggest that the transcriptional response to EGFR signaling in the
SCN may be partly mediated by established transcription-factors regulated via EGFR transription-
factors (AP1, Ets1, C/EBP), transcription-factors involved in circadian clock entrainment (CREB),
and by core clock transcription-factors (Rorα). Quantitative real-time PCR measurements of
several transcription-factor expression levels support a model in which circadian time-dependent
EGFR responses are partly achieved by circadian regulation of upstream signaling components. Our
study suggests an important role for EGFR signaling in SCN function and provides an example for
gaining physiological insights through systems-level analysis.
Published: 19 June 2006
Genome Biology 2006, 7:R48 (doi:10.1186/gb-2006-7-6-r48)
Received: 11 January 2006
Revised: 5 April 2006
Accepted: 4 May 2006
The electronic version of this article is the complete one and can be
found online at />R48.2 Genome Biology 2006, Volume 7, Issue 6, Article R48 Zak et al. />Genome Biology 2006, 7:R48
Background
The present work makes a systems level analysis of context-
dependent signaling by the epidermal growth factor receptor
(EGFR) in the suprachiasmatic nuclei (SCN). Circadian
rhythms are driven by gene regulatory feedback networks [1],
and in mammals the SCN comprise the master circadian clock
[2]. SCN circadian rhythms are synchronized across SCN
neurons [3], with the environment, and with the internal
physiological state of the organism [4]. Importantly, the
effects of phase modulating extracellular inputs to the SCN
are regulated by the circadian clock itself and are thus 'gated'
[5] or circadian time dependent. Biochemical correlates of
light (for example, glutamate), for instance, have little effect
during the circadian day, but cause phase delays in the early
night, and phase advances in the late night [5]. The mecha-
nisms behind circadian time dependent signaling in the SCN
are largely unknown, but mechanisms that in other systems
give rise to signaling specificity - cell-type specific responses
to the activation of common signaling pathways (reviewed in
[6,7]) - may be partly responsible. Phases of differential SCN
signaling responsiveness cycle with circadian time, however,
and thus components responsible for circadian modulation of
signaling responses must also cycle with circadian time, ren-
dering the SCN a particularly interesting and well-contained
system for studying context-dependent signaling.
Recent studies suggest important roles for EGFR signaling in
the regulation of circadian rhythms by the SCN. EGFR and
EGFR ligands are expressed throughout the central nervous
system and are involved in diverse developmental and home-
ostatic processes [8]. SCN expression of EGFR [9-11] and
transforming growth factor alpha (TGF-alpha; an EGFR lig-
and) [9,10,12,13] have been reported. EGFR signaling has
been implicated in the circadian regulation of locomotor
activity [13] and grooming, exploring, and feeding behaviors
[14]. EGFR activation has been found to induce Erk phospho-
rylation in the SCN [15]. Elevated TGF-alpha serum levels
have been observed in cancer patients with dampened circa-
dian activity rhythms [16]. Furthermore, roles have been sug-
gested for EGFR signaling in clock regulation via retinal SCN
inputs [13] and the intercellular synchronization of SCN
rhythms [10]. Lastly, a microarray study of SCN circadian
gene expression revealed rhythmic EGFR substrate expres-
sion [17]. The signaling pathways downstream of EGFR are
uncharacterized in the SCN, but by analogy to other well-
characterized SCN inputs [5], and studies in other systems of
context-dependent EGFR signaling [18], we hypothesize that
the EGFR signaling in the SCN is circadian time dependent.
In this work, a preliminary characterization of the transcrip-
tional pathways underlying circadian time dependent EGFR
signaling in the SCN is made. Factorial-designed microarray
experiments [19] are combined with mixed-model analysis of
variance (ANOVA) [20], enrichment analyses, and promoter
bioinformatic techniques [21] to generate hypotheses about
the transcription factors (TFs) regulating genes with circa-
dian time dependent expression responses to EGFR activa-
tion. This work is consistent with others in which microarray
analysis was combined with promoter analysis to generate
hypotheses about the TFs regulating circadian gene expres-
sion [22], and expression responses to specific signaling path-
ways [23,24]. We extended the methods of these previous
works by performing thorough microarray and promoter
analyses and by seeking results that were both statistically
significant and robust to variations in analysis parameters,
following recommendations in [25]. We found strong support
for circadian time dependent EGFR responses in the SCN,
and quantitative real-time (qRT)-PCR measurements of a
subset of implicated TFs revealed that circadian time depend-
ent EGFR responses may be partly due to circadian modula-
tion of upstream signaling pathways.
Results and discussion
The objectives of the current study were to identify genes
responsive to EGFR signaling in the SCN, to determine
whether these responses are circadian time dependent, to
identify the pathways and functions modulated by EGFR sig-
naling in the SCN, and to make hypotheses about the regula-
tors responsible for the EGFR responses. To these ends, a 2
2
factorial designed microarray experiment was performed in
which the SCN responses to EGF treatment during the 'day' (8
hours after lights on) and 'night' (2 hours after lights off) were
compared. Genes with expression levels regulated by EGFR
signaling in a circadian time dependent manner were identi-
fied using mixed-model ANOVA. To generate hypotheses
about the pathways and cell functions modulated by EGFR
signaling in the SCN, we tested for enrichments of previously
established circadian gene expression [17,22] and Gene
Ontology (GO) terms in groups of EGF responsive genes. To
generate hypotheses about the regulators underlying the cir-
cadian time dependent EGFR responses in the SCN, we tested
for enrichment of TF binding predictions in the promoters of
EGF responsive gene groups. Given that TF binding site data-
bases are currently incomplete, with the number of known or
predicted TFs greatly exceeding the number of well-charac-
terized TF binding sites, and given that the quality and specif-
icity of binding sites differs across databases and data sets, we
sought consistent hypotheses by utilizing three complemen-
tary sources of TF binding predictions: the TRANSFAC
®
database [26], predictions based on phylogenetic conserva-
tion [27], and genome-wide location analysis data [28,29]. By
seeking consistent results from complementary data sources,
we feel we overcome some of the limitations in relying on TF
binding site predictions to infer regulatory networks, even
though identifying the specific TFs acting at implicated bind-
ing sites remains an important challenge.
Our experiments and analyses provide evidence for circa-
dian-time dependent EGFR responses that are relevant to cir-
cadian clock function. Additionally, we identified several TFs
Genome Biology 2006, Volume 7, Issue 6, Article R48 Zak et al. R48.3
comment reviews reports refereed researchdeposited research interactions information
Genome Biology 2006, 7:R48
known to be downstream of EGFR signaling and generated
hypotheses about their roles in regulating the responses.
Topology of EGFR-responsive gene expression
At a false discovery rate (FDR) of 2%, approximately 10% of
the genes on our microarrays were EGF responsive. Heat-
maps showing the diversity of observed expression responses
to EGFR activation are given in Figure 1. Interestingly, the
majority (approximately 70%) of the EGF-responsive genes
had EGF responses that depended in some way on the circa-
dian time at which the EGF treatment was made. These were
identified in the mixed model ANOVA as those with statisti-
cally significant EGF:circadian time (EGF:CT) interaction
effects on gene expression levels (see Materials and methods).
While the genes on our microarrays are not necessarily repre-
sentative of the entire genome, these results suggest that: (1)
the SCN is transcriptionally responsive to EGFR activation,
and (2) the pathways by which EGFR activation leads to gene
regulation are modulated by circadian time. Focusing specif-
ically on genes most strongly regulated by EGFR activation
revealed several involved in EGFR responses in other sys-
tems. Subsets of these are shown in Additional data file 1 and
are discussed in Additional file 6. P values for EGF effects and
EGF:CT interactions for all genes meeting quality control cri-
teria are given in Additional data file 3.
EGFR modulation of circadian cycling genes in the SCN
To determine whether the EGF responsive genes we identi-
fied have a role in core clock function, we compared them to
previously established circadian cycling genes in the SCN
[17,22]. Specifically, we tested whether circadian-regulated
genes were over-represented in our EGF-responsive gene
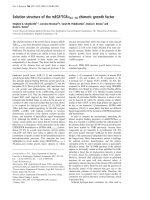
EGFR activation induces circadian time (CT) dependent and CT independent transcriptional programs in the SCNFigure 1
EGFR activation induces circadian time (CT) dependent and CT independent transcriptional programs in the SCN. Results for genes with expression
changes detected at a False Discovery Rate (FDR) <2% (see Materials and methods). (a) Genes with expression levels modulated by CT but not EGF
treatment. (b) Genes with expression responses to EGFR activation that were not CT-dependent. (c) Genes with expression levels modulated by EGFR
activation at nighttime only. (d) Genes with expression levels modulated by EGFR activation during daytime only. (e) Genes up-regulated by EGFR
activation during the circadian day and repressed at night. (f) Genes down-regulated by EGFR activation during the circadian day and induced at night. Blue
and red shades represent negative and positive scaled log
2
-expression levels or expression differences, respectively. C.1 and C.2 represent daytime control
rats whereas C.N1 and C.N2 represent nighttime control rats. E.1 and E.2 represent EGF-treated (20 nM, 1 hour) daytime rats while E.N1 and E.N2
represent EGF-treated nighttime rats. Log
2
-expression levels in these cases were scaled for each gene by first subtracting random components for each
rat, and then subtracting the mean log
2
-expression level over all conditions. To facilitate comparisons between genes, these mean-zeroed expression levels
were divided by their maximum absolute value. dE.1 and dE.2 represent scaled EGF-induced log-expression differences in daytime rats while dE.N1 and
dE.N2 represent scaled EGF-induced log-expression differences in nighttime rats. To facilitate comparisons between genes, these expression differences
were divided by their maximum absolute value. Genes are represented by gene symbols, except in cases where annotation was not available and clone IDs
are given instead. Images were created using the free Treeview program [62]. Additional data file 1 displays the relativeanimal-animal variability in the
expression responses for a selected subset of genes.
(a) CT response only
(b) CT-independent EGF response
(c) EGF response, night only (d) EGF response, day only
(e) Day induction, night repression
(f) Day repression, night induction
R48.4 Genome Biology 2006, Volume 7, Issue 6, Article R48 Zak et al. />Genome Biology 2006, 7:R48
Table 1
EGF responsive genes in the SCN are involved in diverse cellular processes and potentially regulated by diverse transcription factors
Gene group Attribute
class
Attribute p
ENRICH
p
ENRICH
(FDR)
No. of genes G
FRAC
A
FRAC
ENRICH p
M
(LOCAL)
p
M
(GLOBAL)
Any EGF
effect
GO Cell differentiation 3.E-03 0.08 7 0.1 0.3 3.4 0.02 0.06
Protein kinase activity 0.01 0.10 10 0.2 0.2 2.4 0.03 0.08
Protein serine/
threonine kinase
activity
2.E-03 0.08 10 0.2 0.2 2.8 0.01 0.06
PAINT ATF3 0.02 0.16 5 0.1 0.3 2.9 0.02 0.52
CREB 4.E-03 0.06 9 0.1 0.3 2.7 4.E-03 0.10
CREBATF 3.E-03 0.06 5 0.1 0.5 4.3 0.04 0.59
CRE-BP1:c-Jun 0.01 0.14 7 0.1 0.3 2.6 0.02 0.31
CONS V$AP1_2 0.02 0.90 71 0.8 0.1 1.1 0.03 0.11
V$AP1_C 1.E-03 0.16 53 0.6 0.2 1.4 2.E-03 0.06
V$CEBP_Q2 0.01 0.54 32 0.4 0.2 1.4 0.01 0.03
V$CEBP_Q2_01 0.03 0.90 61 0.7 0.1 1.2 0.05 0.06
V$CEBP_Q3 2.E-03 0.19 69 0.8 0.1 1.2 2.E-03 0.02
V$CEBPGAMMA_Q6 0.03 0.90 26 0.3 0.2 1.4 0.05 0.07
V$OCT1_07 0.02 0.90 10 0.1 0.2 2.0 0.05 0.23
V$RORA1_01 7.E-05 0.02 21 0.2 0.3 2.3 3.E-04 2.E-03
V$RORA2_01 0.01 0.54 6 0.1 0.4 3.1 0.06 0.19
Circ. SCN circadian genes
[17]
0.04 - 16 0.1 0.4 1.5 0.02 -
EGF:CT GO Cell differentiation 1.E-03 0.06 6 0.1 0.2 4.5 0.01 0.05
interaction PAINT c-Ets-1/68 0.07 0.36 8 0.1 0.2 1.8 0.06 0.13
CREB 0.01 0.10 7 0.1 0.2 2.7 0.01 0.11
CREBATF 8.E-04 0.02 5 0.1 0.5 5.7 0.02 0.60
CRE-BP1:c-Jun 0.01 0.10 6 0.1 0.3 3.0 0.01 0.23
E2F 0.03 0.20 5 0.1 0.2 2.7 0.02 0.28
CONS V$AP1_C 2.E-04 0.03 41 0.7 0.1 1.5 2.E-03 0.05
V$CEBP_Q2 2.E-03 0.11 26 0.4 0.1 1.7 0.01 0.07
V$CEBP_Q3 5.E-03 0.26 49 0.8 0.1 1.2 0.01 0.09
V$CETS1P54_01 0.03 0.71 46 0.7 0.1 1.2 0.05 0.13
V$CREBP1_Q2 0.03 0.71 8 0.1 0.2 2.1 0.04 0.36
V$ER_Q6_02 0.02 0.69 30 0.5 0.1 1.4 0.01 0.10
V$HFH4_01 0.01 0.31 8 0.1 0.2 2.7 0.01 0.08
V$RORA1_01 2.E-04 0.03 16 0.3 0.2 2.5 1.E-03 4.E-03
V$RORA2_01 1.E-03 0.11 6 0.1 0.4 4.4 0.03 0.14
ChIP HNF1-alpha 0.04 0.11 6 0.1 0.2 2.3 0.15 0.25
Circ. SCN circadian genes [17] 0.05 - 13 0.1 0.3 1.6 0.07 -
EGF without
interaction
GO Protein binding 0.02 0.06 7 0.3 0.1 2.5 0.01 0.06
Protein kinase activity 2.E-03 0.02 6 0.3 0.1 4.2 0.03 0.37
Protein serine/threonine
kinase activity
1.E-03 0.02 6 0.3 0.1 4.8 0.02 0.32
Transferase activity 2.E-03 0.02 9 0.4 0.1 2.8 0.04 0.22
CONS V$CEBPGAMMA_Q6 0.02 1 11 0.4 0.1 1.9 0.01 0.08
V$TFIIA_Q6 0.02 1 12 0.4 0.1 1.8 0.03 0.04
EGF:
day+night
CONS V$CREB_Q2 2.E-03 0.15 5 0.4 0.1 4.8 0.01 0.65
V$CREB_Q4 9.E-04 0.12 6 0.5 0.1 4.5 4.E-03 0.55
V$CREB_Q4_01 4.E-03 0.19 7 0.5 0.05 2.9 0.01 0.50
ChIP CREB (relaxed) 0.11 0.11 6 0.5 0.03 1.7 0.24 0.35
Genome Biology 2006, Volume 7, Issue 6, Article R48 Zak et al. R48.5
comment reviews reports refereed researchdeposited research interactions information
Genome Biology 2006, 7:R48
groups compared to random gene groups of the same size. We
did not find statistically significant enrichment for circadian
genes identified in [22] for any of our EGF responsive gene
groups. For the rhythmic SCN genes identified in [17], how-
ever, we observed enrichments in select EGF responsive sub-
sets (Table 1, marked 'Circ.'). Using a gene significance cutoff
of 10% FDR, the overall EGF responsive gene set was
enriched for circadian genes (p
ENRICH
< 0.05, p
M
(LOCAL)
<
0.05), containing 40% of the circadian genes on the array.
Similarly, the genes with CT-dependent EGF responses were
enriched for circadian genes (p
ENRICH
< 0.05, p
M
(LOCAL)
<
0.05). These results suggest that EGFR in the SCN modulates
bioprocesses that are relevant to circadian clock function.
That we found enrichments for one set of circadian genes and
not another is not troublesome given the substantial differ-
ences between these lists [30]. P values for EGF effects and
EGF:CT interactions for the circadian cycling genes identified
in [17] that were present on our arrays are given in Additional
data file 4.
EGFR-responsive pathways and functions
Hypotheses concerning differentially regulated processes/
functions by EGFR in the SCN were derived from tests for sta-
tistically significant (p
ENRICH
(FDR)
< 0.11) and robust
(p
M
(LOCAL)
< 0.06, p
M
(GLOBAL)
< 0.1) GO term enrichments in
the EGF-regulated gene groups. Results for gene groups
defined at FDR <1% are shown in Table 1 (marked 'GO'). Over
20% of the genes on the array annotated with 'protein serine/
threonine kinase activity' were EGF-responsive in some man-
ner, a 2.8-fold enrichment over random groups (p
ENRICH
<
0.002) that was also robust (p
M
(LOCAL)
< 0.02, p
M
(GLOBAL)
<
0.07). The genes are involved in diverse pathways, including
PKCz, PKA
β
1, Kdr, two isoforms of CamKII (Camk2b and
Camk2d), MAPK12, and Raf-1. Similarly, 28% of the genes
annotated with 'cell differentiation' on the array were EGF-
responsive, a 3.4-fold enrichment over random (p
ENRICH
<
0.003) that was robust (p
M
(LOCAL)
< 0.02, p
M
(GLOBAL)
< 0.06).
Furthermore, genes with EGF:CT interactions were robustly
significantly enriched for 'cell differentiation', while genes
with EGF responses independent of circadian time were sig-
nificantly enriched for 'protein serine/threonine kinase activ-
ity'. These results suggest separate regulation of these
processes in the SCN.
EGFR-mediated transcriptional regulation
TF binding site family predictions from MATCH/TRANSFAC Pro using
PAINT
We first utilized MATCH/TRANSFAC Pro predictions of TF
family binding in rat gene promoters as accessed through the
bioinformatics tool PAINT [21]. Robust statistically signifi-
cant enrichments obtained using PAINT were defined as
those for which p
ENRICH
< 0.1 and p
M
(LOCAL)
< 0.06. Results for
the gene groups defined at FDR <2% are shown in Table 1
(marked 'PAINT').
CREB family binding sites were robustly significantly
enriched in the superset of EGF-responsive genes (p
ENRICH
<
0.005, p
M
(LOCAL)
< 0.005, p
M
(GLOBAL)
< 0.1), and genes with
EGF:CT interactions (p
ENRICH
< 0.01, p
M
(LOCAL)
< 0.01). CREB
is an established EGFR signaling target in neurons [31] and
plays a critical role in SCN core clock gene network regulation
by light [32]. Our results, showing enrichment of predicted
CREB binding sites in promoters of genes with CT dependent
EGFR responses, are consistent with a model in which the cir-
EGF: night
only
CONS V$AP1_C 3.E-03 0.14 27 0.7 0.1 1.5 0.03 0.17
V$CEBP_Q2 6.E-04 0.13 20 0.5 0.1 2.0 0.01 0.08
V$CEBP_Q2_01 0.02 0.40 31 0.8 0.1 1.3 0.04 0.16
V$CEBP_Q3 5.E-03 0.16 34 0.8 0.1 1.3 0.01 0.09
V$CREBP1_01 0.01 0.31 8 0.2 0.1 2.5 0.03 0.04
V$ER_Q6_02 4.E-03 0.16 23 0.6 0.1 1.6 0.02 0.15
V$HFH4_01 2.E-03 0.13 7 0.2 0.2 3.6 4.E-03 0.20
V$LMO2COM_02 0.02 0.43 29 0.7 0.1 1.3 0.06 0.13
V$RORA1_01 2.E-03 0.13 11 0.3 0.1 2.6 0.01 0.01
V$RORA2_01 1.E-03 0.13 5 0.1 0.3 5.5 0.02 0.08
Statistically significant enrichments for specific cellular functions or TF binding sites (Attribute) are given for gene groups with specific circadian time
dependent EGF responses (Gene group). Distinct gene groups are enriched for distinct and overlapping functions and TF binding sites. GO, gene
ontology functional annotation; PAINT, TF binding sites predictions using PAINT [21]; CONS, TF binding sites based on evolutionary conservation
[27]; ChIP, TF binding predictions based on the protein-DNA interaction data [28, 29]; Circ., established circadian rhythmic SCN gene expression
[17]; p
ENRICH
, gene group enrichment p value; p
ENRICH
(FDR)
, false discovery rate (FDR) adjusted p
ENRICH
; No. of genes, number of genes in gene group
with the attribute; G
FRAC
, fraction of genes in the gene group with the attribute; A
FRAC
, fraction of all genes on the microarray with the attribute that
are in the gene group; ENRICH, fold enrichment of the attribute in the gene group over random; p
M
(LOCAL)
, local meta-analysis enrichment p value;
p
M
(GLOBAL)
, global meta-analysis enrichment p value. p
ENRICH
, p
ENRICH
(FDR)
, No. of genes, G
FRAC
, A
FRAC
, and ENRICH values are for results obtained
using the standard normalization and are based on gene groups defined at a significance threshold of 1% FDR for GO enrichments, a significance
threshold of 2% for PAINT, CONS and ChIP enrichments, and a significance threshold of 5% for circadian gene enrichments. p
M
(LOCAL)
values are for
standard normalization results and gene group significance thresholds of 5%, 2%, and 1% FDR for GO, PAINT, CONS, and ChIP enrichments and gene
group significance thresholds of 20%, 10%, and 5% FDR for Circ. enrichments. Emphasized attributes are robust as indicated by both meta-analysis p
values (p
M
(LOCAL)
< 0.06 and p
M
(GLOBAL)
< 0.1).
Table 1 (Continued)
EGF responsive genes in the SCN are involved in diverse cellular processes and potentially regulated by diverse transcription factors
R48.6 Genome Biology 2006, Volume 7, Issue 6, Article R48 Zak et al. />Genome Biology 2006, 7:R48
cadian clock regulates regulators of CREB activity [33].
Lastly, the role for CREB in circadian rhythm modulation by
EGFR signaling (predicted presently) is supported by previ-
ous work in which intraperitoneal EGF injections reduced
phosphorylated CREB levels in the esophagus and phase
shifted esophageal circadian DNA synthesis rhythms [34].
Genes with circadian time dependent EGF responses were
robustly significantly enriched for binding site family predic-
tions of other EGFR target TFs. These include: CRE-BP1 [35],
with CRE-BP1:c-Jun family sites enriched at p
ENRICH
< 0.02
and p
M
(LOCAL)
< 0.02); and c-Ets1 [36], with c-Ets-1/68 family
sites enriched at p
ENRICH
< 0.1 and p
M
(LOCAL)
< 0.06. Lastly,
50% of the genes on our arrays with CREBATF family binding
sites had significant EGF:CT interactions, a highly significant
(p
ENRICH
< 0.001) 5.7-fold enrichment over random that was
also locally robust (p
M
(LOCAL)
< 0.02).
TF binding site predictions based on phylogenetic conservation
To supplement the results obtained using PAINT, we tested
for robust statistically significant enrichments of TF binding
site predictions based on phylogenetic conservation from
[27]. Since these conserved sites were reported for human
genes, we mapped them to the rat genes on our arrays using
Homologene [37]. Given the large number of TF binding site
predictions obtained using this method, robust statistically
significant enrichments were defined using more stringent
cutoffs than for PAINT (p
ENRICH
< 0.03 and p
M
(LOCAL)
< 0.06).
Results for the gene groups defined at FDR <2% are shown in
Table 1 (marked 'CONS').
The predicted TF binding site most significantly and robustly
enriched was V$RORA1_01 (vertebrate RORα1 matrix 1),
which was enriched in the superset of EGF-responsive genes
(p
ENRICH
< 1 × 10
-4
, p
M
(LOCAL)
< 5 × 10
-4
, p
M
(GLOBAL)
< 5 × 10
-3
),
genes with EGF:CT interactions (p
ENRICH
< 5 × 10
-4
, p
M
(LOCAL)
< 5 × 10
-3
, p
M
(GLOBAL)
< 5 × 10
-3
), and genes responsive to EGF
only during the night (p
ENRICH
< 2 × 10
-3
, p
M
(LOCAL)
< 0.01,
p
M
(GLOBAL)
< 0.05). Effectively, significant enrichment for
V$RORA1_01 sites was independent of the significance cutoff
used to define gene groups and even the method used to nor-
malize the array data (of those considered). Although the TFs
that bind RORα1 sites are not established targets of EGFR
signaling, two of them (Rorα and Rev-erb-alpha) are essential
components of the circadian clock gene network in the SCN
[22,38,39]. Involvement of Rorα binding sites in the circa-
dian time dependent transcriptional response of the SCN to
EGFR may provide a direct link between EGFR signaling in
the SCN and the core clock.
Binding site predictions for CCAAT/enhancer binding pro-
tein (C/EBP) TFs, some of which are known targets of EGFR
signaling in other systems [40,41], were also robustly signifi-
cantly enriched in the promoters of EGF-responsive gene
groups. V$CEBP_Q2 and V$CEBP_Q3, respective binding
sites for C/EBPα and the C/EBP family broadly, were
enriched in the EGF-responsive superset, genes with EGF:CT
interactions, and genes regulated by EGF during the night
only; whereas V$CEBPGAMMA_Q6 was robustly signifi-
cantly enriched in the EGF-responsive superset and genes
with circadian time independent EGF responses. These
results suggest differential utilization of C/EBP TFs down-
stream of EGFR signaling in the SCN to achieve circadian
time dependent and circadian time independent responses.
Recent work showing core clock gene induction by C/EBPα in
other systems [42] supports a role of C/EBPα in circadian
signaling.
Many enrichment results obtained using phylogenetically
conserved binding site predictions [27] corroborated those
from PAINT, strengthening regulatory hypotheses. Robust
and significant enrichments for c-Ets1 binding sites were
found in EGF:CT interaction genes: for PAINT, c-Ets-1/68
family sites were enriched, while phylogenetic conservation
predictions yielded V$CETS1P54_01 enrichment. Using
PAINT, CRE-BP1:c-Jun family sites were enriched in EGF:CT
interaction genes, while phylogenetic conservation predic-
tions yielded enrichment for V$CREBP1_Q2 in that same
gene group and robust significant enrichment for
V$CREBP1_01 in the genes responsive to EGF during the
night only. Enrichment results obtained using PAINT and
phylogenetic conservation jointly support a hypothesis for the
involvement of c-Jun, a component of the EGFR activated TF
AP1 [43], in the SCN EGFR response, given the enrichments
of CRE-BP1:c-Jun family sites and the AP1 consensus site
(V$AP1_C) in the EGF:CT interaction genes obtained using
those methods, respectively. Finally, significant enrichment
of specific phylogenetically conserved CREB binding sites
(V$CREB_Q2, V$CREB_Q4, and V$CREB_Q4_01) was
found for genes with EGF:CT interactions that were respon-
sive both during the day and night - approximately 50% of the
genes in this group had either the V$CREB_Q4 or
V$CREB_Q4_01 in their promoters. Since this gene group is
a subset of the gene groups for which CREB family enrich-
ments were observed using PAINT, these enrichments pro-
vide additional support for CREB involvement.
TF binding predictions from protein-DNA interaction data
As a final step in generating regulatory hypotheses, we tested
for experimentally established TF promoter binding enrich-
ment in the EGF-regulated gene groups. The available mam-
malian system-wide protein-DNA interaction data are
limited, but the location analysis studies in [28,29] provide
genome-wide promoter binding predictions for CREB and
three hepatocyte nuclear factor (HNF) family members in
human non-neuronal cells, respectively. To utilize these data
in our study, we mapped the human gene data to the rat genes
on our arrays using Homologene. Enrichment results for gene
groups defined at FDR <2% are shown in Table 1 (marked
'ChIP').
Genome Biology 2006, Volume 7, Issue 6, Article R48 Zak et al. R48.7
comment reviews reports refereed researchdeposited research interactions information
Genome Biology 2006, 7:R48
In spite of the fact that the protein-DNA interaction data are
for non-neuronal human cells, moderate enrichments were
observed for HNF1-alpha and CREB in our gene groups,
although neither were robust to the significance threshold for
gene expression effects (p
M
(LOCAL)
> 0.15 for both TFs) or var-
iations in the normalization method (p
M
(GLOBAL)
> 0.20 for
both TFs). Significant enrichment (p
ENRICH
< 0.04) of HNF1-
alpha, an EGF-regulated TF in some systems [44], was
observed in the genes with circadian time dependent EGF
responses. Fifty percent of the genes with EGF:CT interac-
tions were bound by CREB in at least one condition in the
data from [28], a 1.7-fold enrichment over random that is sig-
nificant at a low level (p
ENRICH
< 0.12). Taken with the
robustly statistically significant CREB enrichments obtained
using PAINT and phylogenetic conservation TF binding site
predictions, this result provides additional support for the
hypothesis of CREB involvement in the circadian time
dependent SCN EGFR response.
qRT-PCR validation of TFs implicated by gene group
enrichment analyses
As a preliminary experimental validation of the gene group
enrichment analysis results, we tested using qRT-PCR for dif-
ferential expression of several TFs with robustly enriched
binding sites. Given the possibility of post-transcriptional TF
regulation, however, negative results do not necessarily inval-
idate the enrichment results. Based on the robust significant
enrichments for binding site predictions, Creb1, c-Ets1, c-
Jun, C/EBPα, C/EBPβ, C/EBPγ, Ror
α
and Ror
β
were
selected for validation. Results of the qRT-PCR validation
experiments are discussed below and shown in Figure 2 and
Additional data file 2.
c-Jun was weakly but consistently down-regulated (p
EGF
≤
0.06) in response to EGF treatment during the day and the
night. Creb1 and c-Ets1, however, were down-regulated in
response to EGF during the day and up-regulated by EGF
during the night (both 1.5-fold). These responses were statis-
tically significant (p
EGF:CT
< 5 × 10
-5
for Creb1 and p
EGF:CT
< 5
× 10
-3
for c-Ets1). C/EBP
α
was consistently up-regulated dur-
ing the circadian night only (p
EGF:CT
< 0.05, 4-fold induction),
while C/EBP
β
was consistently down-regulated during the
circadian day only (p
EGF:CT
< 5 × 10
-3
, 3-fold repression).
Although we did not detect C/EBP
γ
expression in one of our
daytime EGF-treated samples, we found it to be weakly
repressed by EGFR signaling in a CT-independent manner
(p
EGF
< 0.05). We did not observe any statistically significant
effects on Ror
α
and Ror
β
expression. Interestingly, signifi-
cant CT effects on expression (in the absence of EGF) were
not observed for any of the TFs considered. It is possible that
transcripts for these TFs do cycle with circadian time, but
were not detected as such because of our choice of circadian
time points or because the changes are small relative to the
animal-animal variability. In spite of these possibilities, we
will base our subsequent regulatory hypotheses on our inabil-
ity to detect circadian expression changes and will leave fur-
ther verification for future studies. We also note that we
observed Creb1 expression responses even though CREB is
generally considered a constitutive TF [45]. Although rare,
there are examples of Creb1 gene expression changes in
response to extracellular stimuli in neurons [46]. The novel
changes observed in the current study warrant further
investigation.
Previous studies have suggested that expression profile corre-
lations may be indicative of functional regulatory relation-
ships between TFs and their target genes [47]. While we have
demonstrated that gene dynamics may lead to more complex
relationships between TF and target expression patterns in
some conditions [48], we nevertheless undertook an analysis
to test for significant correlations between the selected TFs
and the EGF responsive gene groups. Specifically, we tested
TF transcriptional responses to SCN EGFR activation and their expression correlations with target gene groupsFigure 2
TF transcriptional responses to SCN EGFR activation and their expression
correlations with target gene groups. (a) Gene expression responses to
EGFR activation of five TFs implicated by the gene group enrichment
(qRT-PCR). c-Jun is consistently down-regulated during both day and night,
c-Ets1 and Creb1 are both down-regulated during the day and up-regulated
during the night, C/EBP
α
is consistently up-regulated during the night only,
and C/EBP
β
is consistently down-regulated during the day only. Red and
blue shades represent positive and negative changes in expression,
respectively. dE.1, dE.2, and dE.3 represent scaled normalized -∆Ct values
(approximate log
2
expression levels, see Materials and methods) in
daytime rats while dE.N1 and dE.N2 represent scaled -∆Ct values in
nighttime rats. To facilitate comparisons between genes, expression
differences were divided by their maximum absolute values. Additional
data file 2 displays the relative animal-animal variability in the expression
responses. (b) Statistically significant (p < 0.01) average absolute Pearson
correlations between scaled log
2
TF expression levels (qRT-PCR) and
scaled log
2
expression levels of EGF responsive genes (microarray). Creb1
expression was strongly correlated with expression profiles of putative
circadian time dependent target gene groups whereas c-Ets1 expression
was more weakly, but nevertheless significantly, correlated with those
gene groups. c-Jun was predicted to regulate target genes in a circadian
time dependent manner but has a circadian time independent expression
response that is significantly correlated with the circadian time
independent gene group. C/EBP
β
expression was significantly correlated
with putative daytime C/EBP target genes while C/EBP
α
expression was
significantly correlated with putative C/EBP target nighttime responsive
genes. Black squares indicate the absence of statistically significant
correlations whereas orange squares indicate the presence of statistically
significant correlations. Correlation strength is represented by color
intensity, with the lowest significant average absolute correlation being 0.5
(between C/EBP
α
and the overall EGF responsive gene set) and the highest
significant average absolute correlation being 0.9 (between Creb1 and the
genes responsive to EGF during the day and the night). Images for (a) and
(b) were created using the free program Treeview [62].
R48.8 Genome Biology 2006, Volume 7, Issue 6, Article R48 Zak et al. />Genome Biology 2006, 7:R48
whether the average absolute value of the correlations
between TF expression profiles and the EGF responsive gene
groups were greater than the correlations between the TFs
and random gene groups of the same size. We observed statis-
tically significant (p < 0.01) correlations between the impli-
cated TFs and the EGF responsive gene groups in the SCN for
all TFs considered except C/EBP
γ
(Figure 2b). As discussed
above, we found multiple lines of evidence supporting a role
for CREB in regulating the CT-dependent EGF responses in
the SCN. Further support for this relationship was given by
significant correlations between the Creb1 expression profile
and the expression profiles of genes in the gene groups
enriched for CREB-related binding sites (p = 5 × 10
-4
in all
cases). We also observed significant correlation between the
c-Ets1 expression profile and the profiles of the CT-dependent
EGF responsive gene group that was enriched for c-Ets1
related binding sites (p = 5 × 10
-4
); between the C/EBP
α
expression profile and the profiles of the gene group that was
EGF responsive during the night only and was enriched for C/
EBP related binding sites (p = 5 × 10
-4
); and between the C/
EBP
β
expression profile and the profiles of the gene group
that was EGF responsive during the day only that was
enriched for C/EBP related binding sites (p = 5 × 10
-4
). It
must be noted that significant correlations between these TFs
and gene groups that were not enriched for their binding sites
were also observed, demonstrating potential limitations in
relying solely on expression profile correlations to link TFs to
their targets [48]. Interestingly, the correlation between c-
Jun and the genes with CT-independent EGF responses was
statistically significant (p = 5 × 10
-4
), even though this gene
group was not enriched for c-Jun related binding sites. It is
thus likely that CT-dependent post-transcriptional mecha-
nisms are responsible for the CT-dependent target gene regu-
lation that appears to involve this TF.
A plausible hypothesis to explain the putative circadian time
dependent regulation of EGFR target genes by these TFs is
that they are available to be regulated by EGFR signaling at
some circadian times but not others. This mechanism for con-
text-dependent regulation has been observed previously [7]
and would be supported by strong circadian variation in TF
mRNA levels. The qRT-PCR results for the TFs considered,
showing no significant circadian variation in gene expression,
do not support this hypothesis, and an alternative mechanism
is required. The expression responses of Creb1, c-Ets1, C/
EBP
α
, and C/EBP
β
to EGF treatment were themselves circa-
dian time dependent, and it is thus possible that these expres-
sion changes partially account for the putative circadian time
dependent regulation of target genes by these TFs. In this
case, the circadian clock must modulate the upstream signal-
ing pathways that lead to their gene regulation. c-Jun expres-
sion regulation by EGF at the mRNA level was circadian time
independent and thus cannot account for circadian time
dependent gene-expression regulation downstream of EGFR.
Circadian time dependent post-transcriptional regulation of
c-Jun activity or circadian time dependent regulation of c-
Jun cofactors would be required for regulation of circadian
time dependent EGFR responses.
A schematic summarizing all of the predicted regulatory
interactions is provided in Figure 3.
Conclusion
Our factorial-designed microarray experiments, mixed-
model ANOVA, gene group enrichment analyses, meta-anal-
yses, and qRT-PCR validations provide insight into the regu-
lation of circadian time dependent EGFR signaling in the
SCN. Even though the arrays that we used were relatively
small in scale, the extensive functional annotation of the
genes allowed us to perform gene group enrichment analyses
from which regulatory hypotheses were derived. Several of
the hypotheses are consistent across the different TF binding
predictions utilized, giving us greater confidence that they
provide clues to the underlying biology. By performing meta-
analyses of our enrichment results, we were able to identify
results that were robust to small variations in the significance
thresholds and normalization procedures and, therefore,
potentially more reflective of the underlying biological waves
of regulation.
The extensive literature information about EGFR signaling in
other systems allowed us to put many enrichment analysis
results into appropriate context. The regulatory hypotheses
we developed, based on our microarray experiments, GO
information, several sources of TF binding predictions, qRT-
PCR experiments, and the literature, are summarized in Fig-
ure 3. Interestingly, the two TF binding sites that were most
strongly enriched in all of the analyses, CREB and RORA1, are
very similar to the two significant binding sites identified in a
previous promoter bioinformatics study of genes with circa-
dian expression patterns in the SCN [22], providing addi-
tional evidence for a link between SCN EGFR signaling and
the core circadian gene regulatory network. Our results sup-
port a functional role of EGFR signaling in the circadian
clock, give insights into the mechanisms underlying func-
tional input integration in the SCN, and provide a framework
for further analysis of this important physiological process.
Materials and methods
Experimental design
We investigated the difference in SCN gene expression
between 'day' (8 hours after lights on) and 'night' (2 hours
after lights off) following EGFR activation by EGF treatment.
Circadian phase shifts induced by other stimuli have been
reported at these time points [5], rendering them good candi-
dates for interrogating EGFR-induced gene expression. Two
SCN were obtained from each rat for EGF-treated and vehi-
cle-treated samples. Pairing control and treated samples from
the same rat permitted detection of EGF effects in the pres-
ence of substantial animal-to-animal variability. SCN from
Genome Biology 2006, Volume 7, Issue 6, Article R48 Zak et al. R48.9
comment reviews reports refereed researchdeposited research interactions information
Genome Biology 2006, 7:R48
two rats were treated at each circadian time, yielding a total of
eight biological samples. Since our goal was a preliminary
characterization of EGFR response circadian time
dependency, samples were hybridized to one microarray
each. An experimental design schematic is given in Figure 4.
A universal reference design was employed for the microar-
rays themselves [49].
Hypothesized regulatory interactions that partially account for circadian time dependent EGFR transcriptional responses in the SCNFigure 3
Hypothesized regulatory interactions that partially account for circadian time dependent EGFR transcriptional responses in the SCN. Modulation of the
SCN gene expression response to EGFR activation (via EGF) by the circadian clock was investigated in the present study. We identified groups of genes
with both CT-dependent and CT-independent expression responses, and these groups were enriched for specific cellular functions and the presence of
specific TF binding sites in their promoters. Genes with CT-independent EGF responses were enriched for serine/threonine kinase activity and for C/EBPγ
binding sites in their promoters. Given their CT-independent responses, and given that we observed weak CT-independent C/EBPγ expression responses
to EGF, it is plausible that the EGFR-regulated signaling pathways responsible for their induction through C/EBPγ-dependent and -independent mechanisms
function independently of the circadian clock. Genes with CT-dependent responses were enriched for involvement in cellular differentiation processes and
the presence of c-Ets1, AP1, C/EBP, RORα, and CREB binding sites. Although RORα is a direct regulatory target of the circadian clock, we did not
observe CT or EGFR expression responses for this gene and, thus, it may cause EGF induced CT-dependent gene regulation through post-transcriptional
mechanisms. On the other hand, we did observe CT-dependent EGFR expression responses of c-Ets1, Creb1, C/EBP
α
, and C/EBP
β
, constituting a
mechanism by which these genes may cause CT-dependent expression responses of their target genes, and indicating that these TFs must be regulated by
CT-dependent pathways. Interestingly, c-Jun EGFR expression responses were CT-independent, indicating that it must regulate CT-dependent expression
responses through CT-dependent post-transcriptional mechanisms. Solid lines indicate direct interactions, dotted lines represent indirect CT-independent
interactions, and dashed lines represent indirect CT-dependent interactions. CREB is emphasized given the strong support provided by multiple
independent analyses for its involvement in the EGFR response.
EGF
Clock-modulated
signaling pathways
Genes w ith
clock-dependent EGFR
responses
Genes with
clock-independent
EGFR responses
CREB
RORα
ETS1,
C/EBPα,β
Clock-independent
signaling pathways
Cell differentiation processes
Serine/threonine
kinases
c-Jun
C/EBP
γ
Creb1, c-Ets1
C/EBP
α
, C/EBP
β
AP1
Circadian
clock
EGFR
C/EBPγ
R48.10 Genome Biology 2006, Volume 7, Issue 6, Article R48 Zak et al. />Genome Biology 2006, 7:R48
SCN sample preparation
Adult Sprague-Dawley rats (100 to 150 g) housed individually
and entrained to 12:12 light-dark cycles (lights on at 6:00 AM
and lights off at 6:00 PM) for at least two weeks were rapidly
sacrificed between 10:00 AM and 12:00 PM for daytime treat-
ments and between 4:00 PM and 6:00 PM for night treat-
ments according to a protocol approved by TJU Institutional
Animal Care and Use Committee. Brains were excised
quickly, placed in ice-cold, oxygenated artificial cerebral spi-
nal fluid (ACSF; 10 mM HEPES, pH 7.4, 140 mM NaCl, 5 mM
KCl, 1 mM MgCl2, 1 mM CaCl2, 24 mM D-Glucose), and cut
into 500 µm coronal sections using a vibroslice vibratome
(752M, Camden Instruments, Leica, UK). The resulting SCN
slices were cultured in oxygenated ACSF for at least 60 min-
Experimental designFigure 4
Experimental design. We used a total of four rats in the present microarray studies, two for the circadian day (8 hours after lights on, rats (a) and (b)), and
two for the circadian night (2 hours after lights off, rats (c) and (d)). From each rat we obtained coronal slices that contained two SCN (left and right),
separated by the third ventricle. Slices were separated along the third ventricle and placed in media containing EGF (20 nM) or control vehicle (C) for one
hour. RNA for use with the microarrays was then extracted from SCN punches from the slices.
EGF
C
EGF
C
EGF
C
EGF
C
(a) (b)
(c) (d)
Day
Night
Genome Biology 2006, Volume 7, Issue 6, Article R48 Zak et al. R48.11
comment reviews reports refereed researchdeposited research interactions information
Genome Biology 2006, 7:R48
utes at 35°C. After incubation, slices were bisected along the
third ventricle, separating the 'left' and 'right' SCN, and trans-
ferred into a new media containing the treatment (20 nM
EGF or vehicle). This concentration was selected because pre-
vious work in hepatocytes [50] showed that saturating levels
of EGFR activation are achieved with 20 nM levels of EGF;
similarly, studies using lower concentrations in hippocampal
brain slices have observed robust responses [51,52]. Slices
were incubated in treatment for 60 minutes before taking
0.75 mm micropunches (Stoelting, Chicago, IL, USA).
Punches for day treatment were taken at 2 PM (8 hours after
lights on) while punches for night treatment were taken at 8
PM (2 hours after lights off). RNA was extracted using the
Rneasy mini kit (Qiagen, Valencia, CA, USA), yielding
approximately 200 nanograms of total RNA/punch. Two
hundred to four hundred nanograms total RNA were ampli-
fied using two rounds of antisense RNA (aRNA) amplification
using the RNA MessageAmp kit (Ambion, Austin, TX, USA),
yielding no less than 130 µg aRNA. aRNA quality was
assessed using Bioanalyzer Picochip (Agilent Technologies,
Palo Alto, CA, USA), and 2.25 µg of aRNA was used to gener-
ate amino-allyl and Cy dye conjugated labeled cDNA (Cy5,
Amersham Pharmacia Biotech, Piscataway, NJ, USA) using
the indirect aminoallyl-dNTP approach. Experimental details
for microarray hybridization, scanning, and quantification
are in Additional data file 5.
Microarrays
In-house constructed cDNA microarrays containing 2,700
unique University of Iowa Rat clones from all rat tissues spot-
ted at least twice per slide (5,464 spots split across 48 subar-
rays per slide) onto 1' by 3' glass microarray slides (Corning,
Corning, NY, USA) were used in the present study. Clones
were selected on the basis of possessing good quality GO
annotation and available promoter sequences. PCR ampli-
cons were prepared from freshly grown overnight cultures of
clones for printing using GF200 primers. Following
amplification and purification, amplicons were resuspended
in 20 µL of 50% DMSO and printed onto UltraGAPs aminosi-
lane-coated slides (Corning) using a MicroGridTAS (Genomic
Solutions, Ann Arbor, MI, USA) rearrayer. After printing,
DNA was cross-linked to the slides by UV irradiation with a
Stratalinker UV Crosslinker (Stratagene, La Jolla, CA, USA)
and stored in a vacuum chamber until use.
Microarray data normalization
Normalization of microarray data was performed using a ran-
dom effects ANOVA model with terms for slide, subarray, and
slide:subarray interactions, similar to [53,54]. Following
[54], additional normalization was accomplished by scaling
the ANOVA model residuals with the subarray specific stand-
ard deviations to standardize the dispersion. This two-step
normalization procedure is referred to as 'standard normali-
zation' throughout the manuscript. Computations were per-
formed using the package NLME [20] in the statistical
analysis environment R [55].
Identification and classification of EGF-responsive
genes
Genes with EGF responses modulated by circadian time were
identified using mixed-model ANOVA. Following previous
studies [53,56], mixed models with terms for the fixed effects
of interest and obscuring random effects were fit to normal-
ized expression data for each gene:
log
2
(y
ijkl
) = µ + E
i
+ C
j
+ EC
ij
+ R
k
+ ε
ijl(k)
(1)
where: y
ijkl
is the normalized expression level of a specific
gene; E = EGF treatment fixed effect (i = 0 for vehicle; i = 1 for
EGF); C = circadian time fixed effect (j = 0 for Day; j = 1 for
Night); R = N(0, σ
R
2
) rat random effect (k = (a, b, c, d) for the
four rats used); and ε
ijl(k)
= N(0, σ
ε
2
) residual error (where
N(0, v) indicates a normal distribution with zero mean and
variance v). Indices for spots of genes repeated on a single
array are given by subscript l (l = 1 for N
s
, where N
s
= number
of spots per array for that gene; N
s
= 2 for most genes). Mod-
els were fit using maximum likelihood and restricted maxi-
mum likelihood (REML) algorithms in the R package NLME
[20]. Genes with EGF responses, circadian time dependent
EGF responses, and specific EGF:CT interactions were iden-
tified by fitting Equation 1 and reduced versions with terms
removed. The overall hierarchical classification procedure is
shown in Figure 5 and details are given in Additional data file
5.
Enrichment analyses
Hypotheses for SCN circadian time dependent EGF signaling
regulation were generated by testing EGF-responsive gene
groups for enrichment of functional attributes. Evidence for
modulation of core circadian clock function by EGFR signal-
ing was obtained by testing for enrichments of established
SCN circadian genes [17,22] in the EGF responsive gene
groups. Cellular process/function hypotheses were generated
from GO term enrichments. Transcriptional regulatory
hypotheses were based on enrichments of predicted TF bind-
ing activities, referred to as transcriptional regulatory net-
work analysis. Three sources of TF binding predictions were
used: TRANSFAC Pro database of TF binding sites with the
MATCH tool [26] as automated using PAINT [21]; predic-
tions based on phylogenetic conservation of TF binding sites
from [27]; and protein-DNA interaction data for CREB [28]
and three HNF family members [29]. Genes too long to show
differential transcription induced expression changes after
one hour of EGF treatment were excluded from the transcrip-
tional regulatory network analysis (genes >75,000 base pairs
(bp), assuming 1,500 bp/minute elongation [57] and 10
minute processing [58]). Fisher's exact test was used to com-
pute enrichment p values (p
ENRICH
), using all microarray
genes as the reference, following [21]. Gene attributes (GO or
TF binding) not present in at least five genes in a particular
gene group were not tested. Fisher's test p values were FDR
adjusted based on [59]. Further enrichment analysis details
are in Additional data file 5.
R48.12 Genome Biology 2006, Volume 7, Issue 6, Article R48 Zak et al. />Genome Biology 2006, 7:R48
Meta-analysis of enrichments
Enrichment of GO or TF binding sites in different gene groups
can depend nonlinearly on the parameters used to define sig-
nificantly differentially expressed gene groups [25]. Further-
more, microarray results can depend somewhat on the
normalization approach employed [54]. Ideally, enrichment
results will reflect waves of regulation and, therefore, will be
robust to small variations in significance cut offs and normal-
ization techniques. To identify enrichment results insensitive
to these variables, we supplemented the gene group analyses
by computing two additional p values, p
M
(LOCAL)
and p
M
(GLO-
BAL)
, which are local and global meta-analysis p values,
respectively. p
M
(LOCAL)
is the geometric mean (GM) of the
enrichment p values (p
ENRICH
) computed for gene groups
defined using three cut offs for significance for the standard
normalization. p
M
(GLOBAL)
is the GM of the enrichment p val-
ues computed for gene groups defined using the three signif-
icance cut offs and 8 slightly different normalization
techniques, a total of 24 conditions. Attributes with low val-
ues of p
M
(LOCAL)
and p
M
(GLOBAL)
are 'robustly enriched' because
their overall enrichment is not dependent on a particular sig-
nificance cut off or normalization. The cut off for 'locally
robust enrichment' was p
M
(LOCAL)
< 0.06 while it was p
M
(GLO-
BAL)
< 0.10 for 'globally robust enrichment'. Full details are in
Additional data file 5.
qRT-PCR testing of implicated TFs
Expression levels of TFs implicated in circadian time depend-
ent responses to EGF in the SCN (c-Jun, c-Ets1, Creb1, C/
EBP
α
, C/EBP
β
, C/EBP
γ
, Ror
α
and Ror
β
) were measured
using qRT-PCR. Fyn was used as a housekeeping control gene
given that two independent Fyn clones had no significant
EGF or circadian time effects and relatively small experimen-
tal variability on our microarrays. aRNA from the microarray
samples and two additional daytime samples were used for
qRT-PCR.
The analysis approach used for the qRT-PCR data was a com-
bination of the '∆∆Ct' method [60] and the mixed-model
ANOVA employed for the microarray analysis. The approxi-
mate range of exponential growth for each gene in each well
was first determined from the amplification curves using a
procedure modified from [61].
Studentized residuals were used to detect the onset of the
exponential growth phase from the background subtracted
(DeltaRn) reaction curve. The beginning of exponential
growth was defined as the point after which four outlier
points were detected in a row at p <0.025. The termination of
the exponential growth phase was defined as the point at
which the slope of the log-transformed amplification curve
(as estimated using linear regression over a window of five
cycles) first differs from the initial slope of the exponential
phase (as estimated using linear regression over a window of
five cycles) with 95% confidence. Regressions and computa-
tions were performed using the stats package in the statistical
analysis environment R [55]. PCR reactions that did not
amplify (did not reach a raw intensity of 0.2) were excluded
from the analysis.
With regions of exponential growth defined for each gene in
each condition, it was possible to compute delta-cycle-thresh-
olds (∆Cyt
g
) for each gene (g) with respect to the housekeep-
ing gene (h), such that:
∆Cyt
g
(I) = Cyt
g
(I) - Cyt
h
(I) (2)
where I is the 'threshold intensity' - the intensity of the ampli-
fication curve at which the cycle thresholds (Cyt) for each
gene and the housekeeping gene are estimated. If both the
housekeeping gene and the gene of interest are in exponential
phases with the same efficiency, the ∆Cyt
g
should not depend
on I and will be proportional to -log2 the relative expression
level (-log2([g]/ [h])) if the efficiencies are perfect (= 2),
where [g] is the transcript concentration of the gene of inter-
est and [h] is the transcript concentration of the housekeep-
ing gene. ∆Cyt
g
, however, generally shows some weak
nonlinear dependence on I. Estimation of the exponential
phases allows identification of the intensity regions where
Hierarchical analysis approachFigure 5
Hierarchical analysis approach. Genes were first classified as EGF
responsive by performing a likelihood ratio test to compare the fits of
maximum likelihood estimated mixed models with and without EGF
terms. EGF responsive genes were then classified as to whether or not
they had a significant EGF:CT interaction, as determined by a Wald F-test
of the REML estimated full model. EGF responsive genes with EGF:CT
interactions were then classified according to whether they were
responsive to EGF during the day only, during the night only, or at both
times. Genes with significant EGF:CT interactions were then subdivided
according to the directionality ofthe responses.
EGF-responsive genes
Have EGF:CT
interaction
No EGF:C T
interaction
All genes
Day and night
responses
Day response
only
Night response
only
Up in day
down in night
Down in day
up in night
-
Genome Biology 2006, Volume 7, Issue 6, Article R48 Zak et al. R48.13
comment reviews reports refereed researchdeposited research interactions information
Genome Biology 2006, 7:R48
amplicons for both the housekeeping gene and the gene of
interest are undergoing exponential growth. If that overlap
spans several PCR cycles for both genes, multiple estimates of
∆Cyt
g
can be obtained by interpolation of the amplification
curves. This was true in all cases presently. For each gene of
interest in each condition, the amplification curves were
interpolated on an exponential scale in the region of overlap
with the housekeeping gene to obtain n + 1 estimates of ∆Cyt
g
,
where n is the minimum number PCR cycles (between the
gene of interest and the housekeeping gene) where overlap of
the exponential phases occurs. The multiple estimates of
∆Cyt
g
(I) were used to compute an overall average ∆Cyt
g, av
that was used in the subsequent analyses.
∆Cyt
g, av
was computed as described above for each gene for
each condition on each PCR plate used in the measurements.
To account for any plate or plate-region specific bias, the
mean ∆Cyt
g, av
across all conditions for gene (g) on the same
plate or region was subtracted, to give normalized (∆Cyt
g,
norm
) values for analysis. The qRT-PCR data retain the facto-
rial mixed-effects structure of the microarray data, and for
this reason mixed model ANOVA was again employed to
identify statistically significant effects on gene expression.
Specifically, the following model was used (where the sub-
scripts on ∆Cyt
g, norm
have been removed for clarity):
-∆Cyt
ijklm
=
µ
+ E
i
+ C
j
+ EC
ij
+ R
k
+ ε
ijkm
(3)
The terms on the right-hand side of Equation 3 have the same
meaning as the terms in Equation 1, except that l, the index
associated with spots (nested within rats), has been replaced
with the index m, an index associated with PCR plates or PCR
plate quadrants in which measurements were taken. Since
measurements of all conditions were obtained on each PCR
plate, PCR plates are not nested in rats. The parameters in
Equation 3 were estimated for each gene using REML. Wald
F tests were then performed to determine whether any of the
fixed effects were statistically significant. As above, computa-
tions were performed using the NLME package in R [20].
Lastly, we undertook an analysis to determine whether the
'overall' correlations between the TF expression profiles and
the EGF responsive gene groups were greater than the corre-
lations between the TFs and random gene groups of the same
size. Details of this analysis are provided in Additional data
file 5.
Data deposition
Raw expression data for the present study has been submitted
to the NCBI Gene Expression Omnibus as series GSE4245.
Additional data files
The following additional data are available with the online
version of this paper. Additional data file 1 is a figure showing
gene expression boxplots for several genes with specific circa-
dian time dependent EGF responses in the SCN. Additional
data file 2 is a figure showing gene expression boxplots for the
transcription factors investigated by qRT-PCR. Additional
data file 3 is a table listing p values for EGF effects and
EGF:CT interactions for all genes present on the microarrays
of the current study. Additional data file 4 is a table listing p
values for EGF effects and EGF:CT interactions for SCN circa-
dian genes [17] present on the microarrays of the current
study. Additional data file 5 provides more detailed materials
and methods. Additional data file 6 provides supplementary
results.
Additional data file 1Gene expression boxplots for several genes with specific circadian time dependent EGF responses in the SCNGene expression boxplots for several genes with specific circadian time dependent EGF responses in the SCN.Click here for fileAdditional data file 2Gene expression boxplots for the transcription factors investigated by qRT-PCRGene expression boxplots for the transcription factors investigated by qRT-PCR.Click here for fileAdditional data file 3P values for EGF effects and EGF:CT interactions for all genes present on the microarrays of the current studyP values for EGF effects and EGF:CT interactions for all genes present on the microarrays of the current study.Click here for fileAdditional data file 4P values for EGF effects and EGF:CT interactions for SCN circadian genes [17] present on the microarrays of the current studyP values for EGF effects and EGF:CT interactions for SCN circadian genes [17] present on the microarrays of the current study.Click here for fileAdditional data file 5Detailed materials and methodsDetailed materials and methods.Click here for fileAdditional data file 6Additional resultsAdditional results.Click here for file
Acknowledgements
We thank the anonymous reviewers for their careful reading of our manu-
script and constructive suggestions. We thank NIH/NIGMS BISTI (1 P20
GM67266-03) and DARPA (F30602-01-2-0578) for funding. DEZ also
thanks the University of Delaware, Department of Chemical Engineering
for funding and Brian Egan and Rishi Khan for discussions.
References
1. Young MW, Kay SA: Time zones: A comparative genetics of
circadian clocks. Nat Rev Genet 2001, 2:702-715.
2. Reppert SM, Weaver DR: Coordination of circadian timing in
mammals. Nature 2002, 418:935-941.
3. Miche S, Colwell CS: Cellular communication and coupling
within the suprachiasmatic nucleus. Chronobiol Int 2001,
18:579-600.
4. Hastings MH: Circadian biology: Fibroblast clocks keep
ticking. Curr Biol 2005, 15:R16-18.
5. Gillette MU, Mitchell JW: Signaling in the suprachiasmatic
nucleus: Selectively responsive and integrative. Cell Tissue Res
2002, 309:99-107.
6. Tan PB, Kim SK: Signaling specificity: The RTK/RAS/MAP
kinase pathway in metazoans. Trends Genet 1999, 15:145-149.
7. Simon MA: Receptor tyrosine kinases: Specific outcomes from
general signals. Cell 2000, 103:13-15.
8. Xian CJ, Zhou XF: EGF family of growth factors: Essential roles
and functional redundancy in the nerve system. Front Biosci
2004, 9:85-92.
9. Van der Zee EA, Roman V, Ten Brinke O, Meerlo P: TGFalpha and
AVP in the mouse suprachiasmatic nucleus: Anatomical
relationship and daily profiles. Brain Res 2005, 1054:159-166.
10. Jobst EE, Robinson DW, Allen CN: Potential pathways for
intercellular communication within the calbindin subnucleus
of the hamster suprachiasmatic nucleus. Neuroscience 2004,
123:87-99.
11. Ma YJ, Hill DF, Junier MP, Costa ME, Felder SE, Ojeda SR: Expres-
sion of epidermal growth factor receptor changes in the
hypothalamus during the onset of female puberty. Mol Cell
Neurosci 1994, 5:246-262.
12. Li X, Sankrithi N, Davis FC: Transforming growth factor-alpha is
expressed in astrocytes of the suprachiasmatic nucleus in
hamster: Role of glial cells in circadian clocks. Neuroreport
2002, 13:2143-2147.
13. Kramer A, Yang FC, Snodgrass P, Li X, Scammell TE, Davis FC, Weitz
CJ: Regulation of daily locomotor activity and sleep by
hypothalamic EGF receptor signaling. Science 2001,
294:2511-2515.
14. Snodgrass-Belt P, Gilbert JL, Davis FC: Central administration of
transforming growth factor-alpha and neuregulin-1 suppress
active behaviors and cause weight loss in hamsters. Brain Res
2005, 1038:171-182.
15. Hao H, Schwaber J: Epidermal growth factor receptor induced
Erk phosphorylation in the suprachiasmatic nucleus. Brain Res
in press.
16. Rich T, Innominato PF, Boerner J, Mormont MC, Iacobelli S, Baron B,
Jasmin C, Levi F: Elevated serum cytokines correlated with
altered behavior, serum cortisol rhythm, and dampened 24-
hour rest-activity patterns in patients with metastatic color-
R48.14 Genome Biology 2006, Volume 7, Issue 6, Article R48 Zak et al. />Genome Biology 2006, 7:R48
ectal cancer. Clin Cancer Res 2005, 11:1757-1764.
17. Panda S, Antoch MP, Miller BH, Su AI, Schook AB, Straume M, Schultz
PG, Kay SA, Takahashi JS, Hogenesch JB: Coordinated transcrip-
tion of key pathways in the mouse by the circadian clock. Cell
2002, 109:307-320.
18. Shvartsman SY, Hagan MP, Yacoub A, Dent P, Wiley HS, Lauffen-
burger DA: Autocrine loops with positive feedback enable
context-dependent cell signaling. Am J Physiol Cell Physiol 2002,
282:C545-559.
19. Scholtens D, Miron A, Merchant FM, Miller A, Miron PL, Iglehart JD,
Gentleman R: Analyzing factorial designed microarray
experiments. J Multivariate Anal 2004, 90:19-43.
20. Pinheiro J, Bates DM: Mixed-Effects Models in S and S-Plus New York:
Springer; 2000.
21. Vadigepalli R, Chakravarthula P, Zak DE, Schwaber JS, Gonye GE:
PAINT: A promoter analysis and interaction network gener-
ation tool for gene regulatory network identification. OMICS
2003, 7:235-252.
22. Ueda HR, Chen W, Adachi A, Wakamatsu H, Hayashi S, Takasugi T,
Nagano M, Nakahama K, Suzuki Y, Sugano S, et al.: A transcription
factor response element for gene expression during circa-
dian night. Nature 2002, 418:534-539.
23. Yang YC, Piek E, Zavadil J, Liang D, Xie D, Heyer J, Pavlidis P, Kucher-
lapati R, Roberts AB, Bottinger EP: Hierarchical model of gene
regulation by transforming growth factor beta. Proc Natl Acad
Sci USA 2003, 100:10269-10274.
24. Tullai JW, Schaffer ME, Mullenbrock S, Kasif S, Cooper GM: Identifi-
cation of transcription factor binding sites upstream of
human genes regulated by the phosphatidylinositol 3-kinase
and MEK/ERK signaling pathways. J Biol Chem 2004,
279:20167-20177.
25. Pan KH, Lih CJ, Cohen SN: Effects of threshold choice on biolog-
ical conclusions reached during analysis of gene expression
by DNA microarrays. Proc Natl Acad Sci USA 2005,
102:8961-8965.
26. Matys V, Fricke E, Geffers R, Gossling E, Haubrock M, Hehl R, Hor-
nischer K, Karas D, Kel AE, Kel-Margoulis OV, et al.: TRANSFAC:
Transcriptional regulation, from patterns to profiles. Nucleic
Acids Res 2003, 31:374-378.
27. Xie X, Lu J, Kulbokas EJ, Golub TR, Mootha V, Lindblad-Toh K,
Lander ES, Kellis M: Systematic discovery of regulatory motifs
in human promoters and 3' UTRs by comparison of several
mammals. Nature 2005, 434:338-345.
28. Zhang X, Odom DT, Koo SH, Conkright MD, Canettieri G, Best J,
Chen H, Jenner R, Herbolsheimer E, Jacobsen E, et al.: Genome-
wide analysis of cAMP-response element binding protein
occupancy, phosphorylation, and target gene activation in
human tissues. Proc Natl Acad Sci USA 2005, 102:4459-4464.
29. Odom DT, Zizlsperger N, Gordon DB, Bell GW, Rinaldi NJ, Murray
HL, Volkert TL, Schreiber J, Rolfe PA, Gifford DK, et al.: Control of
pancreas and liver gene expression by HNF transcription
factors. Science 2004, 303:1378-1381.
30. Delaunay F, Laudet V: Circadian clock and microarrays: Mam-
malian genome gets rhythm. Trends Genet 2002, 18:595-597.
31. Ciccolini F: Identification of two distinct types of multipotent
neural precursors that appear sequentially during CNS
development. Mol Cell Neurosci 2001, 17:895-907.
32. Meijer JH, Schwartz WJ: In search of the pathways for light-
induced pacemaker resetting in the suprachiasmatic
nucleus. J Biol Rhythms 2003, 18:235-249.
33. Kako K, Ishida N: The role of transcription factors in circadian
gene expression. Neurosci Res 1998, 31:257-264.
34. Scheving LA, Gardner W: Circadian regulation of CREB tran-
scription factor in mouse esophagus. Am J Physiol 1998,
274:C1011-1016.
35. Ouwens DM, de Ruiter ND, van der Zon GC, Carter AP, Schouten J,
van der Burgt C, Kooistra K, Bos JL, Maassen JA, van Dam H: Growth
factors can activate ATF2 via a two-step mechanism: Phos-
phorylation of Thr71 through the ras-MEK-ERK pathway and
of Thr69 through RalGDS-src-p38. EMBO J 2002, 21:3782-3793.
36. Watabe T, Yoshida K, Shindoh M, Kaya M, Fujikawa K, Sato H, Seiki
M, Ishii S, Fujinaga K: The ets-1 and ets-2 transcription factors
activate the promoters for invasion-associated urokinase
and collagenase genes in response to epidermal growth
factor. Int J Cancer 1998, 77:128-137.
37. Wheeler DL, Church DM, Edgar R, Federhen S, Helmberg W, Mad-
den TL, Pontius JU, Schuler GD, Schriml LM, Sequeira E, et al.: Data-
base resources of the national center for biotechnology
information: Update. Nucleic Acids Res 2004, 32:D35-40.
38. Sato TK, Panda S, Miraglia LJ, Reyes TM, Rudic RD, McNamara P, Naik
KA, FitzGerald GA, Kay SA, Hogenesch JB: A functional genomics
strategy reveals rora as a component of the mammalian cir-
cadian clock. Neuron 2004, 43:527-537.
39. Ueda HR, Hayashi S, Chen W, Sano M, Machida M, Shigeyoshi Y, Iino
M, Hashimoto S: System-level identification of transcriptional
circuits underlying mammalian circadian clocks. Nat Genet
2005, 37:187-192.
40. Mischoulon D, Rana B, Bucher NL, Farmer SR: Growth-dependent
inhibition of CCAAT enhancer-binding protein (C/EBP
alpha) gene expression during hepatocyte proliferation in
the regenerating liver and in culture. Mol Cell Biol 1992,
12:2553-2560.
41. Harris VK, Coticchia CM, Kagan BL, Ahmad S, Wellstein A, Riegel AT:
Induction of the angiogenic modulator fibroblast growth fac-
tor-binding protein by epidermal growth factor is mediated
through both MEK/ERK and p38 signal transduction
pathways. J Biol Chem 2000, 275:10802-10811.
42. Gery S, Gombart AF, Yi WS, Koeffler C, Hofmann WK, Koeffler HP:
Transcription profiling of C/EBP targets identifies Per2 as a
gene implicated in myeloid leukemia. Blood 2005,
106:2827-2836.
43. Gutacker C, Klock G, Diel P, Koch-Brandt C: Nerve growth factor
and epidermal growth factor stimulate clusterin gene
expression in PC12 cells. Biochem J 1999, 339:759-766.
44. Sanchez A, Pagan R, Alvarez AM, Roncero C, Vilaro S, Benito M, Fab-
regat I: Transforming growth factor-beta (TGF-beta) and
EGF promote cord-like structures that indicate terminal dif-
ferentiation of fetal hepatocytes in primary culture. Exp Cell
Res 1998, 242:27-37.
45. Herdegen T, Leah JD: Inducible and constitutive transcription
factors in the mammalian nervous system: Control of gene
expression by jun, fos and krox, and CREB/ATF proteins.
Brain Res Brain Res Rev 1998, 28:370-490.
46. Widnell KL, Russell DS, Nestler EJ: Regulation of expression of
cAMP response element-binding protein in the locus coeru-
leus in vivo and in a locus coeruleus-like cell line in vitro. Proc
Natl Acad Sci USA 1994, 91:10947-10951.
47. Zhu Z, Pilpel Y, Church GM: Computational identification of
transcription factor binding sites via a transcription-factor-
centric clustering (TFCC) algorithm. J Mol Biol 2002,
318:71-81.
48. Zak DE, Vadigepalli R, Gonye GE, Doyle FJ 3rd, Schwaber JS, Ogun-
naike BA: Unconventional systems analysis problems in
molecular biology: A case study in gene regulatory network
modeling. Comput Chem Eng 2005, 29:547-563.
49. Covarrubias MY, Khan RL, Vadigepalli R, Hoek JB, Schwaber JS:
Chronic alcohol exposure alters transcription broadly in a
key integrative brain nucleus for homeostasis: The nucleus
tractus solitarius. Physiol Genomics 2005, 24:45-58.
50. Kholodenko BN, Demin OV, Moehren G, Hoek JB: Quantification
of short term signaling by the epidermal growth factor
receptor. J Biol Chem 1999, 274:30169-30181.
51. Terlau H, Seifert W: Influence of epidermal growth factor on
long-term potentiation in the hippocampal slice. Brain Res
1989, 484:352-356.
52. Raineteau O, Rietschin L, Gradwohl G, Guillemot F, Gahwiler BH:
Neurogenesis in hippocampal slice cultures. Mol Cell Neurosci
2004, 26:241-250.
53. Wolfinger RD, Gibson G, Wolfinger ED, Bennett L, Hamadeh H,
Bushel P, Afshari C, Paules RS: Assessing gene significance from
cDNA microarray expression data via mixed models. J Com-
put Biol 2001, 8:625-637.
54. Warren L, Liu B: Comparison of normalization methods for
cDNA microarrays. In Methods of Microarray Data Analysis III edi-
tion. Edited by: Johnson KF, Lin SM. Boston: Kluwer Academic
Publisher; 2003:105-121.
55. Ihaka R, Gentlemen R: R: A language for data analysis and
graphics. J Comp Graph Stat 1996, 5:299-314.
56. Li H, Wood CL, Getchell TV, Getchell ML, Stromberg AJ: Analysis
of oligonucleotide array experiments with repeated meas-
ures using mixed models. BMC Bioinformatics 2004, 5:209.
57. Ucker DS, Yamamoto KR: Early events in the stimulation of
mammary tumor virus RNA synthesis by glucocorticoids.
Novel assays of transcription rates. J Biol Chem 1984,
259:7416-7420.
58. Hargrove JL: Kinetic Modeling of Gene Expression Austin, Texas: RG
Genome Biology 2006, Volume 7, Issue 6, Article R48 Zak et al. R48.15
comment reviews reports refereed researchdeposited research interactions information
Genome Biology 2006, 7:R48
Landes Co; 1994.
59. Benjamini Y, Hochberg Y: Controlling the false discovery rate -
a practical and powerful approach to multiple testing. J Royal
Stat Soc B 1995, 57:289-300.
60. Pfaffl MW: A new mathematical model for relative quantifica-
tion in real-time RT-PCR. Nucleic Acids Res 2001, 29:e45.
61. Tichopad A, Dilger M, Schwarz G, Pfaffl MW: Standardized deter-
mination of real-time PCR efficiency from a single reaction
set-up. Nucleic Acids Res 2003, 31:e122.
62. Eisen MB, Spellman PT, Brown PO, Botstein D: Cluster analysis
and display of genome-wide expression patterns. Proc Natl
Acad Sci USA 1998, 95:14863-14868.
63. Maity A, Pore N, Lee J, Solomon D, O'Rourke DM: Epidermal
growth factor receptor transcriptionally up-regulates vascu-
lar endothelial growth factor expression in human glioblast-
oma cells via a pathway involving phosphatidylinositol 3'-
kinase and distinct from that induced by hypoxia. Cancer Res
2000, 60:5879-5886.
64. Mathur RS, Mathur SP: Vascular endothelial growth factor
(VEGF) up-regulates epidermal growth factor receptor
(EGF-R) in cervical cancer in vitro: This action is mediated
through HPV-E6 in HPV-positive cancers. Gynecol Oncol 2005,
97:206-213.
65. Doi J, Takemori H, Ohta M, Nonaka Y, Okamoto M: Differential
regulation of 3beta-hydroxysteroid dehydrogenase type II
and 17alpha-hydroxylase/lyase P450 in human adrenocorti-
cal carcinoma cells by epidermal growth factor and basic
fibroblast growth factor. J Endocrinol 2001, 168:87-94.
66. Zhang H, Cicchetti G, Onda H, Koon HB, Asrican K, Bajraszewski N,
Vazquez F, Carpenter CL, Kwiatkowski DJ: Loss of Tsc1/Tsc2 acti-
vates mTOR and disrupts PI3K-akt signaling through down-
regulation of PDGFR. J Clin Invest 2003, 112:1223-1233.
67. Wu EH, Wong YH: Involvement of G i/o proteins in nerve
growth factor-stimulated phosphorylation and degradation
of tuberin in PC-12 cells and cortical neurons. Mol Pharmacol
2005, 67:1195-1205.
68. Huang XL, Pawliczak R, Cowan MJ, Gladwin MT, Madara P, Logun C,
Shelhamer JH: Epidermal growth factor induces p11 gene and
protein expression and down-regulates calcium ionophore-
induced arachidonic acid release in human epithelial cells. J
Biol Chem 2002, 277:38431-38440.
69. Oguri T, Nemoto K, Bansal P, Wipf P, Lazo JS: Induction of Cdc25B
expression by epidermal growth factor and transforming
growth factor-alpha. Biochem Pharmacol 2004, 68:2221-2227.
70. Kim MJ, Jo DG, Hong GS, Kim BJ, Lai M, Cho DH, Kim KW, Bandyo-
padhyay A, Hong YM, Kim do H, et al.: Calpain-dependent
cleavage of cain/cabin1 activates calcineurin to mediate cal-
cium-triggered cell death. Proc Natl Acad Sci USA 2002,
99:9870-9875.
71. Sugimoto T, Stewart S, Guan KL: The calcium/calmodulin-
dependent protein phosphatase calcineurin is the major elk-
1 phosphatase. J Biol Chem 1997, 272:29415-29418.
72. Pusl T, Wu JJ, Zimmerman TL, Zhang L, Ehrlich BE, Berchtold MW,
Hoek JB, Karpen SJ, Nathanson MH, Bennett AM: Epidermal
growth factor-mediated activation of the ETS domain tran-
scription factor elk-1 requires nuclear calcium. J Biol Chem
2002, 277:27517-27527.
73. Gong Q, Pitas RE: Synergistic effects of growth factors on the
regulation of smooth muscle cell scavenger receptor
activity. J Biol Chem 1995, 270:21672-21678.
74. Chu TM, Weir B, Wolfinger R: A systematic statistical linear
modeling approach to oligonucleotide array experiments.
Math Biosci 2002, 176:35-51.
75. Zak DE, Gonye GE, Schwaber JS, Doyle FJ 3rd: Importance of
input perturbations and stochastic gene expression in the
reverse engineering of genetic regulatory networks: Insights
from an identifiability analysis of an in silico network. Genome
Res 2003, 13:2396-2405.
76. Oehlert GW: A First Course in Design and Analysis of Experiments New
York: WH Freeman; 2000.
77. Tavazoie S, Hughes JD, Campbell MJ, Cho RJ, Church GM: System-
atic determination of genetic network architecture. Nat
Genet 1999, 22:281-285.
78. Jakt LM, Cao L, Cheah KS, Smith DK: Assessing clusters and
motifs from gene expression data. Genome Res 2001,
11:112-123.
79. Karolchik D, Baertsch R, Diekhans M, Furey TS, Hinrichs A, Lu YT,
Roskin KM, Schwartz M, Sugnet CW, Thomas DJ, et al.: The UCSC
genome browser database. Nucleic Acids Res 2003, 31:51-54.
80. Elkon R, Linhart C, Sharan R, Shamir R, Shiloh Y: Genome-wide in
silico identification of transcriptional regulators controlling
the cell cycle in human cells. Genome Res 2003, 13:773-780.
81. Addya S, Keller MA, Delgrosso K, Ponte CM, Vadigepalli R, Gonye
GE, Surrey S: Erythroid-induced commitment of K562 cells
results in clusters of differentially expressed genes enriched
for specific transcription regulatory elements. Physiol Genomics
2004, 19:117-130.
82. Kel AE, Gossling E, Reuter I, Cheremushkin E, Kel-Margoulis OV,
Wingender E: MATCH: A tool for searching transcription fac-
tor binding sites in DNA sequences. Nucleic Acids Res 2003,
31:3576-3579.
83. Diehn M, Sherlock G, Binkley G, Jin H, Matese JC, Hernandez-Bous-
sard T, Rees CA, Cherry JM, Botstein D, Brown PO, et al.: SOURCE:
A unified genomic resource of functional annotations, ontol-
ogies, and gene expression data. Nucleic Acids Res 2003,
31:219-223.
84. Harbison CT, Gordon DB, Lee TI, Rinaldi NJ, Macisaac KD, Danford
TW, Hannett NM, Tagne JB, Reynolds DB, Yoo J, et al.: Transcrip-
tional regulatory code of a eukaryotic genome. Nature 2004,
431:99-104.
85. Kerr MK: Linear models for microarray data analysis: Hidden
similarities and differences. J Comput Biol 2003, 10:891-901.
86. Pritchard CC, Hsu L, Delrow J, Nelson PS: Project normal: Defin-
ing normal variance in mouse gene expression. Proc Natl Acad
Sci USA 2001, 98:13266-13271.
87. Chun JT, Crispino M, Tocco G: The dual response of protein
kinase fyn to neural trauma: Early induction in neurons and
delayed induction in reactive astrocytes. Exp Neurol 2004,
185:109-119.