Báo cáo y học: "Co-evolution of transcription factors and their targets depends on mode of regulation" docx
Bạn đang xem bản rút gọn của tài liệu. Xem và tải ngay bản đầy đủ của tài liệu tại đây (402.5 KB, 11 trang )
Genome Biology 2006, 7:R62
comment reviews reports deposited research refereed research interactions information
Open Access
2006Hershberg and MargalitVolume 7, Issue 7, Article R62
Research
Co-evolution of transcription factors and their targets depends on
mode of regulation
Ruth Hershberg and Hanah Margalit
Address: Department of Molecular Genetics and Biotechnology, Faculty of Medicine, The Hebrew University of Jerusalem, Jerusalem 91120,
Israel.
Correspondence: Hanah Margalit. Email:
© 2006 Hershberg and Margalit; licensee BioMed Central Ltd.
This is an open access article distributed under the terms of the Creative Commons Attribution License ( which
permits unrestricted use, distribution, and reproduction in any medium, provided the original work is properly cited.
Co-evolution of transcription factors and targets<p>Analysis of transcription regulatory networks in γ-proteobacteria reveals that repressors co-evolve tightly with their target genes, whereas activators can be lost independently of their targets.</p>
Abstract
Background: Differences in the transcription regulation network are at the root of much of the
phenotypic variation observed among organisms. These differences may be achieved either by
changing the repertoire of regulators and/or their targets, or by rewiring the network. Following
these changes and studying their logic is crucial for understanding the evolution of regulatory
networks.
Results: We use the well characterized transcription regulatory network of Escherichia coli K12
and follow the evolutionary changes in the repertoire of regulators and their targets across a large
number of fully sequenced γ-proteobacteria. By focusing on close relatives of E. coli K12, we study
the dynamics of the evolution of transcription regulation across a relatively short evolutionary
timescale. We show significant differences in the evolution of repressors and activators. Repressors
are only lost from a genome once their targets have themselves been lost, or once the network
has significantly rewired. In contrast, activators are often lost even when their targets remain in the
genome. As a result, E. coli K12 repressors that regulate many targets are rarely absent from
organisms that are closely related to E. coli K12, while activators with a similar number of targets
are often absent in these organisms.
Conclusion: We demonstrate that the mode of regulation exerted by transcription factors has a
strong effect on their evolution. Repressors co-evolve tightly with their target genes. In contrast,
activators can be lost independently of their targets. In fact, loss of an activator can lead to efficient
shutdown of an unnecessary pathway.
Background
The evolution of gene expression regulation plays an impor-
tant role in the generation of phenotypic diversity. Organisms
that share similar gene sequences may be phenotypically very
divergent due to differences in regulation [1,2]. Gene expres-
sion is regulated at many different levels, among which the
regulation of transcription initiation is prominent [3]. Initia-
tion of transcription is regulated by transcription factors
(TFs), which bind sequences within the promoters of their
target genes and either activate or repress their transcription
[4]. The combination of TFs and targets creates a complex
network of regulatory interactions, termed the transcription
Published: 19 July 2006
Genome Biology 2006, 7:R62 (doi:10.1186/gb-2006-7-7-r62)
Received: 7 March 2006
Revised: 30 May 2006
Accepted: 13 July 2006
The electronic version of this article is the complete one and can be
found online at />R62.2 Genome Biology 2006, Volume 7, Issue 7, Article R62 Hershberg and Margalit />Genome Biology 2006, 7:R62
regulation network (TRN). The nodes in this network are
genes encoding TFs and target genes of TFs, and the edges are
the regulatory interactions, pointing from TFs to their targets.
The TRN evolves through two parallel processes [5-8]: the
first process involves changing the regulatory interactions
between TFs and targets, which can be described as rewiring
of the network; and the second process involves the change in
the repertoire of TFs and their targets, which can be described
as the removal of nodes from the network and/or the addition
of new nodes (Figure 1). In this paper we use the well charac-
terized TRN of Escherichia coli K12 [9] as a reference, and
compare all the genes within this network to the gene reper-
toires of many fully sequenced genomes of bacteria belonging
to the same class as E. coli K12 (γ-proteobacteria). By focusing
on bacteria that are relatively closely related to our reference
organism we gain interesting insights regarding the dynamics
of the evolution of transcription regulation, and demonstrate
remarkable differences in the way in which the repertoires of
activators and repressors evolve.
Results and discussion
Comparison of gene repertoires in TRNs of various
organisms
To learn about the evolution of transcription regulation, we
focused on the changes that occur in the gene repertoire of the
TRN. We used the well characterized TRN of E. coli K12 [9]
and examined which of the genes from this TRN (genes
encoding TFs and target genes of TFs) are present in each of
30 fully sequenced bacteria (supplementary Table 1 in Addi-
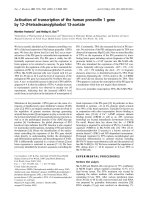
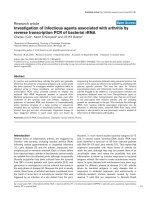
Schematic representation of the two parallel pathways by which the TRN evolvesFigure 1
Schematic representation of the two parallel pathways by which the TRN evolves. Changes in the network may be achieved by removal or addition of TFs
and/or targets, by rewiring of the network, or by both mechanisms.
TRN organism A
Changes in the repertoire of
TFs and targets in organism B
Rewiring the interactions within
the TRN of organism
B
T
RN
o
r
g
an
i
s
m
A
C
ha
n
g
es
in
t
h
e
re
p
er
t
o
i
r
e
o
f
TF
s
a
n
d
t
a
rg
e
t
s
in
orga
n
i
s
m
B
R
e
w
i
r
i
n
g
t
h
e
i
n
t
e
rac
t
ion
s
w
i
t
h
i
n
t
h
e
T
RN
o
f
or
g
anism
B
Genome Biology 2006, Volume 7, Issue 7, Article R62 Hershberg and Margalit R62.3
comment reviews reports refereed researchdeposited research interactions information
Genome Biology 2006, 7:R62
tional data file 1). All these bacteria belong to the γ-proteobac-
teria, as does E. coli K12. By focusing on such a short
evolutionary timescale, we gain insight into the dynamics of
the evolution of the TRN, which is different from the insight
that can be reached by looking at more distantly related
organisms [10]. The bacteria we examined can be further
divided into two equally sized groups based on their evolu-
tionary distance from E. coli K12: the first group contains
organisms that, like E. coli K12, belong to the Enterobacte-
riaceae family; and the second group contains bacteria that
belong to the same class as E. coli K12 (γ-proteobacteria), but
are more distant relatives of E. coli K12 and do not belong to
the Enterobacteriaceae family. We divided the TFs from the
TRN of E. coli K12 into three groups based on their presence
in the other organisms (see Materials and methods): the first
group included those TFs that are present in all the examined
organisms ('widely present'); the second group included
those TFs that are present in all Enterobacteriaceae, but are
absent from some of the more distantly related non-Entero-
bacteriaceae ('entero-present'); and the third group included
those TFs that are already absent in some of the more closely
related Enterobacteriaceae genomes ('entero-absent').
Repressors with many targets are more conserved
than activators with many targets
Only 13 of the 143 TFs examined (9.1%) were found to be
'widely present', similar to the fraction of 'widely present'
genes in the genome of E. coli K12, which is 11.5%. Fitting
with the conjecture that TFs that affect more cellular func-
tions should be more conserved, we find that out of the 13 TFs
that are 'widely present', nine were previously classified in E.
coli K12 as global regulators of transcription, or as regulators
that are located at the top of the TRN hierarchy and, there-
fore, affect several different biological processes [9,11]. In E.
coli K12 the 13 'widely present' TFs have, on average, a signif-
icantly higher number of targets than the 'entero-present'
TFs. These, in turn, have, on average, a higher number of tar-
gets than the 'entero-absent' TFs (p ≤ 0.03 for both compari-
sons by one-tailed Mann-Whitney tests; Table 1). Thus, it
seems that the more targets a TF has, the wider is the range of
organisms in which it is conserved. However, when dividing
the regulatory interactions based on mode of regulation into
positive and negative, a remarkable result is found: while
'entero-present' TFs repress, on average, a significantly
higher number of targets than the 'entero-absent' TFs (p ≤ 1.7
× 10
-4
), the number of targets they activate is not significantly
higher than the number of targets activated by the 'entero-
absent' TFs (p ≤ 0.35; Table 1).
To further investigate this phenomenon, we looked separately
at TFs with a small number of targets (≤5 targets) and TFs
with a large number of targets (>5 targets) (Table 2). We show
that for TFs that regulate a small number of targets there is no
significant difference in the presence range of activators,
repressors and dual regulators; regardless of the mode of reg-
ulation, about half of these TFs are 'entero-present', while the
remaining half are 'entero-absent'. Only two of the TFs that
regulate a small number of targets are 'widely present'. This
picture changes when examining TFs that regulate more than
five targets. Even though the number of repressors and acti-
vators that regulate over five targets is rather small, a differ-
ence can be observed in their presence range (Table 2). Both
repressors and activators are rarely 'widely present'. How-
ever, whereas the repressors are maintained in closely related
bacteria and only 32% of them are 'entero-absent', 72% of the
activators are 'entero-absent' (absent from at least two of the
Enterobacteriaceae). This difference in the distribution of
activators and repressors between the 'entero-present' and
'entero-absent' groups is statistically significant (p ≤ 6 × 10
-3
,
by a χ
2
test). The dual regulators behave similarly to the
repressors. However, as many of the global regulators belong
to this group, members of this group are more often 'widely
present'.
Why are repressors that regulate many targets less likely than
activators with many targets to be absent from close relatives
of E. coli K12? This may be due to the different outcomes of
losing a repressor or an activator. In eukaryotes the transcrip-
tional ground state is restrictive [12], due to the influence of
chromatin structure on the transcription of genes. Hence, in
eukaryotes most genes will not be expressed in the absence of
an activator TF. In contrast, in prokaryotes the transcrip-
tional ground state is non-restrictive and genes will normally
be transcribed unless they are repressed [12]. It was argued
that most of the promoters that are regulated by activators are
intrinsically relatively weak [12]. Thus, the loss of an activator
Table 1
Average number of targets of transcription factors classified based on conservation range
Type of targets Entero-absent TFs Entero-present TFs Widely present TFs*
All targets
†
6.7 ± 8.9 13.9 ± 23.5 66.6 ± 85.2
Repressed targets 1.4 ± 2.6 6.2 ± 11.5 16.6 ± 17.8
Activated targets 5.1 ± 9 6.7 ± 12.8 42.3 ± 62.2
*The large standard deviations are due to several global TFs that regulate hundreds of targets.
†
Total targets, including repressed targets, activated
targets anddually regulated targets.
R62.4 Genome Biology 2006, Volume 7, Issue 7, Article R62 Hershberg and Margalit />Genome Biology 2006, 7:R62
will often result in a partial or total loss of function of its tar-
get genes. In cases in which this is detrimental to fitness, the
bacteria that lost the TF would be removed from the popula-
tion by selection. However, in other cases the loss of an acti-
vator may enhance fitness; if a pathway is no longer needed,
losing the TF that activates that pathway may instantaneously
shut down the pathway while conserving the energy that
would have otherwise been spent on transcribing the genes
responsible for that pathway. On the other hand, because of
the non-restrictive transcriptional ground state, the loss of a
repressor might lead to constitutive expression of its target
genes, resulting almost always in a reduction in fitness. This
conjecture implies that the loss of a repressor must be pre-
ceded by the loss of its targets or their rewiring, while this is
less crucial when losing an activator. Thus, we next turned to
examine the relationship between the status of a TF (absent/
present) and the status of its targets.
Repressors, more than activators, are rarely lost while
their targets remain in the genome
We looked at all of the regulatory interactions in E. coli K12,
and divided them, based on mode of regulation, into 1,288
positive and 722 negative regulatory interactions. For each
mode of regulation in each of the 30 organisms, we created a
contingency table of size 2 × 2 that includes the counts of reg-
ulatory interactions classified by the status of both TFs and
targets (absent/present) (see Materials and methods; Figure
2a). Using the χ
2
test we evaluated for each of the contingency
tables whether the association between the status of the tar-
gets and the status of the TFs is statistically significant. We
also calculated the strength of this association by calculating
the phi-coefficient (see Materials and methods). The values
contained in all 60 contingency tables and their correspond-
ing χ
2
p values and phi-coefficients are listed in the supple-
mentary Table 2 in Additional data file 1. In the
Table 2
Presence of E. coli K12 transcription factors in close and remote relatives
TF type In E. coli K12 Entero-absent* Entero- present
†
Widely present
‡
All TFs 143 65 (45.5%) 65 (45.5%) 13 (9%)
TFs that regulate ≤ 5 targets
All 71 34 (48%) 35 (49%) 2 (3%)
Activators 39 22 (56%) 16 (41%) 1 (3%)
Repressors 27 11 (41%) 15 (56%) 1 (3%)
Dual regulators 5 1 (20%) 4 (80%) 0 (0%)
TFs that regulate >5 targets
All 72 31 (43%) 30 (42%) 11 (15%)
Activators
§
29 21 (72%) 7 (24%) 1 (4%)
Repressors
¶
22 7 (32%) 13 (59%) 2 (9%)
Dual regulators
¥
21 3 (14%) 10 (48%) 8 (38%)
*Absent from Enterobacteriaceae.
†
Present in Enterobacteriaceae but absent from other γ-proteobacteria.
‡
Present in most γ-proteobacteria.
§
TFs are
included in this group if they activate more than five targets. If the same TF also represses targets (dual regulator), it is included in this group only if
the number of targets it activates is more than twice the number of repressed targets, and if the number of repressed targets is not larger than five.
¶
TFs are included in this group if they repress more than five targets. If the TF is a dual regulator, it is included in this group only if the number of
targets it represses is more than twice the number of activated targets, and if the number of activated targets is not larger than five.
¥
TFs are
included in this group if they regulate more than five genes but cannot be assigned to the previous two groups.
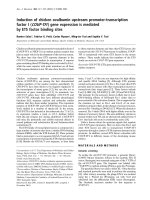
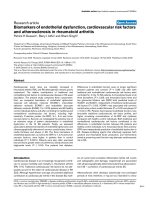
Association between the status of TFs and targetsFigure 2 (see following page)
Association between the status of TFs and targets. (a) Contingency tables of the presence or absence of TFs and their targets in S. flexneri 2457T for both
positive and negative regulatory interactions. The significance of the associations was calculated using the χ
2
test. The association is stronger for negative
regulatory interactions than it is for positive regulatory interactions. In a far larger fraction of positive than negative regulatory interactions, the TF is
absent while the targets remain in the genome. (b) The strength of association between the presence or absence of TFs and that of their targets, as
determined by the phi-coefficient. The association is stronger in bacteria closer to E. coli K12 than in more remote bacteria for both positive and negative
regulatory interactions. In closely related bacteria, negative regulatory interactions (phi-coefficients represented by red bars) show stronger association
than positive regulatory interactions (phi-coefficients represented by green bars). The values contained in the 60 contingency tables for all organisms in our
study and their corresponding p values and phi-coefficients are listed in supplementary Table 2 in Additional data file 1.
Genome Biology 2006, Volume 7, Issue 7, Article R62 Hershberg and Margalit R62.5
comment reviews reports refereed researchdeposited research interactions information
Genome Biology 2006, 7:R62
Figure 2 (see legend on previous page)
(a)
(b)
-0.05
0
0.05
0.1
0.15
0.2
0.25
0.3
0.35
0.4
0.45
0.5
0.55
0.6
0.65
0.7
0.75
E. coli O157 edl
E. coli O157
E. coli cft073
S. flexneri 2457t
S. flexneri 2a
S. paratyphi
S. typhimurium
S. typhi
S. typhi Ty2
Y. pestis CO92
Y. pestis KIM
Y. pestis Med
Y. pseudotuberculosis
E. carotovora
P. luminescens
V. cholearae
V. fischeri
V. parahaemolyticus
V. vulnificus_CMCP6
P. profundum
P. aeruginosa
P. fluorescens
P. putida
P. syringe
S. oneidensis
H. influenzae
H. ducreyi
X. campestris
X. citri
X. oryzae
Organism
Phi-coefficient
j
Enterobacteriaceae non-Enterobacteriaceae
12881106182
11531000153
1351062
9
12881106182
11531000153
13510629
TF
Abs Pres
Target
Total
Abs
Pres
Total
72264478
69063555
3292
3
72264478
69063555
3292
3
Abs Pres
Target
Total
Shigella flexneri 2457T
Positive interactions
Negative interactions
p = 9.6e-3, phi=0.07 p = 5e-30, phi=0.42
f
11
f
12
f
21
f
22
R
1
R
2
C
1
C
2
f
11
f
12
f
21
f
22
R
1
R
2
C
1
C
2
R62.6 Genome Biology 2006, Volume 7, Issue 7, Article R62 Hershberg and Margalit />Genome Biology 2006, 7:R62
Enterobacteriaceae, which are more closely related to E. coli
K12, we find for both positive and negative regulatory interac-
tions that there is always a statistically significant association
between the status of the TFs and the status of their targets (p
values of the χ
2
tests range between 1.2e-79 and 9.6e-3). In all
cases, the probability that a TF is absent when its targets are
still present is lower than its probability to be absent when its
targets are also absent. Yet, it is striking that in all of the 15
Enterobacteriaceae the phi-coefficient is higher for negative
interactions than it is for positive interactions (Figure 2b).
Thus, the association between the presence or absence of the
TFs and their targets is weaker for positive regulatory interac-
tions than it is for negative regulatory interactions. One rea-
son for the differences found in the strength of association is
that, in the Enterobacteriaceae, the probability for a TF to be
absent while its target is maintained in the genome is higher
for positive regulatory interactions than it is for negative reg-
ulatory interactions (supplementary Figure 1a in Additional
data file 1). This is especially remarkable in the two Shigella
flexneri strains. In the 2457T strain of S. felxnari (Figure 2a),
the probability of a TF to be absent given that its target is
present is 0.1 for positive regulatory interactions and only
0.01 for negative interactions. On the other hand, the proba-
bility of a target to be present given that its TF is absent is 0.79
for positive regulatory interactions and only 0.28 for negative
interactions. Thus, positively regulating TFs are more likely
than negatively regulating TFs to be lost from a genome, while
their targets are maintained. This supports our conjecture
that negatively regulated targets, but not positively regulated
targets, need to be removed prior to the removal of their reg-
ulating TF.
An additional factor that affects the association between the
status of TFs and that of their targets is the probability of a
target to be absent while its TF is present in the genome. This
probability is higher for positive regulatory interactions than
it is for negative regulatory interactions (supplementary Fig-
ure 2a in Additional data file 1). We found that this trend,
which is observed in both the Enterobacteriaceae and non-
Enterobacteriaceae, is caused to a large extent by regulatory
interactions that involve global regulators. Global regulators
tend to be well conserved and regulate a large number of tar-
gets. In addition, they regulate several different biological
processes. If a certain function that is regulated by a global
regulator is no longer needed, the genes encoding that func-
tion may be lost. However, the global regulator may still be
needed, as it regulates additional functions. Therefore, we
expect to see many cases in which a global regulator is con-
served while its target is absent. There are more positive than
negative regulatory interactions involving global regulators in
our dataset (720 and 318 interactions, respectively), which
may account for the enhanced probability of an activated tar-
get to be absent while its TF remains in the genome. Once the
regulatory interactions involving the 15 known global regula-
tors of E. coli are removed from our analysis this enhanced
probability is no longer consistent (supplementary Figure 2b
in Additional data file 1). At the same time the probability of
activators to be absent while their targets are present in the
genome remains consistently higher than that of repressors
and this trend is even enhanced (supplementary Figure 1b in
Additional data file 1).
In the non-Enterobacteriaceae genomes, which are more dis-
tantly related to E. coli K12, we find that the association
observed between the absence or presence of the TFs and that
of their targets is weaker than that observed in the more
closely related organisms. A significant association was found
for only 11 of the 15 non-Enterobacteriaceae when consider-
ing either positive or negative regulatory interactions. In the
cases in which a statistically significant association was
found, the p values for the association were generally higher
than those found in the Enterobacteriaceae (p values range
between 2.6e-11 and 0.031), while the phi-coefficients were
generally lower (Figure 2b; supplementary Table 2 in Addi-
tional data file 1). This indicates that, in these organisms, the
association between the status of the targets and the status of
the TFs is less strong. In addition, in some of the organisms
that are more distantly related to E. coli K12, the probability
of an activator to be absent from the genome while its target
is present is no longer higher than that of a repressor (supple-
mentary Figure 1 in Additional data file 1). This may be
explained by the fact that the evolution of the TRN is achieved
not only through changes in the repertoire of TFs and targets,
but also through the rewiring of the interactions between TFs
and targets (Figure 1). With the passing of time both types of
changes accumulate in the TRN. It is likely, therefore, that in
the distantly related organisms more targets have alternative
regulation. These targets are not regulated by the same TF
that regulates them in E. coli K12, and, therefore, their
absence or presence should not affect the likelihood that that
TF will be absent. Thus, the weak associations we find
between the status of the TFs and targets in the non-Entero-
bacteriaceae, compared to Enterobacteriaceae, suggest that
the TRNs of E. coli K12 and these organisms are, to a large
extent, wired differently.
Shutting down a pathway by loss of an activator
We have shown in close relatives of E. coli K12 that activators
are more likely than repressors to be lost while their targets
remain in the genome. In fact, the loss of an activator may
serve as an efficient means for shutting down an unnecessary
pathway. As an example of this we discuss the shutdown of
the flagella pathway in non-motile Enterobacteriaceae. The
motility of bacteria such as E. coli and some of its relatives is
mediated by peritrichous flagella [13]. The flagellar genes are
expressed in a well controlled hierarchy, at the apex of which
stands the master regulator FlhDC, a complex of two proteins,
FlhC and FlhD. The FlhDC complex directly activates the
transcription of seven operons, containing 34 genes. One of
the genes activated by FlhDC is fliA, encoding the activator
FliA that in turn activates additional flagellar genes (Figure
3). This pathway is conserved in all Enterobacteriaceae that
Genome Biology 2006, Volume 7, Issue 7, Article R62 Hershberg and Margalit R62.7
comment reviews reports refereed researchdeposited research interactions information
Genome Biology 2006, 7:R62
grow flagella (supplementary Table 1 in Additional data file
1). The crucial role of FlhDC as a major regulator of the flag-
ellar biosynthesis pathway was substantiated experimentally,
as it has been shown that flhD knockout mutants are incapa-
ble of growing flagella [14]. Interestingly, in both strains of S.
flexneri and in the three strains of Yersinia pestis, all of which
do not grow flagella and are not motile, the FlhDC regulator
is not active due to the loss of subunit FlhD, caused by a muta-
tion in the gene encoding it (Figure 3). The S. flexneri strains
as well as the Y. pestis strains have very close relatives that do
grow flagella and for which FlhDC remains intact. The natural
knockout mutations in flhD are different in the two S. flexneri
strains from those in the three Yersinia strains, indicating the
occurrence of two separate mutation events. in the case of Y.
pestis an insertion of a single base has occurred, relative to
the closely related Yersinia pseudotuberculosis sequence.
This insertion resulted in a premature stop-codon being
introduced into the sequence. In the two S. flexneri strains,
the loss of flhD was caused by an insertion element, which
deleted the first 133 bases of the gene. In a recent analysis
Tominaga et al. [14] sequenced the flhDC locus of 46 non-
motile Shigella strains. They showed that most of these
strains carry non-functional copies of their flhDC genes, and
that different strains show different mutations. In the two S.
flexneri strains we examined, in addition to the mutation that
caused the loss of FlhDC, there has also occurred a mutation
causing the loss of the secondary activator FliA. Strikingly, in
both S. flexneri and Y. pestis, most of the flagellar genes,
which in E. coli K12 are regulated by FlhDC, remained intact.
This, together with the observation that the flhDC locus has
repeatedly undergone natural knockout mutations in several
non-motile Enterobacteriaceae, highlights the high efficiency
that is achieved by shutting down the pathway at the level of
the major regulator, saving the need to knockout each target
gene separately. Still, nonsense mutations in the structural
genes accumulate gradually. In S. flexneri strain 301, seven
out of the 34 genes known to be regulated by the FlhDC com-
plex in E. coli underwent nonsense mutations, and their pro-
teins are absent from the translated proteome. The same
seven proteins, as well as three additional proteins, are miss-
ing from the translated proteome of the 2457T strain of S.
flexneri. In the three Y. pestis strains only two to three of the
flagellar proteins regulated by the FlhDC complex in E. coli
are missing from the translated proteome. Interestingly,
other than flhD, no common flagellar genes are missing from
both Y. pestis and S. flexneri.
It is very interesting to note that all of the S. flexneri flagellar
genes that underwent nonsense mutations are still main-
tained in the genome. This includes both the flhD gene and
the fliA gene. Other than flhD, which has been truncated in S.
flexneri and is only conserved along approximately 60% of its
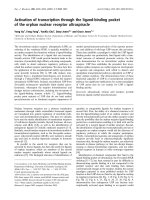
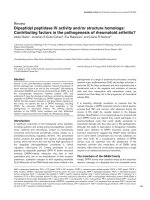
Schematic representation of the flagella biosynthesis regulonFigure 3
Schematic representation of the flagella biosynthesis regulon. In E. coli K12 the master regulator FlhDC activates the transcription of seven operons, one of
which encodes the secondary activator FliA. FliA in turn activates the operons that are regulated by FlhDC, as well as additional operons. Efficient
shutdown of flagella synthesis in the non-motile bacteria S. flexneri and Y. pestis is achieved by the loss of the major activator FlhDC. Nonsense mutations
in genes of the regulated operons are then gradually accumulated.
FlhC
FlhC
FlhD
FlhD
FliA
FliA
FlhC
FlhC
FlhD
FlhD
FliA
FliA
FlhC
FlhC
FlhD
FlhD
FliA
FliA
Shigella
Shigella flexneri
Yersinia
Yersinia pestis
Escherichia coli
Escherichia coli
R62.8 Genome Biology 2006, Volume 7, Issue 7, Article R62 Hershberg and Margalit />Genome Biology 2006, 7:R62
DNA sequence, all the flagellar genes with nonsense muta-
tions have more than 90% sequence identity at the DNA level
with their E. coli K12 counterparts. While S. flexneri is
described in the Bergey's manual of systematic bacteriology
[15] as a non-motile non-flagellated bacterium, Giron et al.
[16] have identified surface appendages resembling flagella in
Shigella. They termed these appendages flash (flagella of
Shigella). Unlike the flagella of E. coli and Salmonella that
emanate peritrichously with an average number of eight, flag-
ellated Shigella produced only one polar flagellum. In addi-
tion, only 1 in 300 to 1,000 Shigella organisms grew flash, a
frequency that is much lower than that observed in E. coli and
Salmonella [16]. In the study of Giron et al., which was con-
ducted before the genome sequence of Shigella became avail-
able, they suggested that their findings may imply that
Shigella does grow flagella and is motile, but the regulation of
the biosynthesis is different. Our findings suggest a different
explanation for the observation that Shigella can grow flag-
ella at low frequencies: it may be possible that the flagellar
genes that are maintained in the Shigella genome along with
the genes encoding the regulator allow a small fraction of the
organisms to revert to a partially flagellated phenotype.
An additional example of the way in which loss of an activator
can lead to the shutting down of an entire pathway is the loss
of the maltose utilization pathway in S. flexneri. In E. coli K12
and its maltose utilizing relatives, the activator MalT induces
the transcription of 10 genes of the maltose utilization
pathway. This activator is absent from S. flexneri. It has been
shown that S. flexneri cannot utilize maltose and that malE,
which is one of the genes regulated by MalT in E. coli K12, is
not expressed in S. flexneri [17,18]. However, the malE gene
and the other nine maltose utilization genes are intact in the
S. flexneri genome. These observations together show that,
similar to the flagellar biosynthesis example, the shutting
down of the maltose utilization pathway was achieved
through the loss of the activator regulating the pathway.
Conclusion
In this study we focused on the evolution of the TRN in a rel-
atively large number of closely related bacteria representing a
short evolutionary timescale. The TRN evolves both by
removing and adding nodes (TFs and/or gene targets) and by
rewiring the connections between the nodes. As evolutionary
distance increases, so does the number of changes observed
between two TRNs: the TRNs of two more distantly related
bacteria would thus show more differences, both in the reper-
toire of their TFs and in the ways in which the TFs and targets
are connected. We show an interesting difference in the way
in which the repertoires of repressors and activators evolve.
In order for a repressor to be removed from the TRN, its tar-
gets need to either acquire alternative regulation through the
rewiring of the network, or be removed themselves. For this
reason, among closely related bacteria we rarely observe the
removal of repressors, especially those that regulate many
targets, and when such changes do occur they are frequently
preceded by the removal of the target genes. In contrast, we
observe changes in the repertoire of activators even among
TRNs of very closely related bacteria. Activators may be lost
as a way of turning off a pathway. In these cases the activator
may be lost prior to the loss of its targets.
Materials and methods
The TRN of E. coli K12
Data on E. coli K12 transcription factors and their target
genes were extracted from Ma et al [9]. This data set includes
regulatory interactions of TFs in E. coli K12, including the
sigma factors RpoS, RpoN, RpoE and RpoH. The sigma fac-
tors were not included in the analysis because they function
as part of the RNA polymerase holoenzyme [3,4], and are not
considered as TFs. Interactions involving RyhB, glnL, Hfq or
UidA as the regulators were also excluded because these mol-
ecules are not TFs [19-22]. In addition, all auto-regulatory
interactions and all regulatory interactions for which the
mode of regulation (positive, negative or dual) is unknown
were also excluded. The resulting data set contains 2,285 reg-
ulatory interactions between 143 TFs and 1,048 target genes
(Additional data file 2).
Of the 143 TFs included in our analysis, 15 have previously
been characterized as global regulators, or as regulators that
are located at the top layers of the hierarchical structure of the
TRN [9,11]. Such TFs are expected to affect several biological
processes and integrate between them. These TFs are: CRP,
IhfA, IhfB, FNR, Hns, ArcA, FIS, LRP, PhoB, ArgP, CspA,
CspE, CytR, SoxR, and DnaA.
The regulatory interactions that were collected by Ma et al.
[9] have since been included in the RegulonDB [23] and Eco-
cyc [24] databases. These regulatory interactions and their
mode of regulation were gathered from publications and were
determined by small-scale experiments.
Determining the presence or absence of genes from E.
coli K12 in other γ-proteobacteria
Gene sequences were extracted from version NC_000913.1 of
the E. coli K12 genome, and annotations of the genes were
extracted from the Ecogene database [25]. The genomic and
protein sequences and the annotations of the 30 genomes in
supplementary Table 1 in Additional data file 1 were down-
loaded from the NCBI ftp server [26]. These 30 organisms can
be divided into two groups, each containing 15 bacteria. The
first group includes bacteria that, like E. coli K12, belong to
the Enterobacteriaceae family. The second group contains
bacteria that are not members of the Enterobacteriaceae fam-
ily, but are included in the same class as E. coli (γ-proteobac-
teria). All amino acid sequences of the proteins encoded in E.
coli K12 were compared to the sequences of the annotated
proteins of each of the 30 organisms, using a locally installed
version of the FASTA program [27]. For each protein we
Genome Biology 2006, Volume 7, Issue 7, Article R62 Hershberg and Margalit R62.9
comment reviews reports refereed researchdeposited research interactions information
Genome Biology 2006, 7:R62
recorded its best hit in each of the 30 organisms and the per-
centage identity across the entire E. coli K12 protein
sequence. At the DNA level, each E. coli K12 protein-coding
gene was compared to the complete genomic sequence of
each of the 30 organisms, and the best hit and percentage
identity were recorded for each organism.
For each gene in E. coli K12 and each organism, we compared
the genomic location of the gene encoding the best hit at the
protein level to the genomic location of the best hit at the DNA
level. If in a certain genome the best hit at the protein level is
located in the same location as the best hit at the DNA level,
we consider the E. coli K12 gene and protein to be present in
that genome. If the location of the protein best hit is different
from that of the DNA best hit, we regard this protein as
present in the genome if the percentage identity at the protein
level is at least 40%.
We expect that for the proteins that are present in the differ-
ent genomes the average percent identity will decrease as the
evolutionary distance from E. coli K12 increases. The percent-
age of E. coli K12 genes that are maintained in a genome can
be used as a measure of the distance of that genome from E.
coli K12. Thus, if our threshold is reasonable, we expect to
find a strong correlation between the average percent identity
and the percentage of the E. coli K12 proteins that we anno-
tated as present in the different organisms. Indeed, the Pear-
son correlation coefficient between the percentage of proteins
that, according to our threshold, are present in the genome
and their average percent identity is 0.97 (supplementary
Table 1 in Additional data file 1). In contrast, the average per-
cent identity of the best hits for the proteins that did not pass
our threshold does not change with the evolutionary distance
from E. coli K12 (Pearson correlation of -0.05; supplementary
Table 1 in Additional data file 1). We therefore conclude that
our threshold allows the separation of those proteins that are
present in a genome from hits that are generated by chance.
Our method is different from the best bidirectional hit
method that is commonly used to assign orthologs across
large evolutionary time scales. We believe that when compar-
ing closely related organisms for assigning a status of absence
or presence to a gene our method is more suitable. However,
to make sure that our results were not strongly affected by our
assignment methodology we compared it to the best bidirec-
tional hit method. We found that when comparing all of the
proteins of E. coli K12 across the 30 organisms examined, the
methods assign the genes differently in less than 4% of the
cases.
Classifying TFs based on their presence in the various
organisms
The TFs of E. coli K12 were classified into three groups based
on their presence across the various organisms. The classifi-
cation criteria and the description of the three groups are
detailed in Figure 4. The procedure used aimed to minimize
misclassifications due to sequencing errors; for example, the
first group of TFs includes those that are present in most
organisms (termed 'widely present'). To limit the effects of
sequencing errors in individual genomes, we did not require
the TF to be present in all organisms in order to be classified
into this group, but required it to appear in at least 14 of the
15 Enterobacteriaceae and in at least 14 of the 15 non-Entero-
bacteriaceae genomes. The classification of the 143 TFs into
the three groups can be found in Additional data file 3.
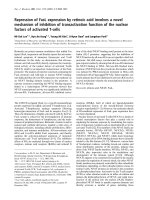
Classifying E. coli K12 transcription factors into three groups based on their conservation across E. coli K12 close and remote relativesFigure 4
Classifying E. coli K12 transcription factors into three groups based on
their conservation across E. coli K12 close and remote relatives. The first
group of TFs includes TFs that appear in most of the 30 bacteria in our
study ('widely present'). A TF was included in this group if it appears in at
least 14 of the 15 Enterobacteriaceae and in at least 14 of the 15 non-
Enterobacteriaceae genomes. The second group includes those TFs that
are present in all closely related Enterobacteriaceae genomes and are
absent only from the more distantly related non-Enterobacteriaceae
organisms ('entero-present'). A TF was classified into this group if it was
present in at least 14 of the 15 Enterobacteriaceae and was absent from
two or more of the 15 non-Enterobacteriaceae. The last group includes
those TFs that are absent from some of the most closely related
Enterobacteriaceae. TFs were classified into this group if they are absent
from at least two of the 15 Enterobacteriaceae ('entero-absent'). For each
of the three groups, five examples of conservation patterns of TFs that
would be classified into that group are illustrated. Yellow and purple boxes
represent presence of a TF in Enterobacteriaceae and non-
Enterobacteriaceae, respectively. Black boxes indicate absence of the TF
from an organism. Each column illustrates an example of presence/absence
pattern that would result in classification of a TF in one of the three
classes.
‘Widely present’
Enterobacteriaceae
Non-
Enterobacteriaceae
‘Entero-present’
‘Entero-absent’
R62.10 Genome Biology 2006, Volume 7, Issue 7, Article R62 Hershberg and Margalit />Genome Biology 2006, 7:R62
Evaluating the association between the status (present/
absent) of the TFs and their targets
Regulatory interactions from E. coli K12 were divided based
on their mode of regulation into positive and negative inter-
actions. For each mode of regulation in each of the 30 organ-
isms a contingency table of size 2 × 2 was created. Each
contingency table contains the number of regulatory interac-
tions in each of the four following categories: both the TF and
its target are present in the genome (TF
pres
, targ
pres
); the TF is
absent but its target is present (TF
abs
, targ
pres
); the TF is
present but its target is absent (TF
pres
, targ
abs
); and both the
TF and its target are absent (TF
abs
, targ
abs
). For each contin-
gency table we carried out a χ
2
test, testing the null hypothesis
that the status of the targets (absent/present) and the status
of the TFs are not associated. Rejection of the null hypothesis
with p ≤ 0.05 implied a statistically significant association.
We also estimated the strength of association by the phi-coef-
ficient. The phi-coefficient is a derivative of the χ
2
test. It is
calculated as:
where f11, f12, f21, and f22 represent the counts appearing in
the four cells of the 2 × 2 contingency tables, C1 and C2 rep-
resent the column sums of the values and R1 and R2 represent
their row sums (Figure 2a).
Phi values can range from -1 to 1. The further the value is from
zero, the stronger the association. Positive values indicate a
positive association, while negative values indicate an inverse
association. Thus, in our case a value of 1 would mean that
there is complete agreement between the status of the TF and
that of its targets. In such a case if the TF is present, all its
targets would be present, and if a TF is absent, all its targets
would be absent. A value of -1 would indicate a negative
association. All the targets of an absent TF would be present
and vice versa.
Our method of assigning orthologous relations depends on
analyzing conservation at both the protein and the DNA lev-
els. For this reason the 95 regulatory interactions in which the
target is an RNA gene (tRNA, rRNA or ncRNA) were not con-
sidered in this analysis. These 95 interactions are marked by
an asterisk in Additional data file 2.
Additional data files
The following additional data are available with the online
version of this paper. Additional data file 1 contains supple-
mentary figures and tables: supplementary Table 1 lists infor-
mation regarding the 30 organisms used in the study;
supplementary Table 2 lists the association between the sta-
tus of TFs and the status of their targets; supplementary Fig-
ure 1 shows the probability of activators and repressors to be
absent in the different genomes, while their targets are
present; supplementary Figure 2 shows the probability of
repressed and activated targets to be absent from the differ-
ent genomes, while their regulating TFs are present. Addi-
tional data file 2 lists the regulatory interactions included in
this study. Additional data file 3 lists the classification of TFs
into three groups based on their presence in the different
organisms.
Additional data file 1Supplementary figures and tablesSupplemetary Table 1 lists information regarding the 30 organisms used in the study. Supplementary Table 2 lists the association between the status of TFs and the status of their targets. Supple-mentary Figure 1 shows the probability of activators and repressors to be absent in the different genomes, while their targets are present. Supplementary Figure 2 shows the probability of repressed and activated targets to be absent from the different genomes, while their regulating TFs are present.Click here for fileAdditional data file 2Regulatory interactions included in this studyRegulatory interactions included in this study.Click here for fileAdditional data file 3Classification of TFs into three groups based on their presence in the different organismsClassification of TFs into three groups based on their presence in the different organisms.Click here for file
Acknowledgements
We are thankful to Esti Yeger-Lotem, Yael Altuvia, Gila Lithwick and Eyal
Akiva for helpful comments on the manuscript and to Norman Grover,
Samuel Sattath, Guy Sella and Dmitri Petrov for stimulating discussions.
This work was supported by the Israeli Science Foundation administered by
the Israeli Academy of Sciences and Humanities. RH is supported by the
Yeshaya Horowitz association through the Center of Complexity Science.
References
1. Carroll SB: Evolution at two levels: on genes and form. PLoS
Biol 2005, 3:e245.
2. Olson MV, Varki A: Sequencing the chimpanzee genome:
insights into human evolution and disease. Nat Rev Genet 2003,
4:20-28.
3. Wagner R: Transcription Regulation in Prokaryotes 1st edition. Oxford:
Oxford University press; 2000.
4. Browning DF, Busby SJ: The regulation of bacterial
transcription initiation. Nat Rev Microbiol 2004, 2:57-65.
5. Ihmels J, Bergmann S, Gerami-Nejad M, Yanai I, McClellan M, Berman
J, Barkai N: Rewiring of the yeast transcriptional network
through the evolution of motif usage. Science 2005,
309:938-940.
6. Gasch AP, Moses AM, Chiang DY, Fraser HB, Berardini M, Eisen MB:
Conservation and evolution of cis-regulatory systems in
ascomycete fungi. PLoS Biol 2004, 2:e398.
7. Tanay A, Regev A, Shamir R: Conservation and evolvability in
regulatory networks: the evolution of ribosomal regulation
in yeast. Proc Natl Acad Sci USA 2005, 102:7203-7208.
8. Teichmann SA, Babu MM: Gene regulatory network growth by
duplication. Nat Genet 2004, 36:492-496.
9. Ma HW, Kumar B, Ditges U, Gunzer F, Buer J, Zeng AP: An
extended transcriptional regulatory network of Escherichia
coli and analysis of its hierarchical structure and network
motifs. Nucleic Acids Res 2004, 32:6643-6649.
10. Madan Babu M, Teichmann SA, Aravind L: Evolutionary dynamics
of prokaryotic transcriptional regulatory networks. J Mol Biol
2006, 358:614-633.
11. Martinez-Antonio A, Collado-Vides J: Identifying global regula-
tors in transcriptional regulatory networks in bacteria. Curr
Opin Microbiol 2003, 6:482-489.
12. Struhl K: Fundamentally different logic of gene regulation in
eukaryotes and prokaryotes.
Cell 1999, 98:1-4.
13. Soutourina OA, Bertin PN: Regulation cascade of flagellar
expression in Gram-negative bacteria. FEMS Microbiol Rev 2003,
27:505-523.
14. Tominaga A, Lan R, Reeves PR: Evolutionary changes of the
flhDC flagellar master operon in Shigella strains. J Bacteriol
2005, 187:4295-4302.
15. Krieg N: Bergey's Manual of Systematic Bacteriology Volume 1. Baltimore:
Williams & Wilkins; 1984.
16. Giron JA: Expression of flagella and motility by Shigella. Mol
Microbiol 1995, 18:63-75.
17. Dahl MK, Manson MD: Interspecific reconstitution of maltose
transport and chemotaxis in Escherichia coli with maltose-
binding protein from various enteric bacteria. J Bacteriol 1985,
164:1057-1063.
18. Jin Q, Yuan Z, Xu J, Wang Y, Shen Y, Lu W, Wang J, Liu H, Yang J,
Yang F, et al.: Genome sequence of Shigella flexneri 2a: insights
into pathogenicity through comparison with genomes of
Escherichia coli K12 and O157. Nucleic Acids Res 2002,
30:4432-4441.
19. Masse E, Gottesman S: A small RNA regulates the expression of
genes involved in iron metabolism in Escherichia coli. Proc Natl
Phi
ff ff
CC RR
=
⋅−⋅
11 22 12 21
1212
Genome Biology 2006, Volume 7, Issue 7, Article R62 Hershberg and Margalit R62.11
comment reviews reports refereed researchdeposited research interactions information
Genome Biology 2006, 7:R62
Acad Sci USA 2002, 99:4620-4625.
20. Atkinson MR, Ninfa AJ: Characterization of Escherichia coli glnL
mutations affecting nitrogen regulation. J Bacteriol 1992,
174:4538-4548.
21. Zhang A, Wassarman KM, Rosenow C, Tjaden BC, Storz G, Gottes-
man S: Global analysis of small RNA and mRNA targets of
Hfq. Mol Microbiol 2003, 50:1111-1124.
22. Beaud D, Tailliez P, Anba-Mondoloni J: Genetic characterization
of the beta-glucuronidase enzyme from a human intestinal
bacterium, Ruminococcus gnavus. Microbiology 2005,
151:2323-2330.
23. Salgado H, Gama-Castro S, Peralta-Gil M, Diaz-Peredo E, Sanchez-
Solano F, Santos-Zavaleta A, Martinez-Flores I, Jimenez-Jacinto V,
Bonavides-Martinez C, Segura-Salazar J, et al.: RegulonDB (version
5.0): Escherichia coli K-12 transcriptional regulatory network,
operon organization, and growth conditions. Nucleic Acids Res
2006, 34:D394-397.
24. Keseler IM, Collado-Vides J, Gama-Castro S, Ingraham J, Paley S,
Paulsen IT, Peralta-Gil M, Karp PD: EcoCyc: a comprehensive
database resource for Escherichia coli. Nucleic Acids Res 2005,
33:D334-337.
25. Rudd KE: EcoGene: a genome sequence database for
Escherichia coli K-12. Nucleic Acids Res 2000, 28:60-64.
26. NCBI ftp Server [ />27. Pearson WR, Lipman DJ: Improved tools for biological sequence
comparison. Proc Natl Acad Sci USA 1988, 85:2444-2448.