the art of scalability scalable web architecture processes and organizations for the modern enterprise phần 6 ppsx
Bạn đang xem bản rút gọn của tài liệu. Xem và tải ngay bản đầy đủ của tài liệu tại đây (6.09 MB, 59 trang )
ptg5994185
270 CHAPTER 17 PERFORMANCE AND STRESS TESTING
Performance and Stress Testing for Scalability
We usually lead off our chapters with the rhetorical question of how a particular pro-
cess could possibly have anything to do with scalability. This time, we’ve waited until
we covered the processes in depth to have this discussion; hopefully, as a result, you
can already start listing the reasons that performance testing and stress testing have a
great place among the multitude of factors that affect scalability. The three areas that
we are going to focus on for exploring the relationship are the headroom, change
control, and managing risk.
As we discussed in Chapter 11, Determining Headroom for Applications, it is crit-
ical to scalability that you know where you are in terms of capacity for a particular
service within your system. This is for you to calculate how much time and growth
you have left to scale. This is fundamental for planning headroom or infrastructure
projects, splitting databases/applications, and making budgets. The way to ensure
your calculations remain accurate is to conduct performance testing on all your
releases to ensure you are not introducing unexpected load increases. It is not uncom-
mon for an organization to implement a maximum load increase allowed per release.
As you start to become more sophisticated in capacity planning, you will come to see
the load added by new features and functionality as a cost that must be accounted for
in the cost/benefit analysis. Additionally, stress testing is necessary to ensure that the
expected breakpoint or degradation curve is still at the same point as previously iden-
tified. It is possible to leave the normal usage load unchanged but decrease the total
load capacity through new code paths or changes in logic. For instance, an increase
in a data structure lookup of 90 milliseconds would likely be unnoticed in total
response time for a user’s request, but if this service is tied synchronously to other
services, as the load builds, hundreds or thousands of 90-millisecond delays adds up
to decrease the peak capacity that services can handle.
When we talk about change management, as defined in Chapter 10, Controlling
Change in Production Environments, we are really discussing more than the lightweight
change identification process for small startup companies, but instead the fuller featured
process by which a company is attempting to actively manage the changes that occur in
their production environment. We defined change management as consisting of the fol-
lowing components: change proposal, change approval, change scheduling, change
implementation and logging, change validation, and change efficacy review. Performance
testing and stress testing augment this change management process by providing a prac-
tice implementation and most importantly a validation of the change. You would never
expect to make a change without verifying that it actually affected the system the way
that you think it should, such as fix a bug or provide a new piece of functionality. As part
of performance and stress testing, we validate the expected results in a controlled envi-
ronment prior to production. This is an additional step in ensuring that when the change
is made in production it will also work as it did during testing under varying loads.
ptg5994185
CONCLUSION 271
The most significant factor that we should consider when relating performance
testing and stress testing to scalability is the management of risk. As outlined in
Chapter 16, Determining Risk, risk management is one the most important processes
when it comes to ensuring your systems will scale. The precursor to risk management
is risk analysis, which attempts to calculate an amount of risk in various actions or
components. Performance testing and stress testing are two methods that can signifi-
cantly decrease the risk associated with a particular service change. For example, if
we were using a failure mode and effects analysis tool and identified a failure mode
of a particular feature to be the increase in query time, the mitigation recommended
could be to test this feature under actual load conditions, as with a performance test,
to determine the actual behavior. This could also be done with extreme load condi-
tions as with a stress test to observe behavior above normal conditions. Both of these
would provide much more information with regard to the actual performance of the
feature and therefore would lower the amount of risk. These two testing processes
are powerful tools when it comes to reducing and thus managing the amount of risk
within the release or the overall system.
From these three areas, headroom, change control, and risk management, we can
see the inherent relationship between successful scalability of your system and the
adoption of the performance and stress testing processes. As we cautioned previously
in the discussion of the stress test, the creation of the test load is not easy, and if done
poorly can lead to erroneous data. However, this does not mean that it is not worth
pursuing the understanding, implementation, and (ultimately) mastery of these
processes.
Conclusion
In this chapter, we discussed in detail the performance testing and stress testing pro-
cesses. We also discussed how these processes related to scalability for the system.
For the performance testing process, we defined a seven-step process. The key to the
process is to be methodical and scientific about the testing.
For the stress testing process, we defined an eight-step process. These were the
basic steps we felt necessary to have a successful process. It was suggested that other
steps be added as necessary for the proper fit within your organization.
We concluded this chapter with a discussion on how performance testing and
stress testing fit with scalability. We concluded that based on the relationship between
these testing processes and three factors (headroom, change control, and risk man-
agement), that have already been established as being causal to scalability, these pro-
cesses too are directly responsible for scalability.
ptg5994185
272 CHAPTER 17 PERFORMANCE AND STRESS TESTING
Key Points
• Performance testing covers a broad range of engineering evaluations where the
emphasis is on the final measurable performance characteristic.
• The goal of performance testing is to identify, document, and where possible
eliminate bottlenecks in the system.
• Load testing is a process used in performance testing.
• Load testing is the process of putting load or user demand on a system in order
to measure its response and stability.
• The purpose of load testing is to verify that the application can meet a desired
performance objective often specified as a service level agreement (SLA).
• Load and performance testing are not substitutes for proper architecture.
• The seven steps of performance testing are as follows:
1. Establish the criteria expected from the application.
2. Establish the proper testing environment.
3. Define the right test to perform.
4. Execute the tests.
5. Analyze the data.
6. Report to the engineers.
7. Repeat as necessary.
• Stress testing is a process that is used to determine an application’s stability
when subjected to above normal loads.
• Stress testing, as opposed to load testing, goes well beyond the normal traffic,
often to the breaking point of the application, in order to observe the behaviors.
• The eight steps of stress testing are as follows:
1. Identify the objectives of the test.
2. Choose the key services for testing.
3. Determine how much load is required.
4. Establish the proper test environment.
5. Identify what must be monitored.
6. Actually create the test load.
7. Execute the tests.
8. Analyze the data.
• Performance testing and stress testing impact scalability through the areas of
headroom, change control, and risk management.
ptg5994185
273
Chapter 18
Barrier Conditions and
Rollback
He will conquer who has learned the artifice of deviation. Such is the art of maneuvering.
—Sun Tzu
Whether you develop with an agile methodology, a classic waterfall methodology, or
some hybrid, good processes for the promotion of systems into your production envi-
ronment have the capability of protecting you from significant failures; whereas poor
processes may end up damning you to near certain technical death. Checkpoints and
barrier conditions within your product development life cycle can increase quality and
reduce the cost of developing your product by detecting early when you are off course.
But processes alone are not always enough. Even the best of teams, with the best pro-
cesses and great technology make mistakes and incorrectly analyze the results of certain
tests or reviews. If your platform implements a service, either Software as a Service
play or a traditional back office IT system, you need to be able to quickly roll back
significant releases to keep scale related events from creating availability incidents.
Developing effective go/no-go processes or barrier conditions, ideally within a
fault isolative infrastructure, and coupling them with a process and capability to roll
back production changes, are necessary components within any highly available ser-
vice and are critical to the success of your scalability goals. The companies focused
most intensely on cost effectively scaling their systems while guaranteeing high avail-
ability create several checkpoints in their development processes. These checkpoints
are an attempt to guarantee the lowest probability of a scalability related event and
to minimize the impact of that event should it occur. They also make sure that they
can quickly get out of any event created through recent changes by ensuring that they
can always roll back from any major change.
ptg5994185
274 CHAPTER 18 BARRIER CONDITIONS AND ROLLBACK
Barrier Conditions
You might read this heading and immediately assume that we are proposing that
waterfall development cycles are the key to success within highly scalable environ-
ments. Very often, barrier conditions or entry and exit criteria are associated with the
phases of waterfall development and sometimes identified as a reason for the inflexi-
bility of a waterfall development model. Our intent here is not to promote the water-
fall methodology, but rather to discuss the need for standards and protective
measures regardless of your approach to development. For the purposes of this dis-
cussion, assume that a barrier condition is a standard against which you measure suc-
cess or failure within your development life cycle. Ideally, you want to have these
conditions or checkpoints established within your cycle to help you decide whether
you are indeed on the right path for the product or enhancements that you are devel-
oping. Remember our discussion on goals in Chapters 4, Leadership 101, and 5,
Management 101, and the need to establish and measure these goals. Barrier condi-
tions are static goals within a development at regular “heartbeats” to ensure that
what you are developing aligns with your vision and need. Barrier conditions for
scalability might include desk checking a design against your architectural principles
within an Architecture Review Board before the design is implemented, code review-
ing the implementation to ensure it is consistent with the design, or performance test-
ing an implementation within QA and then measuring the impact to scalability upon
release to the production environment.
Example Scalability Barrier Conditions
We often recommend that the following barrier conditions be inserted into your development
methodology or life cycle. Each has a purpose to try to limit the probability of occurrence and
resulting impact of any scalability issues within your production environment:
1. Architecture Review Board. From Chapter 14, Architecture Review Board, the ARB exists
to ensure that designs are consistent with architectural principles. Architectural princi-
ples, in turn, ideally address one or more key scalability tenets within your platform. The
intent of this barrier is to ensure that time isn’t wasted implementing or developing sys-
tems that are difficult or impossible to scale to your needs.
2. Code Reviews. Modifying what is hopefully an existing and robust code review process to
include ensuring that architectural principles are followed within the implementation of
the system in question is critical to ensuring that code can be fixed for scalability prob-
lems before being identified within QA and being required to be fixed later.
ptg5994185
BARRIER CONDITIONS 275
3. Performance Testing: From Chapter 17, Performance and Stress Testing, performance
testing helps you identify potential issues of scale before introducing the system into a
production environment and potentially impacting your customers with a scalability
related issue.
4. Production Monitoring and Measurement. Ideally, your system has been designed to be
monitored as discussed within Chapter 12, Exploring Architectural Principles. Even if it is
not, capturing key performance data from both a user perspective, application perspec-
tive, and system perspective after release and comparing it to previous releases can help
you identify potential scalability related issues early before they impact your customers.
Your processes may include additional barrier conditions that you’ve found useful over time,
but we consider these to be the bare minimum to help manage the risk of releasing systems
that negatively impact customers due to scalability related problems.
Barrier Conditions and Agile Development
In our practice, we have found that many of our clients have a mistaken perception
that the including or defining standards, constraints, or processes in agile processes,
is a violation of the agile mindset. The very notion that process runs counter to agile
methodologies is flawed from the outset as any agile method is itself a process. Most
often, we find the Agile Manifesto quoted out of context as a reason for eschewing
any process or standard.
1
As a review, and from the Agile Manifesto, agile methodol-
ogies value
• Individuals and interactions over processes and tools
• Working software over comprehensive documentation
• Customer collaboration over contract negotiation
• Responding to change over following a plan
Organizations often take the “Individuals and interactions over processes and
tools” out of context without reading the line that follows these bullets, which states,
“That is, while there is value in the items from the right, we value the items on the
left more.”
2
It is clear with this line that processes add value, but that people and
interactions should take precedent over them where we need to make choices. We
absolutely agree with this approach and prefer to inject process into agile development
most often as barrier conditions to test for an appropriate level of quality, scalability,
and availability, or to help ensure that engineers are properly evaluated and taught
over time. Let’s examine how some key barrier conditions enhance our agile method.
1. This information is from the Agile Manifesto at www.agilemanifesto.org.
2. Ibid.
ptg5994185
276 CHAPTER 18 BARRIER CONDITIONS AND ROLLBACK
We’ll first start with valuing working software over comprehensive documenta-
tion. None of the suggestions we’ve made from ARB and code reviews to perfor-
mance testing and production measurement violate this rule. The barrier conditions
represented by ARB and Joint Architecture Design (JAD) are used within agile meth-
ods to ensure that the product under development can scale appropriately. ARB and
JAD can be performed orally in a group and with limited documentation and there-
fore are all consistent with the agile method.
The inclusion of barrier conditions and standards to help ensure that systems and
products work properly in production actually supports the development of working
software. We have not defined comprehensive documentation as necessary in any of
our proposed activities, although it is likely that the results of these activities will be
logged somewhere. Remember, we are interested in improving our processes over
time so logging performance results for instance will help us determine how often we
are making mistakes in our development process that result in failed performance
tests in QA or scalability issues within production.
The processes we’ve suggested also do not in any way hinder customer collabora-
tion or support contract negotiation over customer collaboration. In fact, one might
argue that they foster a better working environment with the end customer in that by
inserting scalability barrier conditions you are actually looking out for your cus-
tomer’s needs. Your customer is not likely capable of performing the type of design
evaluation, reviews, testing, or measuring that is necessary to determine if your prod-
uct will scale to its needs. Your customer does, however, expect that you are deliver-
ing a product or service that will meet not only its business objectives but its
scalability needs as well. Collaborating to develop tests and measurements that will
help ensure that your product meets customer needs and to insert those tests and
measurements into your development process is a great way to take care of your cus-
tomers and create shareholder value.
Finally, the inclusion of the barrier conditions we’ve suggested helps us to respond
to change by helping us identify when that change is occurring. The failure of a bar-
rier condition is an early alert to issues that we need to address immediately. Identify-
ing that a component is incapable of being scaled horizontally (scale out not up from
our recommended architectural principles) in an ARB session is a good indication of
potential issues for our customer. Although we may make the executive decision to
launch the feature, product, or service, we had better ensure that future agile cycles
are used to fix the issue we’ve identified. However, if the need for scale is so dramatic
that a failure to scale out will keep us from being successful, should we not respond
immediately to that issue and fix it? Without such a process and series of checks, how
would we ensure that we are meeting our customer’s needs?
Hopefully, we’ve convinced you that the addition of criteria against which you can
evaluate the success of your scalability objectives is a good idea within your agile
implementation. If we haven’t, please remember our “board of directors” test within
ptg5994185
BARRIER CONDITIONS 277
Chapter 5, Management 101. Would you feel comfortable stating that you absolutely
would not develop processes within your development life cycle to ensure that your
products and services could scale? Imagine yourself saying, “In no way, shape, or form
will we ever implement barrier conditions or criteria to ensure that we don’t release
products with scalability problems!” How long do you think you would have a job?
Cowboy Coding
Development without any process, without any plans, and without measurements to ensure
that the results meet the needs of the business is what we often refer to as cowboy coding. The
complete lack of process in cowboy-like environments is a significant barrier to success for any
scalability initiatives.
Often, we find that teams attempt to claim that cowboy implementations are “agile.” This
simply isn’t true. The agile methodology is a defined life cycle that is tailored to be adaptive to
your needs over time, versus other models that tend to be more predictive. The absence of pro-
cesses, such as any cowboy implementation, is neither adaptive nor predictive. Agile methodol-
ogies are not arguments against measurement or management. They are methodologies tuned
to release small components or subsets of functionality quickly. They were developed to help
control chaos through managing small, easily managed components rather than trying to
repeatedly fail at attempting to predict and control very large complex projects.
Do not allow yourself or your team to fall prey to the misconception that agile methodologies
should not be measured or managed. Using a metric such as velocity to improve the estimation
ability of engineers but not to beat them up over, is a fundamental part of the agile methodol-
ogy. A lack of measuring dooms you to never improving and a lack of managing dooms you to
getting lost en route to your goals and vision. Being a cowboy when it comes to designing
highly scalable solutions is a sure way to get thrown off of the bucking scalability bronco!
Barrier Conditions and Waterfall Development
The inclusion of barrier conditions within waterfall models is not a new concept.
Most waterfall implementations include a concept of entry criteria and exit criteria
for each phase of development. For instance, in a strict waterfall model, design may
not start until the requirements phase is completed. The exit criteria for the require-
ments phase in turn may include a signoff by key stakeholders and a review of
requirements by the internal customer (or an external representative) and a review by
the organizations responsible for producing those requirements. In modified, over-
lapping, or hybrid waterfall models, requirements may need to be complete for the
systems to be developed first but may not be complete for the entire product or sys-
tem. If prototyping is employed, potentially those requirements need to be mocked
up in a prototype before major design starts.
ptg5994185
278 CHAPTER 18 BARRIER CONDITIONS AND ROLLBACK
For our purposes, we need only inject the four processes we identified earlier into
the existing barrier conditions. The Architecture Review Board lines up nicely as an
exit criterion for the design phase of our project. Code reviews, including a review
consistent with our architectural principles, might create exit criteria for our coding
or implementation phase. Performance testing should be performed during the vali-
dation or testing phase with requirements being that no more than a specific percent-
age change be present for any critical system resources. Production measurements
being defined and implemented should be the entry criteria for the maintenance
phase and significant increases in any measured area if not expected should trigger
work to reduce the impact of the implementation or changes in architecture to allow
for more cost-effective scalability.
Barrier Conditions and Hybrid Models
Many companies have developed models that merge agile and waterfall methodolo-
gies, and some continue to follow the predecessor to agile methods known as rapid
application development (RAD). For instance, some companies may be required to
develop software consistent with contracts and predefined requirements, such as
those that interact with governmental organizations. These companies may wish to
have some of the predictability of dates associated with a waterfall model, but desire
to implement chunks of functionality quickly as in agile approaches.
The question for these models is where to place the barrier conditions for the
greatest benefit. To answer that question, we need to return to the objectives of the
barrier conditions. Our intent with any barrier condition is to ensure that we catch
problems or issues early in our development so that we reduce the amount of rework
to meet our objectives. It costs us less in time and work, for instance, to catch a prob-
lem in our QA organization than it does in our production environment. Similarly, it
costs us less to catch an issue in ARB than to allow it to be implemented and caught
in a code review.
The answer to the question of where to place the barrier conditions, then, is to
place the barrier conditions where they add the most value and incur the least cost to
our processes. Code reviews should be placed at the completion of each coding cycle
or at the completion of chunks of functionality. The architectural review should
occur prior to the beginning of implementation, production metrics obviously need
to occur within the production environment, and performance testing should happen
prior to the release of a system into the production environment.
Rollback Capabilities
You might argue that an effective set of barrier conditions in your development pro-
cess should obviate the need for being able to roll back major changes within your
ptg5994185
ROLLBACK CAPABILITIES 279
production environment. We can’t really argue with that thought or approach as
technically it is correct. However, arguing against the capability to roll back is really
an argument against having an insurance policy. You may believe, for instance, that
you don’t have a need for health insurance because you are a healthy individual and
fairly wealthy. Or, you may argue against automobile insurance because you are, in
the words of Dustin Hoffman in Rain Man, “an excellent driver.” But what happens
when you contract a treatable cancer and don’t have the funds for the treatment, or
someone runs into your vehicle and doesn’t have liability insurance? If you are like
most people, your view of whether you need (or needed) this insurance changes
immediately when it would become useful. The same holds true when you find your-
self in a situation where fixing forward is going to take quite a bit of time and have
quite an adverse impact on your clients.
Rollback Window Requirements
Rollback requirements differ significantly by business. The question to ask yourself
in determining how to establish your specific rollback needs, at least from the per-
spective of scalability, is to decide by when you will have enough information regard-
ing performance to determine if you need to undo your recent changes. For many
companies, the bare minimum is to allow a weekly business day peak utilization
period to have great confidence in the results of your analysis. This bare minimum
may be enough for modifications to existing functionality, but when new functional-
ity is added, it may not be enough.
New functions or features often have adoption curves that take more than one day
to get enough traffic through that feature to determine its resulting impact on system
performance. The amount of data gathered over time within any new feature may also
have an adverse performance impact and as a result negatively impact your scalability.
Let’s return to Johnny Fixer and the HRM application at AllScale. Johnny’s team
has been busy implementing a “degrees of separation” feature into the resume track-
ing portion of the system. The idea is that the system will identify people within the
company who either know a potential candidate personally or who might know peo-
ple who know the candidate with the intent being to enable background checking
through individual’s relationships. The feature takes as inputs all companies at which
current employees have worked and the list of companies for any given candidate.
Johnny’s team initially figures that a linear search should be appropriate as the list of
potential companies and resulting overlaps are likely to be small.
The new feature is released and starts to compute relationship maps over the
course of the next few weeks. Initially, all goes well and Johnny’s team is happy with
the results and the runtime of the application. However, as the list of candidates
grows, so does the list of companies for which the candidates have worked. Addition-
ally, given the growth of AllScale, the number of employees has grown as have their
first and second order relationship trees. Soon, many of the processes relying upon
ptg5994185
280 CHAPTER 18 BARRIER CONDITIONS AND ROLLBACK
the degrees of separation function start timing out and customers are getting
aggravated.
The crisis management process kicks in and Johnny’s team quickly identifies the
culprit as the degrees of separation functionality. Working with the entire team,
Johnny feels that the team can make a change to this feature to perform a more cost-
effective search algorithm within a day and get it tested and rolled out to the site
within 30 hours. Christine, the CEO, is concerned that the company will see a signif-
icant departure in user base if the problem is not fixed within a few hours.
If Johnny had followed our advice and made sure that he could roll back his last
release, he could simply roll the code back and then roll it back out when the fix is
made, assuming that his rollback process allowed him to roll back code released
three days ago. Although this may cause some user confusion, proper messaging
could help control that and within two days, Johnny could have the new code out
and functioning properly without impact to his current scalability. If Johnny didn’t
take our advice, or Johnny’s rollback process only allowed rolling back within the
first six hours of a release, our guess is that Johnny would be a convert to ensuring he
always has a rollback insurance policy to meet his needs.
The last major consideration for returning your rollback window size deals with
the frequency of your releases and how many releases you need to be capable of roll-
ing back. Maybe you have a release process that has you releasing new functionality
to your site several times a week. In this case, you may need to roll back more than
one release if the adoption rate of any new functionality extends into the next release
cycle. If this is the case, your process needs to be slightly more robust, as you are con-
cerned about multiple changes and multiple releases rather than just one release to
the next.
Rollback Window Requirements Checklist
To determine your timeframe necessary to perform a rollback, you should consider the follow-
ing things:
• How long between your release and the first heavy traffic period for your product?
• Is this a modification of existing functionality or a new feature?
• If this is a new feature, what is the adoption curve for this new feature?
• For how many releases do I need to consider rolling back based on my release fre-
quency? We call this the rollback version number requirement.
Your rollback window should allow you to roll back after significant adoption of a new feature
(say up to 50% adoption) and after or during your first time period of peak utilization.
ptg5994185
ROLLBACK CAPABILITIES 281
Rollback Technology Considerations
We often hear during our discussions around the rollback insurance policy that cli-
ents in general agree that being able to roll back would be great but that it is techni-
cally not feasible for them. Our answer to this is that it is almost always possible; it
just may not be possible with your current team, processes, or architecture.
The most commonly cited reason for an inability to roll back in Web enabled plat-
forms and back office IT systems is database schema incompatibility. The argument
usually goes that for any major development effort, there may be significant changes
to the schema resulting in an incompatibility with the way old and new data is
stored. This modification may result in table relationships changing, candidate keys
changing, table columns changing, tables added, tables merged, tables disaggregated,
and tables removed.
The key to fixing these database issues is to grow your schema over time and keep
old database relationships and entities for at least as long as it would require you to
roll back to them should you run into significant performance issues. In the case
where you need to move data to create schemas of varying normal forms, either for
functionality reasons or performance reasons, consider using data movement pro-
grams potentially started by a database trigger or using a data movement daemon or
third-party replication technology. This data movement can cease whenever you have
met or exceeded your rollback version number limit identified during your require-
ments. Ideally, you can turn off such data movement systems within a week or two
after implementation and validation that you do not need to roll back.
Ideally, you will limit such data movement, and instead populate new data in new
tables or columns while leaving old data in its original columns and tables. In many
cases, this is sufficient to accomplish your needs. In the case where you are reorganiz-
ing data, simply move the data from the new to old positions for the period of time
necessary to perform the rollback. If you need to change the name of a column or its
meaning within an application, you must first make the change in the application
leaving the database alone and then come back in a future release and change the
database. This is an example of the general rollback principle of making the change in
the application in release one and making the change in the database in a later release.
Cost Considerations of Rollback
If you’ve gotten to this point and determined that designing and implementing a roll-
back insurance policy has a cost, you are absolutely right! For some releases, the cost
can be significant, adding as much as 10% or 20% to the cost of the release. In most
cases and for most releases, we believe that you can implement an effective rollback
strategy for less than 1% of the cost or time of the release as very often you are really
just talking about different ways to store data within a database or other storage sys-
tem. Insurance isn’t free, but it exists for a reason.
ptg5994185
282 CHAPTER 18 BARRIER CONDITIONS AND ROLLBACK
Many of our clients have implemented procedures that allow them to violate the
rollback architectural principle as long as several other risk mitigation steps or pro-
cesses are in place. We typically suggest that the CEO or general manager of the
product or service in question sign off on the risk and review the risk mitigation plan
(see Chapter 16, Determining Risk) before agreeing to violating the rollback architec-
tural principle. In the ideal scenario, the principle is only violated with very small,
very low risk releases where the cost of being able to roll back exceeds the value of
the rollback given the size and impact of the release. Unfortunately, what typically
happens is that the rollback principle is violated for very large and complex releases
in order to hit time to market constraints. The problem with this approach is that
these large complex releases are often the ones for which you need rollback capability
the most.
Challenge your team whenever it indicates that the cost or difficulty to implement
a rollback strategy for a particular release is too high. Often, there are simple solu-
tions, such as implementing short lived data movement scripts, to help mitigate the
cost and increase the possibility of implementing the rollback strategy. Sometimes, the
risk of a release can be significantly mitigated by implementing markdown logic for
complex features rather than needing to ensure that the release can be rolled back. In
our consulting practice at AKF Partners, we have seen many team members who start
by saying, “we cannot possibly roll back.” After they accept the fact that it is possi-
ble, they are then able to come up with creative solutions for almost any challenge.
Markdown Functionality—Design to Be Disabled
Another of our architectural principles from Chapter 12 was designing a feature to
be disabled. This differs from rolling back features in at least two ways. The first is
that, if implemented properly, it is typically faster to turn a feature off than it is to
replace it with the previous version or release of the system. When done well, the
application may listen to a dedicated communication channel for instructions to dis-
allow or disable certain features. Other approaches may require the restart of the
application to pick up new configuration files. Either way, it is typically much faster
to disable functions causing scalability problems than it is to replace the system with
the previous release.
Another way functionality disabling differs from rolling back is that it might allow
all of the other functions within any given release, both modified and new, to con-
tinue to function as normal. If in our example of our dating site we had released both
the “has he dated a friend of mine” search and another feature that allowed the rat-
ing of any given date, we would only need to disable our search feature until it is fixed
rather than rolling back and in effect turning off both features. This obviously gives
us an advantage in releases containing multiple fixes, modified and new functionality.
ptg5994185
CONCLUSION 283
Designing all features to be disabled, however, can sometimes add an even more
significant cost than designing to roll any given release back. The ideal case is that the
cost is low for both designing to be disabled and rolling back and the company
chooses to do both for all new and modified features. Most likely, you will identify
features that are high risk, using a Failure Mode and Effects Analysis described in
Chapter 16, to determine which features should have mark down functionality
enabled. Code reuse or a shared service that is called asynchronously may help to sig-
nificantly reduce the cost of implementing functions that can be disabled on demand.
Implementing both rollback and feature disabling helps enable agile methods by cre-
ating an adaptive and flexible production environment rather than relying on predic-
tive methods such as extensive, costly, and often low return performance testing.
If implemented properly, designing to be disabled and designing for rollbacks can
actually decrease your time to market by allowing you to take some risks in produc-
tion that you would not take in their absence. Although not a replacement for load
and performance testing, it allows you to perform such testing much more quickly in
recognition of the fact that you can easily move back from implementations once
released.
The Barrier Condition, Rollback, and Markdown Checklist
Do you have the following?
• Something to block bad scalability designs from proceeding to implementation?
• Reviews to ensure that code is consistent with a scalable design or principles?
• A way to test the impact of an implementation before it goes to production?
• Ways to measure the impact of production releases immediately?
• A way to roll back a major release that impacts your ability to scale?
• A way to disable functionality that impacts your ability to scale?
Answering yes to all of these puts you on a path to identifying scale issues early and being
able to recover from them quickly when they happen.
Conclusion
This chapter covered topics such as barrier conditions, rollback capabilities, and
markdown capabilities that help companies manage the risk associated with scalabil-
ity incidents and recover quickly from them if and when they happen. Barrier condi-
tions (a.k.a. go/no-go processes) focus on identifying and eliminating risks to future
ptg5994185
284 CHAPTER 18 BARRIER CONDITIONS AND ROLLBACK
scalability early within a development process, thereby lowering the cost of identify-
ing the issue and eliminating the threat of it in production. Rollback capabilities
allow for the immediate removal of any scalability related threat, thereby limiting its
impact to customers and shareholders. Markdown and disabling capabilities allow
features impacting scalability to be disabled on a per feature basis, removing them as
threats when they cause problems.
Ideally, you will consider implementing all of these. Sometimes, on a per release
basis, the cost of implementing either rollback or markdown capabilities are excep-
tionally high. In these cases, we recommend a thorough review of the risks and all of
the risk mitigation steps possible to help minimize the impact to your customers and
shareholders. In the event of high cost of both markdown and rollback, consider
implementing at least one unless the feature is small and not complex. Should you
decide to forego implementing both markdown and rollback, ensure that you per-
form adequate load and performance testing and that you have all of the necessary
resources available during product launch to monitor and recover from any incidents
quickly.
Key Points
• Barrier conditions or go/no-go processes exist to isolate faults early in your
development life cycle.
• Barrier conditions can work with any development life cycle. They do not need
to be document intensive, though data should be collected to learn from past
mistakes.
• Architecture Review Board, code reviews, performance testing, and production
measurements can all be considered examples of barrier conditions if the result
of a failure of one of these conditions is to rework the system in question.
• Designing the capability to roll back into an application helps limit the scalabil-
ity impact of any given release. Consider it an insurance policy for your busi-
ness, shareholders, and customers.
• Designing to disable, or markdown, features complements designing by rollback
and adds the flexibility of keeping the most recent release in production while
eliminating the impact of offending features or functionality.
ptg5994185
285
Chapter 19
Fast or Right?
Thus, though we have heard of stupid haste in war, cleverness has never been seen associated with long delays.
—Sun Tzu
You have undoubtedly heard that from the choices of speed, cost, and quality, we can
only ever choose two. This is the classic refrain when it comes to business and tech-
nology. Imagine a product feature where the business sponsor has given your team
the requirements of delivery by a very aggressive date assuming the use of all of your
team, a quality standard consisting of absolutely zero defects, and the constraint of
only being able to use one engineer. Although this particular example is somewhat
silly, the time cost and quality constraints are omnipresent and very serious. There is
always a budget for hiring; even in the fastest growing companies, there is always an
expectation of quality, whether in terms of feature completion or bugs; and there is
always a need to deliver by aggressive deadlines.
In this chapter, we will discuss the general tradeoffs made in business and specifi-
cally the product development life cycle. We will also discuss how these tradeoffs
relate to scalability and availability. Finally, we will provide a framework for thinking
through these decisions on how to balance these three objectives or constraints,
depending on how you view them. This will give you a guide by which you can assess
situations in the future and hopefully make the best decision possible.
Tradeoffs in Business
The speed, quality, and cost triumvirate is often referred to as the project triangle as it
provides a good visual for how these three are inextricably connected and how you
cannot have all of them. There are several variations on this that also include scope
as a fourth element. This can be represented by putting quality in the middle and
defining the three legs of the triangle as speed, scope, and cost. We prefer to use the
traditional speed/cost/quality project triangle and define scope as the size of the trian-
ptg5994185
286 CHAPTER 19 FAST OR RIGHT?
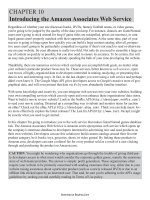
gle. This is represented in Figure 19.1, where the legs are speed, cost, and quality,
whereas the area of the triangle is the scope of the project. If the triangle is small, the
scope of the project is small and thus the cost, time, and quality elements are propor-
tional. The representation is less important than the reminder that there is a balance
necessary between these four factors in order to develop products.
Ignoring any one of legs of the triangle will cause you to deliver a poor product. If
you ignore the quality of the product, it will result in either a feature without the
desired or required characteristics and functionality or it will be so buggy as to render
it unusable. If you choose to ignore the speed, your competitors are likely to beat you
to market and you will lose first mover advantage and your perception as an innova-
tor rather than a follower. The larger the scope of the project, the higher the cost, the
slower the speed to market, and the more effort required to achieve a quality stan-
dard. Any of these scenarios should be worrisome enough for you to seriously con-
sider how you and your organization actively balance these constraints.
To completely understand why these tradeoffs exist and how to manage them, you
must first understand each of their definitions. We will define cost as any related
expense or capital investment that is utilized by or needed for the project. Costs will
include such direct charges as the number of engineers working on the project, the
number of servers required to host the new service, and the marketing campaign for
the new service. It will also include indirect cost such as an additional database
administrator necessary to handle the increased workload caused by another set of
databases or the additional bandwidth utilized by customers of the feature. You will
probably ask why such costs would be included in the proverbial bucket of costs
associated to the feature, and the answer is that if you spend more time on the fea-
ture, you are very much more likely to figure out ways to shrink the cost of new
hardware, additional bandwidth, and all the other miscellaneous charges. Thus, there
is automatically a tradeoff between the amount of time spent on something and the
ultimate cost associated with it.
For the definition of quality, we will include not only the often thought of bugs
that mark poor quality, but also the fullness of the functionality. A feature launched
Figure 19.1 Project Triangle
Scope
Speed
Quality
Cost
ptg5994185
TRADEOFFS IN BUSINESS 287
with half of the specified functionality is not likely to generate as much interest nor
revenue from customers as one with all the functionality intact. Thus, the tradeoff
from launching a feature quickly can often result in lower quality in terms of func-
tionality. The same is true for utilizing fewer engineers on a project or assigning only
the most junior engineers on a project that requires senior engineers. As you would
expect, quality also includes the amount of time and resources provided during qual-
ity assurance. Resources within quality assurance can include not only testing engi-
neers but also proper environments and testing tools. Organizations that skimp on
tools for testing cannot as efficiently utilize their testing engineers.
For the definition of speed, we will use the amount of time that a feature or project
takes to move from the initial step in the product development life cycle to release in
production. We know that the life cycle doesn’t end with the release to production,
and in fact continues through support and eventually deprecation, but those phases
of the feature’s life are typically a result of the decisions made much earlier. For
example, a feature that is rushed through the life cycle without the ample time in
quality assurance or design will significantly increase the amount of time that a fea-
ture will need to be supported once in production. Features that are not given enough
or ample time to be designed properly, possibly in a Joint Architecture Design process
and then reviewed at an Architecture Review Board, are destined to be of lower qual-
ity or higher cost or possibly both.
For the definition of scope, we will consider the amount of product features being
developed as well as the level of effort required for the development of each product
feature. Often, the scope of a feature can be changed dramatically depending on the
requirements that are deemed necessary in order to achieve the business goals that
have been established for that feature. For example, take a particular feature that is a
new customer signup flow. The goal of this feature is to increase customer signup
completion by 10%, meaning that 10% more of the people who start the signup pro-
cess complete it. The initial scope of this feature might specify the requirement of
integration with another service provider’s single signon. The team might decide
through user testing that this functionality is not required and thus the scope of this
feature would be dramatically reduced.
We use the Project Triangle to represent the equality in importance of these con-
straints. As with Figure 19.2, change the emphasis of the project as well as the scope.
The two diagrams represent different focuses for different projects. The project on
the left has a clear predilection for faster speed and higher quality at the necessary
increase in cost. This project might be something that is critical to block a competitor.
Thus, it needs to be launched by the end of the month and be full featured in an
attempt to beat a competitor to market with a similar product. The cost of adding
more engineers, possibly more senior engineers and more testing engineers, is worth
the advantage in the marketplace with your customers.
ptg5994185
288 CHAPTER 19 FAST OR RIGHT?
The project on the right in Figure 19.2 has a focus on increased speed to market with
a lower cost point at the expense of reduced quality. This project might be something
necessary for compliance where it is essential to meet a deadline to avoid penalties.
There are likely no revenue generating benefits for the feature; therefore, it is essen-
tial to keep the costs as low as possible. This project might be the equivalent to a
Y2K bug where the fix does not need to be full functioned but just needs to perform
the basic functionality by the specified date with minimal cost.
For anyone who has been in business for any amount of time, it should not come
as a surprise that there are tradeoffs that must be made. It is expected in business that
leaders make decisions everyday about how to allocate their precious resources, be
they engineers, dollars, or time. Often, these decisions are made with a well thought
out process in order to understand the pros and cons of giving more or less time,
money, or people to certain projects. As we will discuss later in this chapter, there are
several processes that you can use to analyze these decisions, some more formal than
others. Knowing that business is almost a constant tradeoff that the product develop-
ment life cycle is part of, this is to be expected. Decisions must be made on allocating
engineers to features, cutting out functionality when estimates prove not to be accu-
rate, and deciding go/no-go criteria in terms of open bugs that remain in the candi-
date release.
The cost, quality, speed, and scope constraints that comprise the Project Triangle
are all equally important overall but may vary significantly from project to project in
terms of their importance and effort to manage. Projects that require higher quality
may or may not be easier to achieve higher quality than other projects. Also, just
because it cost more to achieve, does not make it necessarily required. So, just
because we need higher quality in our project does not mean that the cost of this is a
linear relationship. A 1% improvement in quality might cost 5%, but once you are
past a 20% improvement in quality, this cost might go up to 10%. This is why each
project uses its own Allocation Circle placed over the Project Triangle that designates
where the focus should be for this project. You can create this diagram for every
project as part of the specification if you feel it provides valuable information for
everyone involved in the project, or you can just do the tradeoff analysis without the
diagram.
Figure 19.2 Project Triangle Choices
Speed
Quality
Cost
Scope
Speed
Quality
Cost
Scope
ptg5994185
RELATION TO SCALABILITY 289
Relation to Scalability
How can these tradeoffs between cost, quality, speed, and scope affect a system’s
scalability? As hinted at in the last chapter, it can be a very straightforward relation-
ship of tradeoffs made directly for scalability or infrastructure projects. Another
more indirect way that scalability is affected by the tradeoffs made between these
constraints is that decisions made on feature projects can in the long term affect the
scalability of that feature as well as of the entire system.
A scalability project that needs to split the primary database, just like a feature
development release, will have to balance the four constraints. Will you take your
most senior engineers off feature development for this? Will you give the team six
months or eighteen months to complete the project? Will you include the built-in
functionality to allow further database splits as necessary, or will you cut the project
short and have it only provide a single split? All of these questions are ones that you
will have to make over the course of the project and are a balance of the speed, cost,
quality, and scope Project Triangle.
These constraints can also affect scalability indirectly. Let’s take for example a
payment feature at AllScale where the focus is placed more heavily on the side of
speed. This feature must be released by the end of the month in order to be ready for
the end-of-month billing cycle. Missing this date would result in days of manual
work to process the payments, which would introduce many more errors resulting in
charge backs and lost revenue. The engineering manager, Mike Softe, pulls three
senior engineers off another project to place them on this payment project in order to
get it done on time. All goes well and the feature is released the weekend before
month-end allowing it to process the billing as planned.
Six months later, the AllScale HRM site’s volume has increased over 100% and an
even larger percentage of users are participating in the end-of-month billing cycle
producing a total increase in load on the billing feature of close to 150% from when
it was launched. Thus far, it has held up stoically with processing times of no more
than 12 hours. However, this month’s increase in users put it over the edge and the
processing time jumps to over 38 hours. Designed as an add-on feature to a singleton
application, this service cannot be run on multiple servers. Now the consequences of
decisions made six months ago start to be seen. The AllScale operations team must
reallocate a much larger server, planned to be used as a database server, for this appli-
cation in order to get through next month’s processing cycle. Of course, this nega-
tively affects the hardware budget. The operations team also has to spend a lot of
time monitoring, provisioning, configuring, and testing the server for this move.
Engineers and quality assurance engineers are likely brought in to this project to pro-
vide advice on changes as well as final validation that the application works on the
new hardware. This new hardware project has to take place during a maintenance
ptg5994185
290 CHAPTER 19 FAST OR RIGHT?
window because of the high risk to the users and takes up a good portion of the risk
allocation that is authorized for the system this particular week. The database split
project has to be postponed because new hardware has to be ordered, which adds
more risk of problems arising from the database being overloaded.
As you can see from our example, the decisions made during initial feature devel-
opment can have many unseen affects on scalability of the entire system. Does this
mean that the decisions and tradeoffs were incorrect? No, in fact, even with the ben-
efit of hindsight, you might still feel the decision to push to quickly get the feature
into production was the right decision, and we probably agree in this scenario. The
important learning here is not that one decision is right or wrong but rather that the
decisions have short- and long-term ramifications that you may not be able to ever
completely understand.
How to Think About the Decision
Now that we have described how these tradeoffs are being made every day in your
organization and how these can affect the scalability of the individual features as well
as the overall system, it is time for us to discuss how to properly make these deci-
sions. There are a variety of methods to choose from when you need to determine the
proper tradeoff. You can choose to rely on one of these methods or you can learn
them all in order that you use them each in the most appropriate manner. Unfortu-
nately, no decision process is going to be able to guarantee that you reach a correct
decision because often there is no correct decision; rather, there are just ones that
have different pros and cons than others. Just as with risk management, managing
tradeoffs or risk or even people is an ongoing process that keeps managers on their
toes. Today’s seemingly straightforward decision becomes a quagmire tomorrow with
the addition of one more factor. A bug fix identified as low risk suddenly becomes
high risk as the engineer digs into the code and realizes that a complete rewrite of a
base class is necessary. A great idea to rush a payments feature into production today
becomes a mess when headroom calculations predict that it will outgrow the pay-
ment server in two months.
Our goal here is to arm you with several methodologies that won’t always give
you the correct answer, because that can be elusive, but rather will help you rigor-
ously process the information that you do have in order for you to make the best
decision based on the information that you have today. There are three general meth-
ods that we have seen used. The first one is essentially the same gut feel method that
we described in Chapter 16, Determining Risk. The second method is a list of pros
and cons for each constraint. The third is what we call a decision matrix and involves
constructing a well thought out analysis of what factors are important, both short
and long term, ranking these factors compared to each other, defining the actual
ptg5994185
HOW TO THINK ABOUT THE DECISION 291
tradeoffs being considered, and determining how directly the tradeoffs impact the
factors. If that last one sounds confusing, don’t worry; we’ll go through it in more
detail in a few paragraphs.
First, let’s discuss the gut feel method for making tradeoffs. As we discussed with
regards to risk, there are some people who have an innate ability or well-honed skill
to determine the pros and cons of decisions. This is great, but as we pointed out
before, this method is not scalable and not accurate. That doesn’t mean that you need
to abandon this method; in fact, you probably already use this method the most of
any other method and you probably do it on a daily basis. We use the gut method
every time we decide to walk the ten blocks to the market instead of getting a cab,
allocating more to the cost saving constraint and less on the speed to market con-
straint. You use this in business everyday as well. You decide to hire one person who
will require slightly more salary but will hopefully produce faster and higher quality
work. It’s doubtful that you conduct a formal analysis about each hire that is a cou-
ple percentage points over the budgeted salary; it is more likely that you are like
other managers who have become used to conducting quick tradeoff analysis in their
heads or relying on their “guts” to help them make the best decisions given the infor-
mation that they have at the time.
The second and more formal method of tradeoff analysis is the comparison of
pros and cons. In this method, you would either by yourself or with a team of indi-
viduals knowledgeable about the project gather your thoughts on paper. The goal is
to list out the pros and cons of each tradeoff that you are making. For example, at
AllScale, when Mike Softe was deciding to rush the payment feature into production
by reallocating three engineers who were working on other projects, he could list out
as many tradeoffs as he could come up with. Then, Mike would identify the pros and
cons of each tradeoff, which would look something like this:
1. Engineers reallocated
• Pros: Faster payment feature development; better feature design
• Cons: Other features suffer from reallocation; cost allocated to feature increases
2. Speed feature into production
• Pros: Fulfill business need for no more manual processing
• Cons: Possibly weaker design; fewer contingencies thought through; increased
cost in hardware
3. Reduce quality testing
• Pros: Meet business timeline
• Cons: More bugs
After the tradeoffs that are being considered have been identified and the pros and
cons of each listed, Mike is ready to move to the next step. This step is to analyze the
ptg5994185
292 CHAPTER 19 FAST OR RIGHT?
pros and cons to determine which ones outweigh the others for each tradeoff. Mike
can do this by simply examining them or by allocating a score to them in terms of
how bad or good they are. For instance, with the reduce quality testing tradeoff, the
pros and cons can simply be looked at and a determination made that the pros out-
weigh the cons in this case. With the tradeoff of reallocating the engineers, the pros
and cons would probably have to be analyzed in order to make the decision. In this
case, Mike may feel that the features the engineers have been pulled from were all
low-to-medium priority and can be postponed or handed off to more junior engi-
neers. In the event that Mike decides to let more junior engineers work on the fea-
tures, he can mitigate the risk by having an architect review the design and mark this
feature for a code review. Because he can mitigate the risk and the benefit is so great,
he would likely decide to proceed with this tradeoff. This process of listing out the
tradeoffs, determining pros and cons, and then analyzing each one is the second
method of performing a tradeoff analysis.
The third method of tradeoff analysis is a more formal process. In this process,
you will take the tradeoffs identified and add to them factors that are important in
accomplishing the project. What you will have at the end of the analysis is a score
that you can use to judge each tradeoff based on the most important metrics to you.
As stated earlier, this cannot guarantee that you will make a correct decision, because
factors that may impact you in the future might not be known at this point. However,
this method will help you be assured that you have made a decision based on data
and it is the best decision you can make at this time.
Let us continue the example that we were using with the AllScale payment feature.
The tradeoffs that Mike Softe, VP of engineering, had decided on for the payment
feature were reallocating engineers, speeding the feature to production, and reducing
the quality of testing. He now needs to identify the factors that are most important to
him while accomplishing this project. This list can be generated by one person or
with a group of people familiar with the project and general needs of the business
and technology organizations. For our example, Mike has composed the following
list of important factors:
• Meet the business goals of launching by the EOM
• Maintain availability of the entire system at 99.99%
• The feature should scale to 10x growth
• The other product releases should not be pushed off track by this
• We want to follow established processes as much as possible
He then needs to rank order these to find out what factors are the most important.
Mike considers the preceding order stated as the order of importance. In Figure 19.3,
you can see that Mike has listed the tradeoffs down the left column and placed the
ptg5994185
HOW TO THINK ABOUT THE DECISION 293
factors across the top of the matrix. These factors are sorted and he has added a
weight below each factor. For simplicity, Mike used 1 through 5, as there are five fac-
tors. For more elaborate matrixes, you can use a variety of scales, such as 1, 3, 9, or
allocation out of a 100 value sum, where you have 100 points to allocate among the
factors (one may get 25, whereas others may get 3).
After the matrix is created, you need to fill in the middle, which is the strength of
support that a tradeoff has on a factor. Mike is using a scale from –9 to 9, with incre-
ments of 1, 3, –3, and –1. If a tradeoff fully supports a factor, it would receive a score
of 9. If it somewhat supports, it gets a 3. If it is unsupportive of the factor, and in
which case it would cause the opposite of the factor, it gets a negative score; the
higher the more it is unsupportive. For example, the tradeoff of Reduce the Quality
Testing for the feature has a –9 score for Follow Established Processes because it
clearly does not follow established processes of testing. After the matrix is filled out,
Mike can perform the calculations on them. The formula is to multiply each score in
the body of the matrix by the weight of each factor and then sum these products for
each tradeoff producing the total score. Using the Engineers Reallocated tradeoff,
Mike has a formula as depicted in Figure 19.4.
The total score for this tradeoff in the equation in Figure 19.4 is 67. This formula is
calculated for each tradeoff. With this final score, Mike and his team can analyze each
tradeoff individually as well as all the tradeoffs collectively. From this sample analy-
sis, Mike has decided to find a way to allow more time spent in quality testing while
proceeding with reallocating engineers and expediting the feature into production.
Figure 19.3 Decision Matrix
Figure 19.4 Total Calculation
Factors
Meet Business
Goal of Launch
by EOM
Maintain
Availability at
99.99%
Feature Scales
to 10x
Keep Other
Releases on Track
Follow
Established
Processes
To ta l
Tradeoffs
Weight
54 3 2 1
Engineers Reallocated
91 9 –3 –367
Speed Feature to Production
9 –3 –3 3 –3 27
Reduce Quality of Testing
1 –3 –1 9 –9 –1
–9 Highly Unsupportive
–3 Very Unsupportive
–1 Unsupportive
1 Supportive
3 Very Supportive
9 Highly Supportive
Scale
Total =×+×+×+−×+−×()()()( )( )95 14 93 32 31
ptg5994185
294 CHAPTER 19 FAST OR RIGHT?
Fast or Right Checklist
• What does your gut tell you about the tradeoff?
• What are the pros and cons of each alternative?
• Is a more formal analysis required because of the risk or magnitude of the decision?
• If a more formal analysis is required:
What are the most important factors? In Six Sigma parlance, these are critical to quality
indicators.
How do these factors rank compared to each other—that is, what is the most important
one of these factors?
What are the actual tradeoffs being discussed?
How do these tradeoffs affect the factors?
• Would you feel comfortable standing in front of your board explaining your decision
based on the information you have today?
We have given you three methods of analyzing the tradeoffs from balancing the
cost, quality, and speed constraints. It is completely appropriate to use all three of
these methods at different times or in increasing order of formality until you believe
that you have achieved a sufficiently rigorous decision. The two factors that you may
consider when deciding which method to use are the risk of the project and the mag-
nitude of the decision. The risk should be calculated by one of the methods described
in Chapter 16. There is not an exact level of risk that corresponds to a particular
analysis methodology. Using the traffic light risk method, projects that would be con-
sidered green could be analyzed by gut feeling, whereas yellow projects should at
least have the pros and cons compared as described in the pro and con comparison
process earlier. Examples of these tradeoff rules are shown in Table 19.1. Of course,
red projects should be candidates for a fully rigorous decision matrix. This is another
great intersection of processes where a set of rules to work by would be an excellent
addition to your documentation.
Table 19.1 Risk and Tradeoff Rules
Risk Traffic Light Risk FMEA Tradeoff Analysis Rule
Green < 100 pts No formal analysis required
Yellow < 150 pts Compare pros/cons
Red > 150 pts Fill out decision matrix