the art of scalability scalable web architecture processes and organizations for the modern enterprise phần 7 potx
Bạn đang xem bản rút gọn của tài liệu. Xem và tải ngay bản đầy đủ của tài liệu tại đây (7 MB, 59 trang )
ptg5994185
THE X-AXIS OF THE CUBE 329
terms of people and organizations. Let’s first consider the days in which typing pools
handled the typing of meeting minutes, letters, internal memos, and so on. Note the
use of the term pool as far back as 50 or more years identifying a service distributed
among several entities (in this case people). Work would be sent to the typing pool
largely without a bias as to what individual typist performed the work. Some typists
might be faster than others and as a result would get more work sent their way and
accomplish more work within the course of a day, but ideally it would not matter
where any individual piece of work went within the pool. Everyone could type and
everyone was capable of typing one of the set of internal memos, external letters, or
meeting minutes. In effect, other than the speed of the hardware (typewriter) used
and the speed of the person, everyone was a clone and capable of doing the work.
This distribution of work among clones is a perfect example of x-axis scalability.
Another people example to illustrate our point might be within the accounts
receivable or accounts payable portion of your company’s finance organization. Ini-
tially, for small to medium companies, and assuming that the work is not outsourced,
the groups might be comprised of a few people, each of whom can perform all of the
tasks within his area. The accounts payable staff can all receive bills and generate
checks based on a set of processes and send those checks out or get them counter-
signed depending upon the value of the check written. The accounts receivable staff is
capable of generating invoices from data within the system, receiving checks, making
appropriate journal entries, and depositing the checks. Each person can do all of the
tasks, and it does not matter to whom the work goes.
All three of these examples illustrate the basic concept of the x-axis, which is the
unbiased distribution of work across clones. Each clone can do the work of the other
clones and there is no bias with respect to where the work travels (other than individ-
ual efficiency). Each clone has the tools and resources to get the work done and will
perform the work given to it as quickly as possible.
The x-axis seems great! When we need to perform more work, we just add more
clones. Is the number of memorandums exceeding your current typing capacity? Sim-
ply add more typists! Is your business booming and there are too many invoices to
make and payments coming in? Add more accounts receivable clerks! Why would we
ever need any more axes? Let’s return to our typing pool first to answer this question.
Let’s assume that in order to write some of our memorandums, external letters,
and notes a typist needs to have certain knowledge to complete them. Let’s say that
as the company grows, the services offered by the typing pool increases. The pool
now performs some 100 different types and formats of services and the work is not
evenly distributed across these types of services. External client letters have several
different formats that vary by the type of content included within the message, mem-
orandums vary by content and intent, and meeting notes vary by the type of meeting,
and so on. Now an individual typist may get some work done very fast (the work
ptg5994185
330 CHAPTER 22 INTRODUCTION TO THE AKF SCALE CUBE
that is most prevalent throughout the pool) but be required to spend time looking up
the less frequent formatting, which in turn slows down the entire pipeline of work.
As the type of work increases for any given service, more time may be spent trying to
get work of varying sizes done; and the instruction set to accomplish this work may
not be easily kept in any given typist’s head. These are all examples of problems asso-
ciated with the x-axis of scale; it simply does not scale well with an increase in data,
either as instruction sets or reference data. The same holds true if the work varies by
the sender or receiver. For instance, maybe vice presidents and above get special for-
matting or are allowed to send different types of communication than directors of the
company. Perhaps special letterhead or stock is used that varies by the sender. Maybe
the receiver of the message causes a variation in tone of communication or paper
stock. Account delinquent letters may require a special tone not referenced within the
notes to be typed, for instance.
As another example, consider again our accounts receivable group. This group
obviously performs a very wide range of tasks from the invoicing of clients to the
receipt of bills, the processing of delinquent accounts, and finally the deposit of funds
into our bank account(s). The processes for each of these grows as the company
grows and our controller is going to want some specific process controls to exist so
that money doesn’t errantly find its way out of the accounts receivable group and
into one of our employees pockets before payday! This is another place where scaling
for transaction growth alone is not likely to allow us to scale cost effectively into a
multibillion dollar company! We will likely need to perform splits based on the ser-
vices this group performs and/or the clients or types of clients they serve. These splits
are addressed by the y- and z-axes of our cube, respectively.
The x-axis split tends to be easy to understand and implement and fairly inexpen-
sive in terms of capital and time. Little additional process or training is necessary, and
managers find it easy to distribute the work. Our people analogy holds true for sys-
tems as well, which we will see in Chapters 23 and 24. The x-axis works well when
the distribution of a high volume of transactions or work is all that we need to do.
Summarizing the X-Axis
The x-axis of the AKF Scale Cube represents the cloning of services or data such that work
can easily be distributed across instances with absolutely no bias.
X-axis implementations tend to be easy to conceptualize and typically can be implemented
at relatively low cost.
X-axis implementations are limited by growth in instructions to accomplish tasks and growth
in data necessary to accomplish tasks.
ptg5994185
THE Y-AXIS OF THE CUBE 331
The Y-Axis of the Cube
The y-axis of the cube of scale represents a separation of work responsibility by
either the type of data, the type of work performed for a transaction, or a combina-
tion of both; one way to view these splits is a split by responsibility for an action. We
often refer to these as service or resource oriented splits. In a y-axis split, the work for
any specific action or set of actions, as well as the information and data necessary to
perform that action, is split away from other types of actions. This type of split is the
first split that addresses the monolithic nature of work and the separation of the same
into either pipelined work flows or parallel processing flows. Whereas the x-axis is
simply the distribution of work among several clones, the y-axis represents more of
an industrial revolution for work; we move from a “job shop” mentality to a system
of greater specialization, just as Henry Ford did with his automobile manufacturing.
Rather than having 100 people creating 100 unique automobiles, with each person
doing 100% of the tasks, we now have 100 unique individuals performing subtasks
such as engine installation, painting, windshield installation, and so on.
Let’s return to our previous example of a typing service pool. In our x-axis exam-
ple, we identified that the total output of our pool might be hampered as the number
and diversity of tasks grew. Specialized information might be necessary based on the
type of typing work performed: an internal memorandum might take on a signifi-
cantly different look than a memo meant for external readers, and meeting notes
might vary by the type of meeting, and so on. The vast majority of the work may be
letters to clients of a certain format and typed on a specific type of letterhead and
bond. When someone is presented with one of the 100 or so formats that only repre-
sent about 10% to 20% of the total work, they may stop and have to look up the
appropriate format, grab the appropriate letterhead and/or bond, and so on. One
approach to this might be to create much smaller pools specializing in some of the
more common requests within this 10% to 20% of the total work and a third pool
that handles the small minority of the remainder of the common requests. Both of
these new service pools could be sized appropriate to the work.
The expected benefit of such an approach would be a significant increase in the
throughput of the large pool representing a vast majority of the requests. This pool
would no longer “stall” on a per typist basis based on a unique request. Furthermore,
for the next largest pool of typists, some specialization would happen for the next
most common set of requests, and the output expectations would be the same; for
those sets of requests typists would be familiar with them and capable of handling
them much more quickly than before. The remaining set of requests that represent a
majority of formats but a minority of request volume would be handled by the third
pool and although throughput would suffer comparatively, it would be isolated to a
smaller set of people who might also at least have some degree of specialization and
ptg5994185
332 CHAPTER 22 INTRODUCTION TO THE AKF SCALE CUBE
knowledge. The overall benefit should be that throughput should go up significantly.
Notice that in creating these pools, we have also created a measure of fault isolation
as identified within Chapter 21. Should one pool stall due to paper issues and such,
the entire “typing factory” does not come to a halt.
It is easy to see how the separation of responsibilities would be performed within
our running example of the accounts receivable department. Each unique action
could become its own service. Invoicing might be split off into its own team or pool,
as might payment receiving/journaling and deposits. We might further split late pay-
ments into its own special group that handles collections and bad debt. Each of these
functions has a unique set of tasks that require unique data, experience, and instruc-
tions or processes. By splitting them, we reduce the amount of information any spe-
cific person needs to perform his job, and the resulting specialization should allow us
to perform processing faster. The y-axis industrial revolution has saved us!
Although the benefits of the y-axis are compelling, y-axis splits tend to cost more
than the simpler x-axis splits. The reason for the increase in cost is that very often to
perform the y-axis split there needs to be some rework or redesign of process, rules,
software, and the supporting data models or information delivery system. Most of us
don’t think about splitting up the responsibilities of our teams or software when we
are a three-person company or a Web site running on a single server. Additionally, the
splits themselves create some resource underutilization initially that manifests itself as
an initial increase in operational cost.
The benefits are numerous, however. Although y-axis splits help with the growth
in transactions, they also help to scale what something needs to know to perform
those transactions. The data that is being operated upon as well as the instruction set
to operate that data decreases, which means that people and systems can be more
specialized, resulting in higher throughput on a per person or per system basis.
Summarizing the Y-Axis
The y-axis of the AKF Scale Cube represents separation of work by responsibility, action, or
data.
Y-axis splits are easy to conceptualize but typically come at a slightly higher cost than the x-
axis splits.
Y-axis splits aid in scaling not only transactions, but instruction size and data necessary to
perform any given transaction.
ptg5994185
THE Z-AXIS OF THE CUBE 333
The Z-Axis of the Cube
The z-axis of the cube is a split biased most often by the requestor or customer. The
bias here is focused on data and actions that are unique to the person or system per-
forming the request, or alternatively the person or system for which the request is
being performed. Z-axis splits may or may not address the monolithic nature of
instructions, processes, or code, but they very often do address the monolithic nature
of the data necessary to perform these instructions, processes, or code.
To perform a z-axis split of our typing service pool, we may look at both the peo-
ple who request work and the people to whom the work is being distributed. In ana-
lyzing the request work, we can look at segments or classes of groups that might
require unique work or represent exceptional work volume. It’s likely the case that
executives represent a small portion of our total employee base but also represent a
majority or supermajority of the work for internal distribution. Furthermore, the
work for these types of individuals might be somewhat unique in that executives are
allowed to request more types of work to be performed. Maybe we limit internal
memorandums to executive requests, or personal customer notes might only be
requested from an executive. This unique volume of work and type of work might be
best served by a specialist pool of typists. We may also dedicate one or more typists
to the CEO of the company who likely has the greatest number and variety of
requests. All of these are examples of z-axis splits.
In our accounts receivable department, we might decide that some customers
require specialized billing, payment terms, and interaction unique to the volume of
business they do with us. We might dedicate a group of our best financial account
representatives and even a special manager to one or more of these customers to han-
dle their unique demands. In so doing, we would reduce the amount of knowledge
necessary to perform a vast majority of our billing functions for a majority of our
customers while creating account specialists for our most valuable customers. We
would expect these actions to increase the throughput of our standard accounts
group as they need not worry about special terms, and the relative throughput for
special accounts should also go up as these individuals specialize in that area and are
familiar with the special processes and payment terms.
Z-axis splits are very often the most costly for companies to implement, but the
returns (especially from a scalability perspective) can be phenomenal. Specialized
training in the previous examples represent a new cost to the company, and this train-
ing is an analog to the specialized set of services one might need to create within a
systems platform. Data separation can become costly for some companies, but when
performed can be amortized over the life of the platform or the system.
An additional benefit that z-axis splits create is the ability to separate services by
geography. Want to have your accounts receivable group closer to the accounts they
ptg5994185
334 CHAPTER 22 INTRODUCTION TO THE AKF SCALE CUBE
support to decrease mail delays? Easy to do! Want your typing pool close to the exec-
utives and people they support to limit interoffice mail delivery (remember these are
the days before email)? Also simple to do!
Summarizing the Z-Axis
The z-axis of the AKF Scale Cube represents separation of work by customer or requestor.
As with x- and y-axis splits, the z-axis is easy to conceptualize, but very often is the most
difficult and costly to implement for companies.
Z-axis splits aid in scaling transactions and data and may aid in scaling instruction sets and
processes if implemented properly.
Putting It All Together
Why would we ever need more than one, or maybe two, axes of scale within our plat-
form or organizations? The answer is that your needs will vary by your current size
and expected annual growth. If you expect to stay small and grow slowly, you may
never need more than one axis of scale. If you grow quickly, however, or growth is
unexpected and violent, you are better off having planned for that growth in
advance. Figure 22.4 depicts our cube, the axes of the cube, and the appropriate
labels for each of the axes.
The x-axis of scale is very useful and easy to implement, especially if you have
stayed away from creating state within your system or team. You simply clone the
activity among several participants. But scaling along the x-axis starts to fail when
Figure 22.4 AKF Scale Cube
0
0
0
y
All Work Evenly Distributed
Work Distributed by
Type of Action
Work Distributed by
Customer Location
ptg5994185
PUTTING IT ALL TOGETHER 335
you have a lot of different tasks requiring significantly different information from
many potential sources. Fast transactions start to run at the speed of slow transac-
tions and everything starts to work suboptimally.
State Within Applications and the X-Axis
You may recall from Chapter 12 that we briefly defined stateful systems as “those in which
operations are performed within the context of previous and subsequent operations.” We indi-
cated that state very often drives up the cost of the operations of systems as most often the
state (previous and subsequent calls) is maintained within the application or a database asso-
ciated with the application. The associated data often drives up memory utilization, storage uti-
lization, and potentially database usage and licenses.
Stateless systems often allow us to break affinity between a single user and a single server.
Because subsequent requests can go to any server clone, the x-axis becomes even easier to
implement. No affinity between customer and server means that we need not design systems
specific to any type of customer and so forth. Systems are now free to be more uniform in compo-
sition. This topic will be covered in more detail in Chapter 26, Asynchronous Design for Scale.
The y-axis helps to solve that by isolating transaction type and speed to systems
and people specializing in that area of data or service. Slower transactions are now
bunched together, but because the data set has been reduced relative to the X only
example, they run faster than they had previously. Fast transactions are also sped up
as they are no longer competing with resources for the slower transactions and their
data set has also been reduced. Monolithic systems are reduced to components that
operate more efficiently and can scale for data and transaction needs.
The z-axis helps us scale not only transactions and data, but may also help with
monolithic system deconstruction. Furthermore, we can now move teams and sys-
tems around geographically and start to gain benefits from this geographic disper-
sion, such as disaster recovery.
Looking at our pool of typists, we can separate the types of work that they per-
form by the actions. We might create a customer focused team responsible for general
customer communication letters, an internal memos team, and team focused on
meeting minutes—all of these are examples of the y-axis. Each team is likely to have
duplication to allow for growth in transactions within that team, which is an exam-
ple of x-axis scale. Finally, we might specialize some members of the team relevant to
specific customers or requestors such as an executive group. Although this is a z-axis
split, these teams may also have specialization by task (y-axis) and duplication of
team members (x-axis). Aha! We’ve put all three axes together.
ptg5994185
336 CHAPTER 22 INTRODUCTION TO THE AKF SCALE CUBE
For our accounts receivable department we have split them by invoicing, receiving,
and deposits, all of which are y-axis splits. Each group has multiple members per-
forming the same task, which is an x-axis split. We have created special separation of
these teams focused on major accounts and recurring delinquent accounts and each
of these specialized teams (a z-axis split) has further splits by function (y-axis) and
duplication of individuals (x-axis).
AKF Scale Cube Summary
Here is a summary of the three axes of scale:
• The x-axis represents the distribution of the same work or mirroring of data across multi-
ple entities.
• The y-axis represents the distribution and separation of work responsibilities or data
meaning among multiple entities.
• The z-axis represents distribution and segmentation of work by customer, customer
need, location, or value.
Hence, x-axis splits are mirror images of functions or data, y-axis splits separate data based
on data type or type of work, and z-axis splits separate work by customer, location, or some
value specific identifier (like a hash or modulus).
When and Where to Use the Cube
We will discuss the topic of where and when to use the AKF Scale Cube in Chapters
23, Splitting Applications for Scale, and 24, Splitting Databases for Scale. That said,
the cube is a tool and reference point for nearly any discussion around scalability.
You might make a representation of it within your scalability, 10x, or headroom
meetings—a process that was discussed in Chapter 11, Determining Headroom for
Applications. The AKF Scale Cube should also be presented during Architecture
Review Board (ARB) meetings, as discussed in Chapter 14, Architecture Review
Board, especially if you adopt a principle requiring the design of more than one axis
of scale for any major architectural effort. It can serve as a basis for nearly any con-
versation around scale as it helps to create a common language among the engineers
of an organization. Rather than talking about specific approaches, teams can focus
on concepts that might evolve into any number of approaches.
You may consider requiring footnotes or light documentation indicating the type
of scale for any major design within Joint Architecture Design (JAD) introduced in
ptg5994185
CONCLUSION 337
Chapter 13, Joint Architecture Design. The AKF Scale Cube can also come into play
during problem resolution and postmortems in identifying how intended approaches
to scale did or did not work as expected and how to fix them in future endeavors.
The AKF Scale Cube is a tool best worn on your tool belt rather than placed in
your tool box. It should be carried at all times as it is lightweight and can add signif-
icant value to you and your team. If referenced repeatedly, it can help to change your
culture from one that focuses on specific fixes and instead discusses approaches and
concepts to help identify the best potential fix. It can switch an organization from
thinking like technicians to acting like engineers.
Conclusion
This chapter reintroduced the concept of the AKF Scale Cube. Our cube has three
axes, each of which focused on a different approach toward scalability. Organiza-
tional construction was used as an analogy for systems to help better reinforce the
approach of each of the three axes of scale. The cube is constructed such that the ini-
tial point (x = 0, y = 0, z = 0) is a monolithic system or organization (single person)
performing all tasks with no bias based on the task, customer, or requestor.
Growth in people or systems performing the same tasks represents an increase in
the x-axis. This axis of scale is easy to implement and typically comes at the lowest
cost but suffers when the number of types of tasks or data necessary to perform those
tasks increases.
A separation of responsibilities based on data or the activity being performed is
growth along the y-axis of our cube. This approach tends to come at a slightly higher
cost than x-axis growth but also benefits from a reduction in the data necessary to
perform a task. Other benefits of such an approach include some fault isolation and
an increase in throughput for each of the new pools based on the reduction of data or
instruction set.
A separation of responsibility biased on customer or requestor is growth along the
z-axis of scale. Such separation may allow for reduction in the instruction set for
some pools and almost always reduces the amount of data necessary to perform a
task. The result is that throughput is often increased, as is fault isolation. Cost of z-
axis splits tends to be the highest of the three approaches in most organizations,
though the return is also huge. The z-axis split also allows for geographic dispersion
of responsibility.
Not all companies need all three axes of scale to survive. Some companies may do
just fine with implementing the x-axis. Extremely high growth companies should
plan for at least two axes of scale and potentially all three. Remember that planning
(or designing) and implementing are two separate functions.
ptg5994185
338 CHAPTER 22 INTRODUCTION TO THE AKF SCALE CUBE
Ideally the AKF Scale Cube, or a construct of your own design, will become part
of your daily toolset. Using such a model helps reduce conflict by focusing on con-
cepts and approaches rather than specific implementations. If added to JAD, ARB,
and headroom meetings, it helps focus the conversation and discussion on the impor-
tant aspects and approaches to growing your technology platform.
Key Points
• The AKF Scale Cube offers a structured approach and concept to discussing and
solving scale. The results are often superior to a set of rules or implementation
based tools.
• The x-axis of the AKF Scale Cube represents the cloning of entities or data and
an equal unbiased distribution of work across them.
• The x-axis tends to be the least costly to implement, but suffers from constraints
in instruction size and dataset.
• The y-axis of the AKF Scale Cube represents separation of work biased by activ-
ity or data.
• The y-axis tends to be more costly than the x-axis but solves issues related to
instruction size and data set in addition to creating some fault isolation.
• The z-axis of the AKF Scale Cube represents separation of work biased by the
requestor or person for whom the work is being performed.
• The z-axis of the AKF Scale Cube tends to be the most costly to implement but
very often offers the greatest scale. It resolves issues associated with dataset and
may or may not solve instruction set issues. It also allows for global distribution
of services.
• The AKF Scale Cube can be an everyday tool used to focus scalability related
discussions and processes on concepts. These discussions result in approaches
and implementations.
• ARB, JAD, and headroom are all process examples where the AKF Scale Cube
might be useful.
ptg5994185
339
Chapter 23
Splitting Applications for Scale
Whether to concentrate or to divide your troops must be decided by circumstances.
—Sun Tzu
The previous chapter introduced the model by which we describe splits to allow for
nearly infinite scale. Now we’re going to apply the concepts we discussed within
Chapter 22, Introduction to the AKF Scale Cube, to our realworld technology plat-
form needs. To do this, we will separate the platform into pieces that address our
application and service offerings (covered in this chapter) and the splits necessary to
allow our storage and databases to scale (covered in the next chapter). The same
model and set of principles hold true for both approaches, but the implementation
varies enough that it makes sense for us to address them in two separate chapters.
The AKF Scale Cube for Applications
The underlying meaning of the AKF Scale Cube really doesn’t change when discuss-
ing either databases or applications. However, given that we are now going to use
this tool to accomplish a specific purpose, we are going to add more specificity to the
axes. These new descriptions, although remaining absolutely true to our original def-
initions, will make it more useful for us to apply the AKF Scale Cube to the architect-
ing of applications to allow for greater scalability. Let’s first start with the AKF Scale
Cube from the end of Chapter 22.
In Chapter 22, we defined the x-axis of our cube as the cloning of services and
data with absolutely no bias. In the x-axis approach to scale, the only thing that is
different between one system and 100 systems is that the transactions are evenly split
between those 100 systems as if each of them was a single instance capable of han-
dling 100% of the original requests rather than the 1% that they actually handle. We
will rename our x-axis to Horizontal Duplication/Cloning of Services to make it
more obvious how we will apply this to our architecture efforts.
ptg5994185
340 CHAPTER 23 SPLITTING APPLICATIONS FOR SCALE
The y-axis from Chapter 22 was described as a separation of work responsibility
by either the type of data, the type of work performed for a transaction, or a combi-
nation of both. We most often describe this as a service oriented split within an appli-
cation and as such we will now label this axis as a split by function or service. Here,
function and service are indicative of the actions performed by your platform, but
they can just as easily be resource oriented splits such as the article upon which an
action is being taken. A function or service oriented split should be thought of as being
split along action or “verb” boundaries, whereas a resource oriented split is most
often split along “noun” boundaries. We’ll describe these splits later in this chapter.
The z-axis from Chapter 22 was described as being focused on data and actions
that are unique to the person or system performing the request, or alternatively the
person or system for which the request is being performed. In other words, these are
requests that are split by the person or system making a request or split based on the
person or system for whom the data is intended. We also often refer to the z-axis as
being a “lookup oriented” split in applications. The lookup here is an indication that
users or data are subject to a non action oriented bias that is represented somewhere
else within the system. We store the relationships of users to their appropriate split or
service somewhere, or determine an algorithm such as a hash or modulus of user_id
that will reliably and consistently send us to the right location set of systems to get
the answers for the set of users in question.
The new AKF Scale Cube for applications now looks like Figure 23.1.
Figure 23.1 AKF Application Scale Cube
One,
Monolithic
System/Service
Many Systems,
Each a Clone
and Load
Balanced
X-Axis
—
Horizontal Duplication
Y-Axis
—Split
by Function or
Service
No Splits
Split by
Service or
Similar
Information
Z-Axis—Customer/Requestor
Oriented Splits
No Splits
Further Slice
Data or Users
Near Infinite Scale
Starting Point
ptg5994185
THE X-AXIS OF THE AKF APPLICATION SCALE CUBE 341
The X-Axis of the AKF Application Scale Cube
The x-axis of the AKF Application Scale Cube represents cloning of services with
absolutely no bias. As described previously, if we have a service or platform that is
scaled using the x-axis alone and consisting of N systems, each of the N systems can
respond to any request and will give exactly the same answer as the other (N-1) sys-
tems. There is no bias to service performed, customer, or any other data element.
Login functionality exists in the same location and application as shopping cart,
checkout, catalog, and search functionality. Regardless of the request, it is sent to one
of the N systems that comprise our x-axis split.
The x-axis approach is simple to implement in most cases. You simply take exactly
the same code that existed in a single instance implementation and put it on multiple
servers. If your application is not “stateful,” meaning per our previous definitions
that you are not using a user’s previous transactions to inform future decisions, sim-
ply load balance all of the inbound requests to any of the N systems. If you are main-
taining data associated with user state or otherwise are requiring persistence from a
user to an application or Web server, both of which increase the cost of implementa-
tion for a number of reasons, the implementation is slightly more difficult, but the
same basic approach is used. In the cases where persistency or state is necessary (or
persistency resulting from the need for state), a series of transactions from a single
user is simply pegged to one of the N instances of the x-axis split. This can be accom-
plished with session cookies from a load balancer. Additionally, as we will discuss
more in Chapter 26, Asynchronous Design for Scale, there are methods of centraliz-
ing session management to still allow any of N systems to respond to an individual
user’s request without requiring persistency to that system.
The x-axis split has several benefits and drawbacks. As a benefit, this split is rela-
tively simple to envision and implement. Other benefits include that it allows for near
infinite scale from a number of transactions perspectives and when hosting your
applications or services it does not increase the complexity of your hosting environ-
ment. Drawbacks of the x-axis approach include the inability of this split to address
scalability from a data/cache perspective or instruction complexity perspective.
As just stated, x-axis splits are easy to envision and implement. As such, when put
in a position of needing a quick solution to any scale initiative, x-axis splits should be
one of the first that you consider. Because it is generally easy to clone services, the
impact to cost in terms of design expense and implementation expense is low. Fur-
thermore, the impact to time to market to release functionality with an x-axis split is
generally low compared to other implementations as you are, after all, merely cloning
the services in question.
X-axis splits also allow us to easily scale our platforms with the number of
inbound transactions or requests. If you have a single user or small number of users
who grow from making 10 requests per second to 1000 requests per second, you
ptg5994185
342 CHAPTER 23 SPLITTING APPLICATIONS FOR SCALE
need only add roughly 100 times the number of systems or cloned services to handle
the increase in requests. There isn’t a lot of engineering magic involved—simply input the
demand increase and a spreadsheet can tell you how many systems to buy and when.
Finally, the team responsible for managing the services of your platform does not
need to worry about a vast number of uniquely configured systems or servers. Every
system performing an x-axis split is roughly equivalent to every other system per-
forming the same split. Configuration management of all servers is relatively easy to
perform and new service implementation is as easy as cloning an existing system or
generating a new system from a “jumpstart server” and assigning it a unique name or
address. Configuration files do not vary and the only thing the operations group
needs to be concerned about is the total number of systems in an x-axis implementa-
tion and that each is getting an appropriate amount of traffic.
Although x-axis splits scale well with increased transaction volumes, they do not
address the problems incurred by increasing amounts of data. If your system requires
that you cache a great deal of data to serve client requests, as that data grows, your
time to serve any given request will likely increase, which is obviously bad for the
customer experience. Additionally, you might find yourself constrained on the server
or application itself if your data gets too unwieldy. Even if you don’t need to cache
any data, searching through data on other storage or database systems will likely
increase as your customer base and/or product catalog increases in size.
X-axis splits also don’t address the complexity of the software implementing your
system, platform, or product. Everything in an x-axis split alone is assumed to be
monolithic in nature; as a result, applications will likely start to slow down as servers
page instruction/execution pages in and out of memory to perform different func-
tions. As your product becomes more feature rich, monolithic applications slow
down and become more costly and less easily scaled either as a result of this instruc-
tion complexity or the data complexity mentioned earlier.
Summarizing the Application X-Axis
The x-axis of the AKF Application Scale Cube represents the cloning of an application or ser-
vice such that work can easily be distributed across instances with absolutely no bias.
X-axis implementations tend to be easy to conceptualize and typically can be implemented
at relatively low cost. They are the most cost-effective way of scaling transaction growth. They
can be easily cloned within your production environment from existing systems or “jumpstarted”
from “golden master” copies of systems. They do not tend to increase the complexity of your
operations or production environment.
X-axis implementations are limited by the growth of a monolithic application, which tends to
slow down the processing of transactions. They do not scale well with increases in data or
application size.
ptg5994185
THE Y-AXIS OF THE AKF APPLICATION SCALE CUBE 343
The Y-Axis of the AKF Application Scale Cube
The y-axis of the cube of scale represents a separation of work responsibility within
your application. When discussing application scale, we most frequently think of this
in terms of functions, methods, or services within an application. The y-axis split
addresses the monolithic nature of an application by separating that application into
parallel or pipelined processing flows. A pure x-axis split would have 100 instances
of the exact same application performing exactly the same work on each of the N
transactions that a site received over T time. Each of the 100 instances would receive
N/100 of the work. In a y-axis split, we might take a single monolithic application
and split it up into 100 distinct services such as login, logout, read profile, update
profile, search profiles, browse profiles, checkout, display similar items, and so on.
Y-axis splits are a bit more complicated to implement than x-axis splits. At a very
high level, it is possible to implement a y-axis split in production without actually
splitting the code base itself. You can do this by cloning a monolithic application and
setting it on multiple physical or virtual servers. Let’s assume that you want to have
four unique y-axis split servers, each serving 1/4th of the total number of functions
within your site. One server might serve login and logout functionality, another read
and update profile, another server handles “contact individual” and “receive con-
tacts,” and the last server handles all of the other functions of your platform. You
may assign a unique URL or URI to each of these servers, such as login.allscale.com
and contacts.allscale.com, and ensure that any of the functions within the appropri-
ate grouping always get directed to the server in question. This is a good, first
approach to performing a split and helps work out the operational kinks associated
with splitting applications. Unfortunately, it doesn’t give you all of the benefits of a
full y-axis split made within the codebase itself.
Y-axis splits are most commonly implemented to address the issues associated
with a code base and dataset that have grown significantly in complexity or size.
They also help scale transaction volume, as in performing the splits you must add vir-
tual or physical servers. To get most of the benefits of a y-axis split, the code base
itself needs to be split up from a monolithic structure to the services that comprise the
entire platform.
Operationally, y-axis splits help reduce the time necessary to process any given
transaction as the data and instruction sets that are being executed or searched are
smaller. Architecturally, y-axis splits allow you to grow beyond the limitations that
systems place on the absolute size of software or data. Y-axis splits also aid in fault
isolation as identified within Chapter 21, Creating Fault Isolative Architectural Struc-
tures; a failure of a given service does not bring down all of the functionality of your
platform.
From an engineering perspective, y-axis splits allow you to grow your team more
easily by focusing teams on specific services or functions within your product. You
ptg5994185
344 CHAPTER 23 SPLITTING APPLICATIONS FOR SCALE
can dedicate a person or a team to searching and browsing, a team toward the devel-
opment of an advertising platform, a team to account functionality, and so on. New
engineers come up to speed faster as they are dedicated to a specific section of func-
tionality within your system. More experienced engineers become experts at a given
system and as a result can produce functionality within that system faster. The data
elements upon which any y-axis split works will likely be a subset of the total data on
the site; as such, engineers better understand the data with which they are working
and are more likely to make better choices in creating data models.
Y-axis splits also have drawbacks. They tend to be more costly to implement in
engineering time than x-axis splits because engineers either need to rewrite or at the
very least disaggregate services from the monolithic application. The operations and
infrastructure teams will now need to support more than one configuration of server.
This in turn might mean that there is more than one class or size of server in the oper-
ations environment to get the most cost-efficient systems for each type of transaction.
When caching is involved, data might be cached differently in different systems, but
we highly recommend that a standard approach to caching be shared across all of the
splits. URL/URI structures will grow, and when referencing other services, engineers
will need to understand the current structure and layout of the site or platform to
address each of the services.
Summarizing the Application Y-Axis
The y-axis of the AKF Application Scale Cube represents separation of work by service or func-
tion within the application.
Y-axis splits are meant to address the issues associated with growth and complexity in code
base and datasets. The intent is to create both fault isolation as well as reduction in response
times for y-axis split transactions.
Y-axis splits can scale transactions, data sizes, and code base sizes. They are most effec-
tive in scaling the size and complexity of your code base. They tend to cost a bit more than x-
axis splits as the engineering team either needs to rewrite services or at the very least disag-
gregate them from the original monolithic application.
The Z-Axis of the AKF Application Scale Cube
The z-axis of the Application Scale Cube is a split based on a value that is “looked
up” or determined at the time of the transaction; most often, this split is based on the
requestor or customer of the transaction. The requestor and the customer may be
completely different people. The requestor, as the name implies, is the person submit-
ptg5994185
THE Z-AXIS OF THE AKF APPLICATION SCALE CUBE 345
ting a request to the product or platform, whereas the customer is the person who
will receive the response or benefit of the request. Note that these are the most com-
mon implementations of the z-axis, but not the only possible implementation. For In
order for the z-axis split to be valuable, it must help partition not only transactions,
but the data necessary to operate on those transactions. A y-axis split helps us reduce
data and complexity by reducing instructions and data necessary to perform a service;
a z-axis split attempts to do the same thing through nonservice oriented segmentation.
To perform a z-axis split, we look for similarities among groups of transactions
across several services. If a z-axis split is performed in isolation of the x- and y-axis,
each split will be a monolithic code base. If N unique splits are identified, it is possi-
ble that each of the N instances will be the same exact code base, but this does not
necessarily need to be the case. We may, for example, decide that we will allow some
number of our N servers to have greater functionality than the remainder of the serv-
ers. This might be the case if we have a “free” section of our services and a “paid”
section of our services. Our paying customers may get greater functionality and as a
result be sent to a separate server or set of servers. The paying code base may then be
a super set of the free code base.
How do we get benefits in a z-axis split if we have the same monolithic code base
across all instances? The answer lay in the activities of the individuals interacting
with those servers and the data necessary to complete those transactions. So many
applications and sites today require extensive caching that it becomes nearly impossi-
ble to cache all the necessary data for all potential transactions. Just as the y-axis split
helped us cache some of this data for unique services, so does the z-axis split help us
cache data for specific groups or classes of transactions biased by user characteristics.
Let’s take AllScale’s customer resource manager (CRM) solution as an example. It
would make a lot of sense that a set of sales personnel within a given company would
have a lot in common and as a result that we might get considerable benefit from
caching data unique to that company within a z-axis split. In the event that a com-
pany is so small that it doesn’t warrant having a single system dedicated to it, we
implement multitenancy and allow multiple small companies to exist on a single
server. We gain the benefit of caching unique to the companies in question while also
leveraging the cost benefits of a multitenant system. Furthermore, we don’t subject
the larger companies to cache misses resulting from infrequent accesses from small
companies that force the larger company data out of the cache.
We also gain the benefit of fault isolation first identified in Chapter 21. When one
of our servers fails, we only impact a portion of our customers. Moreover, we now
have a benefit that allows us to roll out code to a portion of our customer base when-
ever we are releasing new features. This, in turn, allows us to performance test the
code, validate that the code does not create any significant user incidents, and ensure
that the expected benefits of the release are achieved before we roll or push to the
remainder of our clients.
ptg5994185
346 CHAPTER 23 SPLITTING APPLICATIONS FOR SCALE
Because we are splitting transactions across multiple systems, in this particular
case identified by companies, we can achieve a transactional scale similar to that
within the x-axis. Unfortunately, as with the y-axis, we increase our operational com-
plexity somewhat as we now have pools of services performing similar functions for
different clients, requesters, or destinations. And unlike the y-axis, we don’t likely get
the benefit of splitting up our architecture in a service oriented fashion; our engineers
do not necessarily become more proficient with areas of the code just as a result of a
z-axis split. Finally, there is some software cost associated with z-axis splits in that
the code must be able to recognize that requests are not all equivalent for any given
service. Very often, an algorithm to determine where the request should be sent is cre-
ated, or a “lookup” service is created that can determine to what system or pod a
request should be sent.
The benefits of a z-axis split then are that we increase fault isolation, increase
transactional scalability, and increase the cache-ability of objects necessary to com-
plete our transactions. You might also offer different levels of service to different cus-
tomers, though to do so you might need to implement a y-axis split within a z-axis
split. The end results we would expect from these are higher availability, greater scal-
ability, and faster transaction processing times.
The z-axis, however, does not help us as much with code complexity, nor does it
help with time to market. We also add some operational complexity to our produc-
tion environment; we now need to monitor several different systems with similar
code bases performing similar functions for different clients. Configuration files may
differ as a result and systems may not be easily moved once configured depending
upon your implementation.
Because we are leveraging characteristics unique to a group of transactions, we
can also improve our disaster recovery plans by geographically dispersing our ser-
vices. We can, for instance, locate services closer to the clients using or requesting
those services. Thinking back to our sales lead system, we could put several small
companies in one geographic area on a server close to those companies; and for a
large company with several sales offices, we might split that company into several
sales office systems spread across the company and placed near the offices in ques-
tion.
Summarizing the Application Z-Axis
The z-axis of the AKF Application Scale Cube represents separation of work based on
attributes that are looked up or determined at the time of the transaction. Most often, these are
implemented as splits by requestor, customer, or client.
Z-axis splits tend to be the most costly implementation of the three types of splits. Although
software does not necessarily need to be disaggregated into services, it does need to be writ-
ptg5994185
PUTTING IT ALL TOGETHER 347
ten such that unique pods can be implemented. Very often, a lookup service or deterministic
algorithm will need to be written for these types of splits.
Z-axis splits aid in scaling transaction growth, may aid in scaling instruction sets, and aids in
decreasing processing time by limiting the data necessary to perform any transaction. The z-
axis is most effective at scaling growth in customers or clients.
Putting It All Together
We haven’t really modified our original AKF Scale Cube from the introduction within
this chapter, but we have attempted to clarify it from an application perspective. We
did not redefine the axes, but rather focused the previous meaning to the context of
splitting applications for scale.
The observant reader has probably also figured out by now that we are going to
explain why you need multiple axes of scale. To mix things up a bit, we will work
backward through the axes and first explain the problems with implementing them in
isolation.
A z-axis only implementation has several problems when implemented in isola-
tion. Let’s assume the previous case where you make N splits of your customer base
in a sales lead tracking system. Because we are only implementing the z-axis here,
each instance is a single virtual or physical server. If it fails for hardware or software
reasons, the services for that customer or set of customers have become completely
unavailable. That availability problem alone is reason enough for us to implement an
x-axis split for each of our z-axis splits. If we split our customer base N ways along
the z-axis, with each of the N splits having at least 1/Nth of our customers initially,
we would put at least two “cloned” or x-axis servers in each of the N splits. This
ensures that should a server fail we still service the customers in that pod. Reference
Figure 23.2 as we discuss this implementation further.
Figure 23.2 Z- and X-Axis Split
Customers A − F
X-Axis Split
Z-Axis Split
Customers G − N
X-Axis Split
Customers O − Z
X-Axis Split
ptg5994185
348 CHAPTER 23 SPLITTING APPLICATIONS FOR SCALE
It is likely more costly for us to perform continued customer oriented splits to
scale our transactions than it is to simply add servers within one of our customer ori-
ented splits. Operationally, it should be pretty simple, assuming that we do not have
a great deal of state enabled to simply add a cloned system to our service for any
given customer. Therefore, in an effort to reduce overall cost of scale, we will proba-
bly implement a z-axis split with an x-axis split within each z-axis split. We can also
now perform x-axis scale within each of our N number of z-axis pods. If a customer
grows significantly in transactions, we can perform a cost-effective x-axis split (the
addition of more cloned servers) within that customer’s pod.
Finally, as we have previously mentioned, the z-axis split really does not help us
with code complexity. As our functionality increases and the size of our application
grows, performing x-and z-axis splits alone will not allow us to focus and gain expe-
rience on specific features or services. Our time to market will likely suffer. We may
also find that the large monolithic z- and x-axis splits will not help us enough for all
of the functions that need cached data. A single, very active customer, focused on
many of his own clients within our application, may find that a monolithic applica-
tion is just too slow. This would force us to focus more on y-axis splits as well.
The y-axis split has its own set of problems when implemented in isolation. The
first is similar to the problem of the x-axis split in that a single server focused on a
subset of functionality results in the functionality being unavailable when the server
fails. As with the z-axis split, we are going to want to increase our availability by
adding another cloned or x-axis server for each of our functions. We also save money
by adding servers in an x-axis fashion for each of our y-axis splits versus continuing
to split along the y-axis. Rather than modifying the code and further deconstructing
it, we simply add servers into each of our y-axis splits and bypass the cost of further
code modification.
The y-axis split also does not scale as well with customer growth as the z-axis
split. Y-axis splits focus more on the cache-ability of similar functions and work well
when we have an application growing in size and complexity. Imagine, however, that
you have decided to perform a y-axis split of your login functionality and that many
of your client logins happen between 6 AM to 9 AM Pacific Time. Assuming that you
need to cache data to allow for efficient logins, you will likely find that you need to
perform a z-axis split of the login process to gain a higher cache hit ratio. As stated
before, y-axis splits help most with growth in the application and functionality, x-
axis splits are most cost-effective for transaction growth, and z-axis splits aid most in
the growth of customers and users.
As we’ve stated previously, the x-axis approach is often the easiest to implement
and as such is very often the very first type of split within systems or applications. It
scales well with transactions, assuming that the application does not grow in com-
plexity and that the transactions come from a defined base of slowly growing cus-
ptg5994185
PRACTICAL USE OF THE APPLICATION CUBE 349
tomers. As your product becomes more feature rich, you are forced to start looking
at ways to make the system respond more quickly to user requests. You do not want,
for instance, long searches to slow down the average response time of short duration
activities such as logins. To resolve average response time issues caused by competing
functions, you need to implement a y-axis split.
The x-axis also does not handle a growth in customer base elegantly. As your cus-
tomers increase and as the data elements necessary to support them within an appli-
cation increases, you need to find ways to segment these data elements to allow for
maximum cost effective scale such as with y- or z-axis splits.
AKF Application Scale Cube Summary
Here is a summary of the three axes of scale:
• The x-axis represents the distribution of the same work or mirroring of an application
across multiple entities. It is useful for scaling transaction volume cost effectively, but
does not scale well with data volume growth.
• The y-axis represents the distribution and separation of work responsibilities by verb or
action across multiple entities. The y-axis can benefit development time as services are
now implemented separately. It also helps with transaction growth and fault isolation. It
helps to scale data specific to features and functions, but does not greatly benefit cus-
tomer data growth.
• The z-axis represents distribution and segmentation of work by customer, customer
need, location, or value. It can create fault isolation and scale along customer bound-
aries. It does not aid in the growth of data specific to features or functions nor does it aid
in reducing time to market.
Hence, x-axis splits are mirror images of functions, y-axis splits separate applications based
on the work performed, and z-axis splits separate work by customer, location, or some value
specific identifier (like a hash or modulus).
Practical Use of the Application Cube
Let’s examine the practical use of our application cube for three unique purposes.
The first business we will discuss is an ecommerce auction site, the second is
AllScale’s human resources management (HRM) solution, and the third is AllScale’s
back office IT implementation.
ptg5994185
350 CHAPTER 23 SPLITTING APPLICATIONS FOR SCALE
Ecommerce Implementation
The engineering team at AllScale has been hard at work developing ecommerce func-
tionality in addition to its CRM and HRM functionality. The new platform provides
functionality to sell goods, which range from argyle sweaters to ZZ Top CDs.
AllScale intends to sell it all, and it also allows other folks to list their goods for sale
on its site. AllScale’s platform has all the functionality you can imagine, including
searching, browsing, shopping carts, checkout, account and order status functional-
ity, and so on. The platform also offers multiple buying formats from auctions to
fixed price sales.
The AllScale architects ultimately decide that the system is going to be constrained
in three dimensions: transaction growth, functionality growth, and the third dimen-
sion consisting of both catalog growth and customer growth. As such, they are going
to need to rely on all three axes of the AKF Application Scale Cube.
The architects decide that it makes most sense to split the application primarily by
the functions of the site. Most of the major functions that don’t directly rely on cus-
tomer information will get a swim lane of functionality (see Chapter 21). Browsing,
searching, catalog upload, inventory management, and so on and every other verb
that can be performed without needing to know specific information about a particu-
lar customer becomes a branch of functionality within the site and its own code base.
These splits allow these services to grow with transaction volume regardless of cus-
tomer growth as the number of customers isn’t important when delivering the results
of a search, or a catalog upload, and so on.
All applications regarding customers will be split into N pods, where N is a config-
urable number. Each of these pods will host roughly 1/Nth of our customers. This is a
z-axis split of our customer base. Within each of these z-axis splits, the architects are
going to perform y-axis splits of the code base. Login/logout will be its own function,
checkout will be its own function, account status and summary will be its own func-
tion, and so on. Note that AllScale doesn’t have N u M (where M is the number of y-
axis splits and N is the number of z-axis splits) separate code bases here; it is simply
replicating the M code bases across N pods for a total of M new code splits for cus-
tomer functionality. In deciding to split by both the y- and z-axis in this case, AllScale
can scale its number of customers and the amount of code functionality dedicated to
them independently. No single y-lane will need to know about more than 1/Nth the
customers; as a result, caching for things like login information will be much more
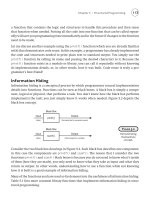
lightweight and much faster. The resulting splits are shown in Figure 23.3.
Finally, AllScale will apply x-axis splits everywhere to scale the number of transac-
tions through any given segmentation. Search is an area about which we are con-
cerned, as AllScale wants very fast searches and is concerned about the response
times. This, however, is more of a data scaling issue, so we will address this in Chap-
ter 24, Splitting Databases for Scale.
ptg5994185
PRACTICAL USE OF THE APPLICATION CUBE 351
Human Resources ERP Implementation
Recall the AllScale HRM solution, which does absolutely everything for HR organi-
zations including recruiting, training, career progression counseling, performance
reviews, succession planning, compensation analysis, termination automation, and so
on. If an HR professional needs it, AllScale does it, all in a SaaS environment. AllScale’s
largest customer happens to be the largest company in the world, FullScale Oil, and
its smallest client is a 20-person startup in New York City, FullScale Attitude.
The architects decide that what they want to build appears to be one large applica-
tion to their customers but with each module capable of growing in complexity without
Figure 23.3 Three Axis Split Example
Customers A − F
Checkout
Checkout
Checkout
X-Axis Split
Z-Axis Split
Customers G − N
X-Axis Split
Customers O − Z
X-Axis Split
Browse
Browse
Browse
X-Axis Split
Y-Axis Split
Y-Axis Split
Y-Axis Split
X-Axis Split
X-Axis Split
Login
Login
Login
X-Axis Split
X-Axis Split
X-Axis Split
ptg5994185
352 CHAPTER 23 SPLITTING APPLICATIONS FOR SCALE
affecting other modules in the system. They also want to be able to work on one or
more modules without taking the system down; as a result, they decide to use the
y-axis of the AKF Application Scale Cube and separate their services by major func-
tionality. Performance and Career Planning, Learning and Education, Compliance
Tracking, Recruiting, Compensation Planning, and Succession Planning all become
modules with other modules scheduled for the future.
The team also recognizes the need to be able to scale its application within a com-
pany and that transactions and personnel will all be impacted by company size. As
such, they will scale using the x-axis to allow for transaction growth and the z-axis to
allow for employee growth. The team employs a configurable number, N, as a modu-
lus to employee number to determine which pod an employee will be sent within any
given company or group of companies.
Back Office IT System
The AllScale architects are asked to design a system to create personalized marketing
emails for its current and future client bases. The team can expect that it will have
several different email campaigns under development or shipping at any given time
and that each of these campaigns will need to select from a diverse mailing list that
includes attributes about many potential and current customers. These attributes are
elements such as age, sex, geographic area, past purchases, and so on.
The list is very large, and the team decides to split it up by classes of data relevant
to each of the existing and potential customers. The team needs to ensure that mail
campaigns launch and finish within a few hours, so they are going to need a fairly
aggressive split of their mail system given the number of mails that we send.
The architects select four elements including recency, frequency, monetization, and
class of purchase as criteria, and the product of these values result in 100 unique clas-
sifications. Each of these classifications contains roughly 1/100th of the people, with
the exception of the customers for whom we have no sales data and therefore just
represent a contact list. This set of customers actually represents the largest group by
population, and for them the team simply splits on contact_id, which is a unique key
within the system. The AllScale architects select a configurable number N for this
split and set N initially to 100. As such, it has 199 unique Z splits: 100 splits for cus-
tomers who have yet purchased anything from AllScale and for whom we have no data,
and 99 splits for all other customers split by a product of their recency, frequency,
monetization (aggregate value), and classification of purchases. These splits corre-
spond primarily to the mail and tracking farms (described in the following section)
but also to the data repositories that we will describe in further detail in Chapter 24.
The y-axis splits then become the functions of the AllScale marketing system. The
team will need a creative development system, a mail sending system, a mail viewing
system, a mail reporting system, and a customer tracking system to view the efficacy
of its campaigns and a data warehouse to handle all past campaign reporting. These
ptg5994185
PRACTICAL USE OF THE APPLICATION CUBE 353
are all y-axis splits to give the system additional scale in transactions and to allow the
team to modify components independent of each other.
Most systems will have at least one extra system for availability, but some will
have multiple clones such as the mail sending system within each of the Z splits.
Observations
You may have noticed that while we use each of the axes in the preceding examples,
the distribution of the axes appears to change by company or implementation. In one
example, the z-axis may be more predominant and in others the Y appears to be the
most predominant split. This is all part of the “Art of Scalability.” Referring back to
the introduction, the determination in the absence of data about where you start in
your scalability initiatives are as much about gut feel as anything else. As you grow
and collect data, you will ultimately, hopefully, determine in advance where you
made incorrect assumptions.
Where to draw the line with y-axis splits is not always easy. If you have tens of
thousands of features or “verbs,” it doesn’t make sense to have tens of thousands
splits. You want to have manageable sizes of code bases in each of your splits but not
so many splits that the absolute number itself becomes unmanageable. You also want
your cache sizes in your production environment to be manageable. Both of these
become considerations for determining where you should perform splits and how
many you should have.
Z-axis splits are a little easier from a design perspective. Ideally, you will simply
design a system that has flexibility built into it. We previously mentioned a config-
urable number N in both the ecommerce and back office IT systems. This number is
what allows us to start splitting application flows by customer within the system. As
we grow, we simply increase N to allow for greater segmentation and to help smooth
load across our production systems. Of course, there is potentially some work in data
storage (where those customers live) that we will discuss in Chapter 24, but we
expect that you can develop tools to help you manage that. The y-axis, unfortunately,
is not so easy to design flexibility into the system.
As always, the x-axis is relatively easy to split and handle because it is always just
a duplicate of its peers. In all of our previous cases, the x-axis is always subordinate
to the y- and z-axis. This is almost always the case when you perform y- and z-axis
splits. To the point, the x-axis becomes relevant within either a y- or z-axis split.
Sometimes, the y- or z-axis, as was the case in more than one of the examples, is sub-
ordinate to the other, but in nearly all cases, the x-axis is subordinate to either y or z
whenever the y or z or both are employed.
What do you do if and when your business contracts? If you’ve split to allow for
aggressive hyper growth and the economy presents your business with a downward
cycle not largely under your control, what do you do? X-axis splits are easy to
unwind as you simply remove the systems you do not need. If those systems are fully