Báo cáo y học: "Comparative sequence analysis reveals an intricate network among REST, CREB and miRNA in mediating neuronal gene expression" pptx
Bạn đang xem bản rút gọn của tài liệu. Xem và tải ngay bản đầy đủ của tài liệu tại đây (400.04 KB, 14 trang )
Open Access
Volume
Wu and Xie
2006 7, Issue 9, Article R85
Research
Jie Wu* and Xiaohui Xie†
comment
Comparative sequence analysis reveals an intricate network among
REST, CREB and miRNA in mediating neuronal gene expression
Addresses: *Department of Biomedical Engineering, Boston University, Boston, Massachusetts 02215, USA. †Broad Institute of MIT and
Harvard, 7 Cambridge Center, Cambridge, Massachusetts 02142, USA.
Correspondence: Xiaohui Xie. Email:
Received: 12 May 2006
Revised: 1 August 2006
Accepted: 26 September 2006
Genome Biology 2006, 7:R85 (doi:10.1186/gb-2006-7-9-r85)
reviews
Published: 26 September 2006
The electronic version of this article is the complete one and can be
found online at />
reports
© 2006 Wu and Xie; licensee BioMed Central Ltd.
This is an open access article distributed under the terms of the Creative Commons Attribution License ( which
permits unrestricted use, distribution, and reproduction in any medium, provided the original work is properly cited.
expression.
Using comparative sequence
Neuronal gene expression controlanalysis, a network among REST, CREB and brain-related miRNAs is propsed to mediate neuronal gene
Abstract
Regulation of gene expression is critical for nervous system
development and function. The nervous system relies on a
complex network of signaling molecules and regulators to
orchestrate a robust gene expression program that leads to
the orderly acquisition and maintenance of neuronal identity.
Identifying these regulators and their target genes is essential
for understanding the regulation of neuronal genes and
Genome Biology 2006, 7:R85
information
Background
interactions
Conclusion: The expression of neuronal genes and neuronal identity are controlled by multiple
factors, including transcriptional regulation through REST and post-transcriptional modification by
several brain-related miRNAs. We demonstrate that these different levels of regulation are
coordinated through extensive feedbacks, and propose a network among REST, CREB proteins and
the brain-related miRNAs as a robust program for mediating neuronal gene expression.
refereed research
Results: Using comparative sequence analysis, here we report the identification of 895 sites
(NRSE) as the putative targets of REST. A set of the identified NRSE sites is present in the vicinity
of the miRNA genes that are specifically expressed in brain-related tissues, suggesting the
transcriptional regulation of these miRNAs by REST. We have further identified target genes of
these miRNAs, and discovered that REST and its cofactor complex are targets of multiple brainrelated miRNAs including miR-124a, miR-9 and miR-132. Given the role of both REST and miRNA
as repressors, these findings point to a double-negative feedback loop between REST and the
miRNAs in stabilizing and maintaining neuronal gene expression. Additionally, we find that the
brain-related miRNA genes are highly enriched with evolutionarily conserved cAMP response
elements (CRE) in their regulatory regions, implicating the role of CREB in the positive regulation
of these miRNAs.
deposited research
Background: Two distinct classes of regulators have been implicated in regulating neuronal gene
expression and mediating neuronal identity: transcription factors such as REST/NRSF (RE1 silencing
transcription factor) and CREB (cAMP response element-binding protein), and microRNAs
(miRNAs). How these two classes of regulators act together to mediate neuronal gene expression
is unclear.
R85.2 Genome Biology 2006,
Volume 7, Issue 9, Article R85
Wu and Xie
elucidating the role of these regulators in neural development
and function.
The transcriptional repressor REST (RE1 silencing transcription factor, also called neuron-restrictive silencer factor or
NRSF) plays a fundamental role in regulating neuronal gene
expression and promoting neuronal fate [1,2]. REST contains
a zinc-finger DNA-binding domain and two repressor
domains interacting with corepressors CoREST and mSin3a.
The corepressors additionally recruit the methyl DNA-binding protein MeCP2, histone deacetylases (HDAC), and other
silencing machinery, which alter the conformation of chromatin resulting in a compact and inactive state [3-6]. REST is
known to target many neuronal genes, and is pivotal in
restricting their expression exclusively in neuronal tissues by
repressing their expression in cells outside the nervous system. Recent work also points to REST as a key regulator in the
transition from embryonic stem cells to neural progenitors
and from neural progenitors to neurons [7]. The role of REST
in nervous system development is intriguingly manifested by
its expression, which is lower in neural stem/progenitor cells
than in pluripotent stem cells, and becomes minimal in postmitotic neurons [7]. The expression of REST is shown to be
regulated by retinoic acid; however, other forms of regulatory
mechanisms are unknown.
Another important class of regulators implicated in neuronal
gene expression control and neuronal fate determination is
the microRNA (miRNA) [8-10]. MiRNAs are an abundant
class of endogenous approximately 22-nucleotide RNAs that
repress gene expression post-transcriptionally. Hundreds of
miRNAs have been identified in almost all metazoans including worm, fly, and mammals, and are believed to regulate
thousands of genes by virtue of base pairing to 3' untranslated
regions (3'UTRs) of the messages. Many of the characterized
miRNAs are involved in developmental regulation, including
the timing and neuronal asymmetry in worm; growth control
and apoptosis in fly; brain morphogenesis in zebrafish; and
hematopoetic and adipocyte differentiation, cardiomyocyte
development, and dendritic spine development in mammals
[8,11,12]. Based on data from a recent survey [13], we note
that the human genome contains about 326 miRNA genes,
many of which are highly or specifically expressed in neural
tissues [14]. The function of the brain-related miRNAs and
the mechanisms underlying their transcriptional control are
beginning to emerge [12,15-17].
In addition to REST and miRNAs, many other classes of regulators might also be involved in controlling neuronal gene
expression. This control could be carried out through a variety of mechanisms, such as changing chromatin state, affecting mRNA stability and transport, and post-translational
modifications. Here we focus specifically on regulation
through REST and miRNAs.
/>
To gain a better understanding of how REST and miRNAs
regulate neuronal gene expression, we took the initial step of
producing a reliable list of genes targeted by REST and several brain-related miRNAs using computational approaches.
A list of these target genes should be informative in
unraveling the function of these regulators. Moreover, we
anticipate that a global picture of the target genes may provide a clue as to how REST and miRNAs act together to coordinate neuronal gene expression programs and promote
neuronal identity.
REST represses target genes by binding to an approximately
21-nucleotide binding site known as NRSE (neuron-restrictive silencer element, also called RE1), which is present in the
regulatory regions of target genes. Previously, several
genome-wide analyses of NRSE sites have been carried out
[6,18,19]. These analyses used pattern-matching algorithms
to search for sequences matching a consensus derived from
known REST binding sites. The most recent work identified
1,892 sites in the human genome [19]. However, there are
several factors limiting the utilities of the pattern-matching
algorithms. Most notably, transcriptional factors can bind
with variable affinities to sequences that are allowed to vary
at certain positions. Consequently, methods based on consensus sequence matching are likely to miss target sites with
weaker binding affinities. Indeed, it has been noted that both
L1CAM and SNAP25 genes contain an experimentally validated NRSE site that diverges from the NRSE consensus [19],
and was not identified in the previous analyses. In addition,
even sequences perfectly matching the NRSE consensus
could occur purely by chance, and therefore do not necessarily imply that they are functional. Given the vast size of the
human genome, random matches could significantly add to
the false positive rate of a prediction. For example, in the
most recent analysis, it was estimated that 41% of the 1,892
predicted sites occur purely by chance, and likely represent
false positives [19].
We have developed a method to systematically identify candidate NRSE sites in the human genome without these two
main limitations of the previous methods. To address the first
limitation, we utilized a profile-based approach, which computes the overall binding affinity of a site to REST without
requiring strict matching of each base to the NRSE consensus. To reduce false positives, we rely on comparative
sequence analysis to identify only sites that are conserved in
orthologous human, mouse, rat and dog regions [20-23].
MiRNAs repress gene expression by base-pairing to the messages of protein-coding genes for translational repression or
message degradation. The pairing of miRNA seeds (nucleotides 2 to 7 of the miRNAs) to messages is necessary and
appears sufficient for miRNA regulation [24-26]. This enables the prediction of miRNA targets by searching for evolutionarily conserved 7-nucleotide matches to miRNA seeds in
the 3'UTRs of the protein-coding genes [21,27-30]. We have
Genome Biology 2006, 7:R85
/>
TCAGCACC GGACAG
A
G
21
18
20
G
T
19
17
9
15
8
16
7
12
6
13
6
5
11
5
4
9
4
3
A
T
A
T
G
T
10
3
1
2
C
G
A
G
C
C
0.3
0.2
0.1
0
1
10 11 12 13 14 15 16 17 18 19 20 21
Position
(d)
30
0.04
20
Probability density
0.03
10
0.02
10
15
20
25
30
35
Log−odds score
0.01
0
−40
−20
Log−odds score
0
20
Additionally, we have sought to understand the mechanisms
controlling the expression of brain-related miRNAs. To this
end, we have used comparative analysis to identify sequence
motifs that are enriched and conserved in the regulatory
regions of these miRNAs across several mammals.
Identification of 895 NRSE sites in human with a false
positive rate of 3.4%
The next step was to examine orthologous sequences of these
sites in other mammals and filter the list to 1,498 sites based
on two criteria: (a) the log-odds scores at the orthologous
sites of mouse, rat and dog are also greater than 5, and (b) the
number of bases mutated from the corresponding human
sequence at the core positions is fewer than two in any of the
orthologous sites. The criterion (b) is based on the conservation properties of the known NRSE sites described above.
Genome Biology 2006, 7:R85
information
First, we curated from the literature a list of experimentally
validated NRSE sites in the human genome [18,19], including
38 sites with site lengths of 21 nucleotides (see supplementary
table 1 in Additional data file 1). Based on the 38 known sites,
we derived a profile (also called a position weight matrix) on
the distribution of different nucleotides at each position of
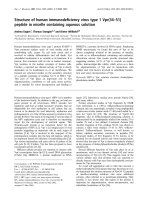
NRSE. The profile shows an uneven contribution to the binding of the REST protein from each of the 21 positions (Figure
1a). The positions 2 to 9 and 12 to 17 nucleotides, which will
interactions
Results
We then used the profile to search the entire human genome
for sites that are better described by the profile than other
background models. For each candidate 21-nucleotide window in the genome, we calculated a log-odds score quantifying how well the site fits to the NRSE profile (see Materials
and methods). The overall distribution of the log-odds scores
computed over the regulatory regions of all protein-coding
genes in humans is shown in Figure 1c, which follows a normal distribution (mean = -37; standard deviation (SD) = 10).
We were interested in sites with scores significantly higher
than the bulk of the overall distribution: over the entire
human genome, we identified 171,152 sites with log-odds
scores above 5 (corresponding to 4.2 SDs away from the
mean).
refereed research
generated a list of predicted target genes for several brainrelated miRNAs by searching for seed-matches perfectly conserved in mammalian 3'UTRs.
deposited research
Figure 1
NRSE profile and distribution of log-odds score
NRSE profile and distribution of log-odds score. (a) Position weight
matrix of NRSE at 21 positions constructed from 38 known NRSE sites.
The y-axis represents the information content at each position. (b) The
average number of bases mutated in orthologous regions of mouse, rat or
dog at each position of the NRSE profile, when the nonhuman sequences
are compared with the corresponding human site. The number is
calculated based on the 37 known NRSE sites that can be aligned in the
four species. (c) Distribution of background NRSE log-odds score
calculated over regulatory regions (from upstream 5 kb to downstream 5
kb around each transcriptional start) of all human protein-coding genes.
(d) Distribution of NRSE log-odds score on 895 identified NRSE sites.
reports
−60
Next we examined the conservation properties of the known
NRSE sites. To carry this out, we extracted orthologous
regions of these sites in three other fully sequenced mammalian genomes (mouse, rat and dog) [31-34], and generated an
alignment for each site in the four species (see supplementary
table 1 in Additional data file 1). The alignment data show that
the NRSE sites are highly conserved across the mammalian
lineages: out of the 38 reference sites, only one cannot be
detected in other mammals. We further examined the conservation of NRSE by counting the number of bases mutated in
other species from the aligned human site at each of its 21
positions. Similar to the profile, conservation levels at different NRSE positions are highly non-uniform (Figure 1b). However, the conservation levels at different positions are
remarkably well correlated with the NRSE profile: highly constrained positions show much stronger conservation in
orthologous species than those with higher variability. The
core positions are highly constrained and permit few mutations. Among the 37 aligned sites, all core positions contain
fewer than two mutations and no insertions or deletions in
any of the other species when compared with a human site. By
contrast, in a random control, only 0.47 out of the 38 sites are
expected to be called conserved with the same criteria. Therefore, the functional NRSE sites demonstrate a 78-fold
increase of evolutionary conservation, suggesting the usefulness of evolutionary conservation as an efficient tool for
detecting NRSE sites.
reviews
(c)
Wu and Xie R85.3
be referred as 'core positions' of NRSE, are much less variable
than the remaining positions.
C
C
A
T
G
G
T
A
G
G
G
2
Mutation rate
(b)
C
A
T
A
C
C
14
T
A
0
7
1
Volume 7, Issue 9, Article R85
comment
Bits
2
8
(a)
Genome Biology 2006,
R85.4 Genome Biology 2006,
Volume 7, Issue 9, Article R85
Wu and Xie
We then estimated the number of sites that could be discovered purely by chance. For this purpose, we generated a
cohort of control profiles with the same base composition and
the same information contents as those of the NRSE profile,
and searched the instances of the control profiles using the
same procedure. Only 328 sites were found for the control
profiles, suggesting that approximately 78% of the 1,498 sites
are likely to be bona fide NRSE sites. To balance the need for
an even smaller rate of false positives, we further identified
895 sites with log-odds scores above 10 in all aligned species.
Only 30 sites are expected by chance, suggesting a false positive rate of 3.4%. The distribution on the log-odds scores of
these sites falls distinctly to the far right of the bulk of the
background distribution (Figure 1c). These sites are distributed across all chromosomes of the human genome and
include 37 out of the 38 known NRSE sites that we have
curated.
Next we identified the nearest protein-coding genes located
around each of the 895 candidate NRSE sites. Over 60% of
these genes have NRSE sites within 20 kb of their transcriptional starts (Supplementary figure 1 in Additional data file 1),
while a few NRSE sites are located more than 150 kb away
from genes, suggesting the possibility of long-range interactions. To study the properties of these genes further, we generated a list of 566 genes that contain at least one NRSE site
within 100 kb of their transcriptional start sites (see supplementary website [35]). Interestingly, 75 (13.2%) of the genes
contain more than one NRSE site in their regulatory regions.
For instance, NSF (N-ethylmaleimide-sensitive factor) contains as many as four NRSE sites in its regulatory region in a
segment of sequence of less than 100 base pairs; another gene
NPAS4 (neuronal PAS domain protein 4) contains three
NRSE sites spread over a region of 3 kb.
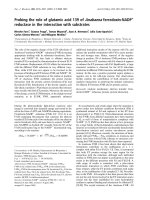
If the predicted genes are bona fide REST targets, we would
expect that the expression of these genes should inversely
correlate with the expression of REST. To test this, we examined the expression of these genes and REST across a battery
of mouse tissues in a dataset generated previously [36]. The
tissue gene expression dataset contains 409 of the predicted
target genes. It confirms that REST is expressed at low levels
in brain-related tissues, and at much higher levels in nonneuronal tissues (Figure 2a). In contrast to the expression
profile of REST, most of the predicted REST target genes are
specifically expressed in brain-related tissues (Figure 2b). We
calculated the correlation coefficient between REST and each
/>
of the predicted target genes: the mean correlation coefficient
for the genes shown in Figure 2b is -0.21, which is much lower
(P value = 2.2e-16) than what is expected by chance (Figure
2c). Using a stringent threshold (See Materials and methods),
we screened out 188 (46% of all 409 genes, 5.4-fold enrichment) genes that demonstrate specific expression in brainrelated tissues. A list of these genes and their expression profiles across different tissues is shown in Additional data file 1,
supplementary figure 2.
We then examined the functional annotation of all 566 predicted REST target genes. Specifically we were aiming to test
if these target genes are enriched in any of the functional categories specified in gene ontology. Based on an annotation
provided in [37], we found that the gene set is highly enriched
with genes implicated in nervous system development and
function (Figure 3). For example, 51 genes (5.2-fold enrichment, P value = 1.3e-22) encode ion channel activity, and 28
genes (7.3-fold enrichment, P value = 6.6e-17) are involved in
synaptic functions. Interestingly, the list also contains a large
number of genes (60, 4.4-fold enrichment and P value = 2.1e22) implicated in nervous system development; 15 genes are
involved in neuronal differentiation, which include a set of
important transcription factors such as NeuroD1, NeuroD2,
NeuroD4, LMX1A, SOX2 and DLX6.
However, we also observed some genes that do not seem to
encode obvious neural-specific functions. This is consistent
with what we observed when examining gene expression patterns for these genes (Figure 2b): a significant portion of them
show specific expression in non-neuronal tissues such as
brown fat, pancreas, spleen and thyroid (Figure 2b). Interestingly, in most of the tissues the expression of REST is also low
(Figure 2a), consistent with the role of REST as a
transcriptional repressor. The extent to which REST contributes to the function of other cell types is unclear. A recent
study identified REST as a tumor suppressor gene in epithelia
cells [38]. Together with our findings, this may suggest that
REST could potentially regulate a set of genes not necessarily
specific to neuronal functions. Alternatively, the observed
expression of some REST target genes in non-neuronal tissues might be due to other confounding factors, such as the
heterogeneous cell population in these tissues, added levels of
regulation caused by transcriptional regulators which themselves are targeted by REST, and the potential regulation by
miRNAs, which we will discuss in more detail later.
Figure 2 (see following page)
Gene expression patterns of predicted REST targets in 61 mouse tissues
Gene expression patterns of predicted REST targets in 61 mouse tissues. (a) Expression of gene REST in different tissues. (b) Expression of predicted REST
targets. Only 80 genes with top NRSE log-odds scores are shown. The tissues in (a) are arranged in the same order as those in (b). The genes shown in (b)
are clustered based on hierarchical clustering such that genes sharing similar expression patterns are grouped together. (c) Mean correlation coefficient
between REST and each of the genes shown in (b). Also shown is the distribution of these values when the genes in (b) are randomly chosen.
Genome Biology 2006, 7:R85
/>
Genome Biology 2006,
(a)
Volume 7, Issue 9, Article R85
Wu and Xie R85.5
Expression of REST in different tissues
comment
4000
3000
2000
1000
refereed research
(c)
deposited research
−2 0 2 4 6
reports
Pou4f3
Mtap1b
Htr3a
Fbxo2
Nefh
Sult4a1
Kcnab2
1500016O10Rik
Cacna1b
Tmh s
Chrnb2
Ap3b2
Nxph1
Bcan
Camta1
Hn t
Slc12a5
Ina
Cacna2d2
Grin1
Cacng7
Ptprn
Aplp1
Tmem2 8
Gria2
Bai2
Cspg3
Syn1
Ppp2r2c
Syt7
Garnl4
Pdyn
Unc5d
Cacna2d3
St8sia3
Slc8a2
Bdnf
Ptk2b
Lhx5
Cacna1a
Kirrel3
Gria4
Neurod2
Nptx1
Phf21b
C1ql2
Syt2
Glra1
Rph3a
Chga
Lhx3
Chgb
Kcnh2
Fgf14
Chd5
Tbc1d21
Cacna1h
Gpr19
Ptprh
Pctk3
Syt6
Npas4
Scrt1
Pvrl1
Ttyh2
Crhr2
Loxhd1
Grik2
Ephb2
Drd3
Slco2b1
Gpr26
4930535E21Rik
Cdk5r2
Slit1
Ac d
Barhl1
Lin28
Osbp2
Tmed3
reviews
(b)
Preoptic
Substantia nigra
Amygdala
Frontal cortex
Olfactory bul
b
Pituitary
Spinal cord lower
Cerebral cortex
Hypothalamus
Hippocampus
Spinal cord upper
Cerebellum
Dorsal root ganglia
Dorsal striatum
Trigeminal
Brown fat
Salivary gland
Pancreas
Stomach
Liver
Medial olfactory epithelium
Skeletal muscle
Small intestine
Tongue
Testis
Spleen
Bonemarrow
Thyroi
d
Retina
Embryo day 10.5
Vomeralnasal organ
BonE
Large intestine
Mammary gland (lact)
Epidermis
Blastocysts
Heart
Embryo day 9.5
Embryo day 8.5
Digits
Prostate
Lymphnode
Snout epidermis
Cd8+t−cells
Embryo day 7.5
Adrenalgland
Kidney
Lung
Umbilical cord
Placenta
Adipose tissue
Cd4+t−cells
Bladder
Uterus
Fertilized egg
Embryo day 6.5
Ovary
Trachea
Oocyte
B220+ b−cells
Thymus
0
Correlation of gene expression betwen REST and its target genes
Distribution of correlation coefficient
between REST and random gene sets
interactions
300
250
200
150
REST target genes
100
0
−0.2
−0.1
0
0.1
Correlation coefficient
Figure 2 (see legend on previous page)
Genome Biology 2006, 7:R85
0.2
information
50
R85.6 Genome Biology 2006,
Volume 7, Issue 9, Article R85
Wu and Xie
/>
of protein-coding genes, which themselves are predicted
REST targets. It is known that miRNAs located inside protein-coding genes are often cotranscribed with the host, and
spliced out only after transcription. The set of miRNAs
include miR-153 within PTPRN, miR-346 within glutamate
receptor GRID1, and miR-218 within SLIT3.
Nervous system development
Ion transport
Ion channel activity
Synaptic transmission
Potassium ion transport
Synapse
Ligand−gated ion channel activity
Observed
Expected
Central nervous system development
Neurogenesis
Neuron differentiation
Sodium ion transport
Excitatory ligand−gated ion channel
Neurotransmitter receptor activity
Neurite morphogenesis
Synaptic vesicle
Axonogenesis
Calcium ion transport
Glutamate receptor activity
Exocytosis
Regulation of neurotransmitter levels
Neurotransmitter transport
Axon guidance
Learning and memory
0
10
20
30
40
50
60
Number of genes
Figure 3functional categories for predicted REST target genes
Enriched
Enriched functional categories for predicted REST target genes. Each row
represents one function category, and shows the observed number of
REST target genes contained in that category and the number of genes
expected purely by chance.
Thus, using a profile constructed from 38 known NRSE sites
and requiring evolutionary conservation in other mammalian
species, we have identified 895 sites in the human genome
with an estimated false positive rate of 3.4%. We have identified protein-coding genes near these elements, and found that
most of these genes are expressed specifically in neuronal
tissues.
Brain-related miRNAs in the vicinity of the NRSE sites
We noticed that there is a set of miRNAs that are located in
close proximity to the predicted 895 NRSE sites in the human
genome (Table 1). This includes 10 miRNA genes that are
located within 25 kb of at least one NRSE site, where no protein-coding genes can be found nearby. Three of the miRNAs,
miR-124a, miR-9 and miR-132, have further experimental
support for targeting by REST, as demonstrated in a chromatin immunoprecipitation analysis by Conaco et al. [39]. Additionally, we discovered that miR-29a, miR-29b and miR-135b
are also located in the vicinity of the NRSE sites. All these 10
miRNA genes are located in intergenic regions, and are transcribed with their own promoters. We also found that there is
a set of miRNA genes likely regulated by REST indirectly
through the promoters of protein-coding genes that host
these miRNAs. These miRNA genes are located in the introns
Overall, we identified 16 miRNA genes that are potentially
regulated by REST (Table 1) directly or indirectly through
their protein-coding hosts. Interestingly, most of these miRNAs are expressed in the brain, and some of them show brainspecific/enriched expression patterns. In a recent survey of
several miRNA expression-profiling studies, Cao et al. generated a list of 34 miRNAs that demonstrate brain-specific/
enriched expression in at least one study [14]. The 16 miRNA
genes we identified correspond to 13 unique miRNA mature
products. Out of the 13 miRNAs, eight (62%) are contained in
the list of 34 brain-specific/enriched miRNAs summarized by
Cao et al., which is about sixfold enrichment when compared
with what is expected by chance (34 out of 319 all miRNAs,
10.6%). Among the six miRNAs not included in the list of 34
brain-related miRNAs, mir-29 has been demonstrated to
show dynamic expression patterns during brain development, and is strongly expressed in glial cells during neural cell
specification [14,40]; mir-346, mir-95 and mir-455 are contained in the introns of (and share the same strand as) their
protein-coding hosts, which themselves are specifically
expressed in brain-related tissues (supplementary figure 5 in
Additional data file 1). It is unclear how these miRNAs and
their host genes appear to demonstrate different expression
patterns.
In summary, this suggests that similar to neuronal genes, a
set of brain-related miRNAs are likely under the control of
REST as well. REST might play an important role in repressing the expression of these miRNAs in cells outside the nervous system.
Identification of target genes for each of the brainrelated miRNAs
MiRNAs have been suggested to regulate the expression of
thousands of genes. Our next step was to seek to identify
genes that are targeted by the set of brain-related miRNAs
mentioned above. We used an approach similar to previous
analyses [21,27], and identified candidate targets by searching for conserved matches of the miRNA seeds (2 to 7 nucleotides of the miRNA) in the 3'UTRs of the protein-coding
genes. To reduce the rate of false positives, we required the
seed to be conserved not only in eutherian mammals as used
in the previous analysis, but also in marsupials. For this purpose, we first generated an aligned 3'UTR database in the
orthologous regions of the human, mouse, rat, dog and opossum genomes (HMRDO). Then we searched the aligned
3'UTRs for conserved 7-nucleotide sequences that could form
a perfect Watson-Crick pairing to each of the miRNA seeds.
This effort lead to hundreds of predicted targets for the brain-
Genome Biology 2006, 7:R85
/>
Genome Biology 2006,
Volume 7, Issue 9, Article R85
Wu and Xie R85.7
Table 1
A list of miRNAs near predicted NRSE elements in the human genome
NRSE sequence
mir-124a-1
mir-124a-2
TTCAGTACCGAAGACAGCGCCC
chr8:9820071-9820092
-21721
-
ATCAAGACCATGGACAGCGAAC
chr8:65450519-65450540
-3795
-
mir-124a-3
TTCAACACCATGGACAGCGGAT
chr20:61277903-61277924
-2437
-
mir-9-1
TCCAGCACCACGGACAGCTCCC
chr1:153197524-153197545
5749
-
mir-9-3
CTCAGCACCATGGCCAGGGCCC
chr15:87709202-87709223
-3094
-
mir-132
ATCAGCACCGCGGACAGCGGCG
chr17:1900204-1900225
-202
-
mir-212
ATCAGCACCGCGGACAGCGGCG
chr17:1900204-1900225
165
-
mir-29a
TTCAGCACCATGGTCAGAGCCA
chr7:130007654-130007675
11117
-
mir-29b-1
TTCAGCACCATGGTCAGAGCCA
chr7:130007654-130007675
11838
-
mir-135b
TTCAGCACCTAGGACAGGGCCC
chr1:202159913-202159934
-10778
-
mir-153-1
TTCAGCACCGCGGACAGCGCCA
chr2:219998545-219998566
1060
PTPRN
mir-346
ATCAGTACCTCGGACAGCGCCA
chr10:88056588-88056609
59621
GRID1
mir-218-2
TTCAGAGCCCTGGCCATAGCCA
chr5:168520831-168520852
139703
SLIT3
mir-139
TTCAGCACCCTGGAGAGAGGCC
chr11:72065649-72065670
-2610
PDE2A
mir-95
TTCAGAACCAAGGCCACCTTGG
chr4:8205631-8205652
72958
ABLIM2
mir-455
CTCAGGACTCTGGACAGCTGTT
chr9:114005656-114005677
7873
COL27A1
As to the REST itself, our initial analysis did not identify any
miRNA that could bind to its 3'UTR. However, a closer examGenome Biology 2006, 7:R85
information
Interestingly, the miRNA target list includes several proteins
forming the core REST complex, such as MeCP2 and CoREST. For example, MeCP2 is targeted by numerous brain-specific miRNAs including miR-132, miR-212, miR-9*, miR-218,
and miR-124a. Similarly, corepressor CoREST is targeted by
miR-124a, miR-218, miR-135b, and miR-153 (Figure 4).
We notice that the 3'UTR of the REST also harbors predicted
target sites for several miRNAs that do not seem to have obvious neuronal-specific functions. Out of the seven unique target sites (conserved in HMRDO), three sites are not contained
in the list of 34 brain-specific/enriched miRNAs curated by
Cao et al. [14], including one site targeted by mir-93 family,
one site targeted by mir-25 family, and one site targeted by
mir-377. Both mir-93 and mir-25 are enriched in non-neuronal tissues such as spleen and thymus [41]. This seems to
reinforce the observation of expression patterns for the predicted protein-coding targets of REST, where we also noticed
a set of target genes specifically expressed in non-neuronal
tissues (Figure 2). We speculate that REST might be involved
in the regulation of genes outside the nervous systems.
interactions
Evidence for a double-negative feedback loop between
REST complex and brain-related miRNAs
Based on the new 3'UTR transcript, we performed the target
prediction again and discovered that REST itself is also targeted by several brain-related miRNAs including miR-9,
miR-29a, and miR-153. Together with the discovery of regulation by REST on these miRNAs, this suggests the existence
of an extensive double feedback loops between the REST
complex and the brain-related miRNAs.
refereed research
We examined the expression of the predicted target genes in
different mouse tissues. The expression profile of the predicted target genes for each of the miRNAs across different
tissues is shown in the supplementary website [35]. Interestingly, we noticed that the brain-related miRNAs target many
genes that are highly transcribed in neural tissues (supplementary figure 3 in Additional data file 1). For instance,
among 191 genes targeted by mir-124a that have been profiled
across different tissues, 45 (23.6%) are specifically expressed
in brain-related tissues, which is 2.8-fold enrichment of that
which would be expected by chance (8.54%). The enrichment
also holds true for mir-9 in that 25.8% of its target genes show
brain-specific expression (threefold enrichment). The coexistence of the predicted target genes and the miRNAs in the
same tissues suggests that the brain-related miRNAs are
likely involved in extensive regulation of a large number of
neuronal genes.
ination indicates that gene REST harbors a much longer
3'UTR transcript, not annotated by any gene prediction programs (Additional data file 1, supplementary figure 4). This
longer 3'UTR is supported by three pieces of evidence: 1)
multiple ESTs detected in this region; 2) high levels of conservation across all mammalian species, and even chicken; and
3) a perfectly conserved poly-adenylation site (AATAAA) in
all mammals at the end of the new transcript.
deposited research
related miRNAs, including 315 targets for miR-124a, 273 targets for miR-9, and 80 targets for miR-132. The complete list
of predicted target genes for each of the brain-related miRNAs can be viewed at the supplementary website [35].
Host gene
reports
Distance (bp)
reviews
Coordinate (hg17)
comment
miRNA
R85.8 Genome Biology 2006,
Volume 7, Issue 9, Article R85
Wu and Xie
/>
CRE-binding proteins
mir-132/212
mir-9*
mir-218
mir-124a
MeCP2
mir-135a/135b
CoREST
mir-153
REST/NRSF
mir-29a/29b
mir-9
Retinoic acid
REST Complex
NeuroD1
LMX1A
ASCL1/MASH1
LHX2
LHX3
DLX6
LHX5
NeuroD2
BMP4
BMP2
SOX2
HOXD11
SOX5
SOX14
NeuroD4
POU2F2
…
BDNF
REST target genes
Schematic diagram of the interactions among REST, CREB and miRNAs
Figure 4
Schematic diagram of the interactions among REST, CREB and miRNAs. The three classes of regulators are represented by different colors, with the REST
complex shown in blue, miRNAs shown in orange, and CREB family proteins shown in green. A list of REST target genes is shown in light blue. Positive
interactions are indicated with solid lines with arrows, while negative interactions are denoted with dotted lines with filled circles.
cAMP response element binding protein (CREB) is a
potential positive regulator of the brain-related
miRNAs
Next we sought to understand the regulatory machinery controlling the expression of the set of brain-related miRNAs.
Besides the negative regulation by REST, we are particularly
interested in factors that positively regulate the expression of
these miRNAs. Given the scarcity of data on the regulation of
miRNA in general, we decided to take an unbiased approach
to look for short sequence motifs enriched in the regulatory
regions of these miRNAs.
Since few primary transcripts of the miRNA genes are available, we decided to examine a relatively big region (from
upstream 10 kb to downstream 5 kb) around each of the
miRNAs. On the other hand, however, using big regions significantly increases the difficulty of detecting any enriched
motifs. We therefore resorted to comparative sequence analysis again, by searching only for sequence motifs present in
aligned regions of the four mammals. For this purpose, we
generated a list of all 7-nucleotide motifs, and for each motif
we counted the number of conserved and total instances in
those regions, and computed a score quantifying the enrichment of the conserved instances (see Materials and methods
section. The analysis yielded 35 motifs that are significantly
enriched in these regions with a P value less than 10-6 (Table
2). The top motif is GACGTCA, which is a consensus cAMP
response element (CRE) recognized by CREB, a basic leucine
zipper transcription factor. We repeated the motif discovery
using 6-mer and 8-mer motifs, and consistently identified the
CRE element as the most significant motif. For the ten
miRNA genes (Table 1) predicted to be directly regulated by
REST, we found nine containing a conserved CRE site nearby.
This set of miRNAs includes miR-124a, miR-9, miR-29a/29b,
and miR-132 (Table 3, Figure 4). Although this association is
purely computational, a recent study demonstrated
experimentally that one of these miRNAs, miR-132, is
Genome Biology 2006, 7:R85
/>
Genome Biology 2006,
Volume 7, Issue 9, Article R85
Wu and Xie R85.9
Table 2
Enriched motifs in the regulatory regions of brain-related miRNAs
Conserved Num Total number
Conservation rate Neutral conservation rate Z-score
Factor*
Factor consensus†
Similarity score‡
20
33
0.61
0.069
11.7
CREB
TGACGTCA
0.95
CCATCTG
31
127
0.24
0.058
8.7
E47
AMCATCTGTT
0.93
ATAACCG
8
11
0.73
0.069
8.3
AGACGCG
8
12
0.67
0.069
7.9
TGAGTCA
20
83
0.24
0.058
6.9
Bach2
SRTGAGTCANC
0.97
AACAAAG
22
107
0.21
0.058
6.3
LEF-1
SWWCAAAGGG
0.81
AGATAAC
14
54
0.26
0.058
6.1
GATA-1
CWGATAACA
0.89
GCAGCTG
29
183
0.16
0.058
5.6
LBP-1
SCAGCTG
0.94
ATGCGCA
8
20
0.40
0.069
5.6
CCTTTGT
17
82
0.21
0.058
5.6
LEF-1
CCCTTTGWWS
0.86
ACAGCAA
18
90
0.20
0.058
5.6
AhR
CACGCNA
0.86
17
84
0.20
0.058
5.5
CTGCCAG
28
181
0.16
0.058
5.4
GCGCCAT
7
17
0.41
0.069
5.4
CGCACGC
7
17
0.41
0.069
5.4
GGTGCTA
11
44
0.25
0.058
5.3
CAATAAA
19
107
0.18
0.058
5.1
GCGCGTC
8
23
0.35
0.069
5.1
GTCTGTC
13
61
0.21
0.058
5.0
SMAD3
TGTCTGTCT
0.89
ATTAAGG
13
61
0.21
0.058
5.0
Nkx2-5
CAATTAWG
0.82
TGACAAG
13
63
0.21
0.058
reports
ATGGCTT
reviews
GACGTCA
comment
Motif
4.9
12
56
0.21
0.058
4.9
GGGATTA
10
42
0.24
0.058
4.8
PITX2
YTGGGATTANW
0.93
ATGCTAA
11
49
0.22
0.058
4.8
POU3F2
TTATGYTAAT
0.82
GCACAAA
13
64
0.20
0.058
4.8
0.88
CCACCTG
22
144
0.15
0.058
4.7
MyoD
TNCNNCACCTG
AATTAAA
21
135
0.16
0.058
4.7
NKX6-1
AACCAATTAAAW 0.93
17
99
0.17
0.058
4.7
Oct1
TATGCAAAT
0.93
CTAATTG
8
31
0.26
0.058
4.6
S8
GNTAATTRR
0.86
CGCTGAC
7
21
0.33
0.069
4.6
CACCAGG
18
110
0.16
0.058
4.6
TCAATAA
13
68
0.19
0.058
4.6
HNF-6
HWAAATCAATAW 0.8
TTTGCAT
17
102
0.17
0.058
4.6
Oct1
ATTTGCATA
0.96
*Transcription factors from Transfac database. †Known consensus in Transfac database that is similar to the 7-mer. ‡Measure the similarity between
the 7-mer and the Transfac factor consensus. The score ranges from 0 to 1, with 1 for two identical consensus sequences.
In addition to CREB, we also identified several other potential
regulators such as E47, SMAD3, POU3F2, and MYOD. For
instance, besides REST and CREB, miR-9-3 is predicted to be
regulated by SMAD3, OCT1, and POU3F2 (Figure 5a), and
miR-132 is predicted to be regulated by MYOD and MEF2
(Figure 5b). Interestingly, a recent study shows that MEF2
and MYOD control the expression of another miRNA, miR-1,
and play an important role in regulating cardiomyocyte differentiation [11]. As well as being expressed in muscle tissues,
MEF2 is also highly expressed in brain, where it plays an
important role in controlling postsynaptic differentiation and
in suppressing excitatory synapse number [43]. It would be
Thus, we have identified several transcription factors that
potentially regulate the expression of the brain-related miRNAs with CREB being the top candidate. It is likely that the
expression of the brain-related miRNAs is under rigorous
control of these regulators during different developmental
stages and in different cell types.
Discussion
Comparative sequence analysis is a powerful and general tool
for detecting functional elements, because these elements are
often under strong selective pressure to be preserved, and
Genome Biology 2006, 7:R85
information
interesting to examine whether miRNAs are involved in such
processes via the regulation by MEF2.
interactions
regulated by CREB and is involved in regulating neuronal
morphogenesis [42].
refereed research
TGCAAAT
deposited research
ATTAACT
R85.10 Genome Biology 2006,
Volume 7, Issue 9, Article R85
Wu and Xie
/>
Table 3
CRE sites present near a set of brain-related miRNAs in the human genome
Conserved CRE half site†
Conserved CRE site*
Position‡
Distance (bp)
mir-124a-2
chr8:65452347-65452354
-1913
mir-124a-3
chr20:61279330-61279337
-968
Position‡
chr8:9801040-9801044
-2648
chr20:61232305-61232309
-47992
-3577
chr20:61317969-61317973
mir-124a-1
Distance (bp)
chr20:61276720-61276724
miRNA
37665
mir-9-1
chr1:153204718-153204725
-1423
chr1:153212345-153212349
-9051
mir-9-2
chr5:88007547-88007554
-9034
chr5:88016703-88016707
-18190
chr5:87995510-87995514
3003
mir-9-3
chr15:87706692-87706699
-5565
chr15:87712302-87712306
50
chr15:87711861-87711868
-391
chr15:87740065-87740069
27813
chr15:87743860-87743867
31604
chr15:87757417-87757421
45165
chr15:87757437-87757441
45185
mir-132/212
chr17:1901302-1901309
-1247
chr17:1922008-1922012
-21956
chr17:1900538-1900545
-486
chr17:1921968-1921972
-21916
chr17:1900522-1900529
-470
chr17:1913396-1913400
-13344
chr17:1900084-1900091
-35
chr12:96426695-96426699
-33363
chr2:219999719-219999726
-15292
chr2:219969610-219969614
14817
chr2:219939817-219939824
44611
chr2:219969479-219969483
14948
chr2:219964362-219964366
20065
chr1:204385822-204385826
-21559
mir-135a-2
mir-153-1
mir-29a/29b-1
chr7:130063683-130063690
-44859
mir-29b-2
chr1:204384854-204384858
-20591
chr11:72021296-72021300
mir-139
-17474
*CRE (cAMP response element); site: TGACGTCA. †CRE half site: TGACG; can bind to CREB with weaker affinity. ‡Position is referenced on hg17.
Only sites perfectly conserved in human, mouse, rat and dog are shown.
therefore stand out from neutrally evolving sequences by
displaying a greater degree of conservation across related
species. In this work, we have relied on comparative genomics
to study the regulation of neuronal gene expression, and have
identified functional elements for three distinct classes of regulators including REST, CREB, and miRNAs.
We identified 895 NRSE sites conserved in human, mouse,
rat and dog with an estimated false positive rate of 3.4%. The
number is significantly lower than 41%, which is the
estimated false positive rate in the previous analysis by Bruce
et al. [19], where across-species conservation criteria were
not considered. Moreover, we used a profile-based approach,
and were able to identify sites deviating from the NRSE consensus. For instance, we successfully identified two experimentally validated sites in L1CAM and SNAP25 that deviate
from the NRSE consensus and were missed in previous
analyses.
A set of the predicted sites is located in close proximity to a set
of brain-related miRNA genes. This suggests that similar to
the regulation of neuronal genes, many brain-specific
miRNAs are likely to be repressed by REST in non-neuronal
tissues. To help better understand the function of these
miRNAs, we have generated a list of predicted target genes for
each of the miRNAs. The predicted targets include many
genes that are specifically expressed in neural tissues, suggesting the potentially extensive regulation by the miRNAs on
these genes.
We discovered that the REST corepressor complex itself is
targeted by multiple brain-related miRNAs (Figure 4).
Together with the repressive role of REST on these miRNAs,
the analysis points to the existence of a double-negative feedback loop between the transcription factor REST and brainrelated miRNAs in mediating neuronal gene expression. The
double-negative feedback loop is used widely in engineering
as a robust mechanism for maintaining the stability of a
dynamic system. A two-component system with mutual
inhibitions often results in a bistable system in which only
one component is active at the resting state, and the active
component can be stabilized against noisy perturbations by
negative feedbacks. We speculate that the nervous system
may utilize this mechanism in restricting the expression of
neuronal genes exclusively in neuronal tissues. It has been
reported that REST is actively transcribed in neural progenitors during neurogenesis [7]. Moreover, there are also reports
showing that mRNA of REST is present in mature hippocam-
Genome Biology 2006, 7:R85
/>
Genome Biology 2006,
Volume 7, Issue 9, Article R85
Wu and Xie R85.11
(a)
87,710,000
hsa-mir-9-3
SMAD3
RE1/NRSE
CREB
CREB
OCT1
comment
chr15: 87,705,000
POU3F2
Vertebrate multiz alignment & conservation
Conservation
reviews
Mouse
Rat
Dog
(b)
chr17:
1899500
1900000
1900500
1901000
1901500
1902000
hsa-mir-132
hsa-mir-212
CREB
MYOD
CREB
CREB
MEF2
reports
RE1/NRSE
Vertebrate multiz alignment & conservation
Conservation
Genome Biology 2006, 7:R85
information
We have used gene expression data measured across different
tissues to examine the expression patterns of REST, its target
genes and the brain-related miRNAs. However, there are
several confounding factors that might limit the utility of such
expression data. First, the tissues typically contain heterogeneous cell types. For instance, the brain tissues are always a
mixture of neurons and glials. If a gene is expressed differen-
tially in different cell types, its expression measured at tissue
level may become hard to interpret. Second, the expression
data may be further confounded by many secondary effects.
For example, transcriptional regulators controlled by REST
may themselves lead to expression changes for a large
number of genes. Indeed, many of the predicted REST targets
are transcription factors, such as NeuroD1, NeuroD2 and
NeuroD4, involved in neural differentiation, and several LIM
homeobox proteins such as LHX2, LHX3 and LHX5. The
measured expression levels are likely a combined effect of
several levels of regulation. Third, because of the added levels
of regulation by miRNAs, RNA measurement of a gene may
not reflect its true expression levels. As we mentioned above,
it has been observed that REST is transcribed in neural progenitor cells, but little REST protein can be detected. Examining protein expression data is certainly more desirable.
However, at present we have few high-quality large-scale protein expression data available. Such data might gradually
become available in the future with the recent development in
interactions
pal neurons, and the mRNA level can be elevated following
epileptic insults [44]. If these transcripts are all translated
into REST proteins, a large number of neuronal genes will be
repressed, most likely undesirably. However, little REST protein can be detected in neural progenitors, so to what extent
the REST protein is expressed in the mature hippocampus
neurons is unclear. Previously, the proteasomal-dependent
pathway was suggested to be involved in the post-translational degradation of the REST protein [7]. We suggest that
the set of miRNAs targeting REST might be an additional
mechanism ensuring the removal of REST products in neuronal tissues.
refereed research
Figure 5
Predicted regulatory elements in the regulatory regions of miRNA genes
Predicted regulatory elements in the regulatory regions of miRNA genes. The annotation in the regulatory regions of (a) miR-9 and (b) miR-132/212, are
shown. Each panel shows the positions of regulatory elements on a background annotation of genes and sequence conservations extracted from the
UCSC genome browser. Not one protein-coding gene is present in both regions. The bottom part of each panel shows the conservation of human
sequence when compared with other mammalian species. Aligned human sequences are denoted with vertical lines at aligned positions for mouse, rat and
dog, respectively. The track denoted by 'conservation' plots the overall conservation levels of the human sequence in each region. The regulatory elements
demonstrate higher levels of conservation and stand out from the background sequences.
deposited research
Mouse
Rat
Dog
R85.12 Genome Biology 2006,
Volume 7, Issue 9, Article R85
Wu and Xie
protein-microarray technology and progress in proteomic
surveys by mass spectrometry.
In additional to REST, which is a regulator repressing the set
of brain-related miRNAs, we are also interested in identifying
the factors positively regulating those miRNAs. We have
undertaken an unbiased approach of searching conserved
and enriched short motifs in regulatory regions of these miRNAs, and have identified CREB as the top candidate regulator. CREB is an important transcription factor regulating a
wide-range of neuronal functions including neuronal
survival, neuronal proliferation and differentiation, process
growth, and synaptic plasticity [45,46]. CREB can be activated via phosphorylation by multiple extracellular stimuli
such as neurotrophins, cytokines, and calcium, as well as a
variety of cellular stresses. The discovery of regulation of multiple miRNAs by CREB indicates that these miRNAs are
potentially expressed in an activity-dependent manner. It
would be interesting to examine whether these miRNAs play
a role in regulating synapse development and plasticity.
/>
to compute the frequency of different nucleotides at each
position, and generated a position weight matrix representation P of the profile, where pij represents the probability of
nucleotide j at position i. The information content of a profile
is defined as ICi = 2+Σj pij*log2(pij) for position i. For any candidate 21-nucleotide sequence, we then calculated a log-odds
score to evaluate how well the sequence matched to the NRSE
profile. The log-odds score is defined as LO = Σi log2(pi, j(i)/
bj(i)) where j(i) is the nucleotide at position i of the sequence,
and bj represents the probability of observing nucleotide j in a
background model. The log-odds score computes the log ratio
of two likelihoods, one that the site is generated by the NRSE
profile, and the other that the site is generated by a neutral
background model. In the neutral background model, we
assume each nucleotide is generated independently according to a given nucleotide composition. We estimated the
nucleotide composition based on sequences extracted from
regulatory regions (5 kb upstream) of all known genes for
each of the species separately.
Analysis of gene expression across different tissues
Conclusion
We have identified 895 putative NRSE sites conserved in
human, mouse, rat and dog genomes. A subset of these NRSE
sites is present in the vicinity of several brain-related
miRNAs, suggesting the transcriptional repression of these
miRNAs by REST. We have also found that the brain-related
miRNAs are enriched with CRE elements in their promoter
regions, implicating the role of CREB in the positive regulation of these miRNAs. Altogether, the comparative sequences
analysis points to an intricate network of transcription activators and repressors acting together with miRNAs in coordinating neuronal gene expression and promoting neuronal
identity.
Materials and methods
Multiple sequence alignment among human, mouse,
rat and dog
We used the whole-genome mammalian alignments generated by the UCSC genome browser [47]. From the wholegenome alignment, we then extracted regions of interest. For
instance, we generated the aligned NRSE sequences based on
genome coordinates of NRSE sites in human. Similarly, we
constructed the aligned 3'UTR database using the coordinates of 3'UTRs of all protein-coding genes. For 3'UTRs, we
used five-way alignments (human, mouse, rat, dog and opossum). The annotation of genes and their 3'UTRs are from the
collection of known genes deposited in the UCSC genome
browser.
Constructing the NRSE profile and calculation of logodds score
We used the microarray gene expression data published previously by Su et al. [36], which profiled expression patterns of
genes across 61 mouse tissues. We postprocessed the dataset
and removed any probe with a mean expression level across
different tissues of less than 100, and an SD less than 50. For
genes containing multiple probes in the array, we used values
averaged over different probes to represent the expression
level for that gene. In total, 13,743 genes were used for further
analysis. For each of the genes, we then normalized their
expression values across different tissues such that the mean
expression across different tissues was zero and the SD was 1.
Based on the normalized values, we then screened out genes
with expression values higher than 0.35 in at least one of the
brain-related tissues. A total number of 1,174 genes was identified, and we refer to the gene set as the brain-related genes.
Identification of regulatory motifs for brain-related
miRNAs
First we generated a multiple sequence alignment between
human, mouse, rat and dog for the region from 10 kb
upstream to 5 kb downstream for each miRNA. We then
searched the occurrence of all 7-mers in the aligned regions.
For each 7-mer, we counted the number of total instances (N)
in human, and the number of instances (K) perfectly conserved in the aligned regions of mouse, rat and dog. We then
calculated a Z-score defined as (K-Np0)/[Np0(1-p0)]1/2, where
p0 is the background conservation rate. The Z-score measures
the number of standard deviations on the number of conserved instances away from what is expected by chance by
assuming a binomial model on whether a site is conserved.
The Z-score quantifies the enrichment of conserved motifs in
the aligned regions. To achieve a significant Z-score, a 7-mer
must be highly conserved and occur in high frequencies.
The NRSE profile was constructed from 38 known NRSE sites
each with a site length of 21 nucleotides. We used the 38 sites
Genome Biology 2006, 7:R85
/>
Genome Biology 2006,
Additional data files
20.
Click here figures
A PDF containing 1
Supportingdata fileand tables
Additionalfor file supporting figures and tables.
21.
22.
23.
Acknowledgements
24.
References
25.
1.
26.
2.
4.
5.
7.
8.
10.
11.
12.
13.
15.
16.
17.
19.
31.
32.
33.
34.
35.
36.
37.
38.
39.
40.
41.
42.
43.
Genome Biology 2006, 7:R85
information
18.
30.
interactions
14.
29.
refereed research
9.
28.
deposited research
6.
27.
reports
3.
Chong JA, Tapia-Ramirez J, Kim S, Toledo-Aral JJ, Zheng Y, Boutros
MC, Altshuller YM, Frohman MA, Kraner SD, Mandel G: REST: a
mammalian silencer protein that restricts sodium channel
gene expression to neurons. Cell 1995, 80:949-957.
Schoenherr CJ, Anderson DJ: The neuron-restrictive silencer
factor (NRSF): a coordinate repressor of multiple neuronspecific genes. Science 1995, 267:1360-1363.
Ballas N, Mandel G: The many faces of REST oversee epigenetic programming of neuronal genes. Curr Opin Neurobiol
2005, 15:500-506.
Andres ME, Burger C, Peral-Rubio MJ, Battaglioli E, Anderson ME,
Grimes J, Dallman J, Ballas N, Mandel G: CoREST: a functional
corepressor required for regulation of neural-specific gene
expression. Proc Natl Acad Sci USA 1999, 96:9873-9878.
Grimes JA, Nielsen SJ, Battaglioli E, Miska EA, Speh JC, Berry DL,
Atouf F, Holdener BC, Mandel G, Kouzarides T: The co-repressor
mSin3A is a functional component of the REST-CoREST
repressor complex. J Biol Chem 2000, 275:9461-9467.
Lunyak VV, Burgess R, Prefontaine GG, Nelson C, Sze SH, Chenoweth J, Schwartz P, Pevzner PA, Glass C, Mandel G, et al.: Corepressor-dependent silencing of chromosomal regions
encoding neuronal genes. Science 2002, 298:1747-1752.
Ballas N, Grunseich C, Lu DD, Speh JC, Mandel G: REST and its
corepressors mediate plasticity of neuronal gene chromatin
throughout neurogenesis. Cell 2005, 121:645-657.
He L, Hannon GJ: MicroRNAs: small RNAs with a big role in
gene regulation. Nat Rev Genet 2004, 5:522-531.
Bartel DP: MicroRNAs: genomics, biogenesis, mechanism,
and function. Cell 2004, 116:281-297.
Carthew RW: Gene regulation by microRNAs. Curr Opin Genet
Dev 2006, 16:203-208.
Zhao Y, Samal E, Srivastava D: Serum response factor regulates
a muscle-specific microRNA that targets Hand2 during
cardiogenesis. Nature 2005, 436:214-220.
Schratt GM, Tuebing F, Nigh EA, Kane CG, Sabatini ME, Kiebler M,
Greenberg ME: A brain-specific microRNA regulates dendritic
spine development. Nature 2006, 439:283-289.
Griffiths-Jones S, Grocock RJ, van Dongen S, Bateman A, Enright AJ:
miRBase: microRNA sequences, targets and gene
nomenclature. Nucleic Acids Res 2006, 34:D140-144.
Cao X, Yeo G, Muotri AR, Kuwabara T, Gage FH: Noncoding
RNAs in the mammalian central nervous system. Annu Rev
Neurosci 2006, 29:77-103.
Klein ME, Impey S, Goodman RH: Role reversal: the regulation of
neuronal gene expression by microRNAs. Curr Opin Neurobiol
2005, 15:507-513.
Kosik KS, Krichevsky AM: The elegance of the microRNAs: a
neuronal perspective. Neuron 2005, 47:779-782.
Giraldez AJ, Cinalli RM, Glasner ME, Enright AJ, Thomson JM, Baskerville S, Hammond SM, Bartel DP, Schier AF: MicroRNAs regulate
brain morphogenesis in zebrafish. Science 2005, 308:833-838.
Schoenherr CJ, Paquette AJ, Anderson DJ: Identification of potential target genes for the neuron-restrictive silencer factor.
Proc Natl Acad Sci USA 1996, 93:9881-9886.
Bruce AW, Donaldson IJ, Wood IC, Yerbury SA, Sadowski MI, Chapman M, Gottgens B, Buckley NJ: Genome-wide analysis of repressor element 1 silencing transcription factor/neuronrestrictive silencing factor (REST/NRSF) target genes. Proc
Natl Acad Sci USA 2004, 101:10458-10463.
Boffelli D, Nobrega MA, Rubin EM: Comparative genomics at the
vertebrate extremes. Nat Rev Genet 2004, 5:456-465.
Xie X, Lu J, Kulbokas EJ, Golub TR, Mootha V, Lindblad-Toh K,
Lander ES, Kellis M: Systematic discovery of regulatory motifs
in human promoters and 3' UTRs by comparison of several
mammals. Nature 2005, 434:338-345.
Elemento O, Tavazoie S: Fast and systematic genome-wide discovery of conserved regulatory elements using a non-alignment based approach. Genome Biol 2005, 6:R18.
Ettwiller L, Paten B, Souren M, Loosli F, Wittbrodt J, Birney E: The
discovery, positioning and verification of a set of
transcription-associated motifs in vertebrates. Genome Biol
2005, 6:R104.
Farh KK, Grimson A, Jan C, Lewis BP, Johnston WK, Lim LP, Burge
CB, Bartel DP: The widespread impact of mammalian microRNAs on mRNA repression and evolution. Science 2005,
310:1817-1821.
Brennecke J, Stark A, Russell RB, Cohen SM: Principles of microRNA-target recognition. PLoS Biol 2005, 3:e85.
Stark A, Brennecke J, Bushati N, Russell RB, Cohen SM: Animal
microRNAs confer robustness to gene expression and have
a significant impact on 3'UTR evolution.
Cell 2005,
123:1133-1146.
Lewis BP, Burge CB, Bartel DP: Conserved seed pairing, often
flanked by adenosines, indicates that thousands of human
genes are microRNA targets. Cell 2005, 120:15-20.
Lall S, Grun D, Krek A, Chen K, Wang YL, Dewey CN, Sood P,
Colombo T, Bray N, Macmenamin P, et al.: A genome-wide map of
conserved microRNA targets in C. elegans. Curr Biol 2006,
16:460-471.
Stark A, Brennecke J, Russell RB, Cohen SM: Identification of Drosophila microRNA targets. PLoS Biol 2003, 1:E60.
John B, Enright AJ, Aravin A, Tuschl T, Sander C, Marks DS: Human
microRNA targets. PLoS Biol 2004, 2:e363.
Lander ES, Linton LM, Birren B, Nusbaum C, Zody MC, Baldwin J,
Devon K, Dewar K, Doyle M, FitzHugh W, et al.: Initial sequencing
and analysis of the human genome. Nature 2001, 409:860-921.
Lindblad-Toh K, Wade CM, Mikkelsen TS, Karlsson EK, Jaffe DB,
Kamal M, Clamp M, Chang JL, Kulbokas EJ 3rd, Zody MC, et al.:
Genome sequence, comparative analysis and haplotype
structure of the domestic dog. Nature 2005, 438:803-819.
Gibbs RA, Weinstock GM, Metzker ML, Muzny DM, Sodergren EJ,
Scherer S, Scott G, Steffen D, Worley KC, Burch PE, et al.: Genome
sequence of the Brown Norway rat yields insights into mammalian evolution. Nature 2004, 428:493-521.
Waterston RH, Lindblad-Toh K, Birney E, Rogers J, Abril JF, Agarwal
P, Agarwala R, Ainscough R, Alexandersson M, An P, et al.: Initial
sequencing and comparative analysis of the mouse genome.
Nature 2002, 420:520-562.
Supplementary data for 'Comparative sequence analysis
reveals an intricate network among REST, CREB and
miRNA in mediating neuronal gene expression'
[http://
www.broad.mit.edu/~xhx/projects/NRSE/]
Su AI, Wiltshire T, Batalov S, Lapp H, Ching KA, Block D, Zhang J,
Soden R, Hayakawa M, Kreiman G, et al.: A gene atlas of the
mouse and human protein-encoding transcriptomes. Proc
Natl Acad Sci USA 2004, 101:6062-6067.
Zhang B, Schmoyer D, Kirov S, Snoddy J: GOTree Machine
(GOTM): a web-based platform for interpreting sets of interesting genes using Gene Ontology hierarchies.
BMC
Bioinformatics 2004, 5:16.
Westbrook TF, Martin ES, Schlabach MR, Leng Y, Liang AC, Feng B,
Zhao JJ, Roberts TM, Mandel G, Hannon GJ, et al.: A genetic screen
for candidate tumor suppressors identifies REST. Cell 2005,
121:837-848.
Conaco C, Otto S, Han JJ, Mandel G: Reciprocal actions of REST
and a microRNA promote neuronal identity. Proc Natl Acad Sci
USA 2006, 103:2422-2427.
Smirnova L, Grafe A, Seiler A, Schumacher S, Nitsch R, Wulczyn FG:
Regulation of miRNA expression during neural cell
specification. Eur J Neurosci 2005, 21:1469-1477.
Kim VN, Nam JW: Genomics of microRNA. Trends Genet 2006,
22:165-173.
Vo N, Klein ME, Varlamova O, Keller DM, Yamamoto T, Goodman
RH, Impey S: A cAMP-response element binding proteininduced microRNA regulates neuronal morphogenesis. Proc
Natl Acad Sci USA 2005, 102:16426-16431.
Shalizi A, Gaudilliere B, Yuan Z, Stegmuller J, Shirogane T, Ge Q, Tan
reviews
We thank S Calvo, J Lu and A Subramanian for insightful comments and discussions on this manuscript.
Wu and Xie R85.13
comment
Supporting figures and tables are available with the online
version of this article in Additional data file 1. The identified
NRSE sites, the miRNA target genes and other materials
mentioned in the article can be viewed at a supplementary
website [35].
Volume 7, Issue 9, Article R85
R85.14 Genome Biology 2006,
44.
45.
46.
47.
Volume 7, Issue 9, Article R85
Wu and Xie
Y, Schulman B, Harper JW, Bonni A: A calcium-regulated MEF2
sumoylation switch controls postsynaptic differentiation. Science 2006, 311:1012-1017.
Palm K, Belluardo N, Metsis M, Timmusk T: Neuronal expression
of zinc finger transcription factor REST/NRSF/XBR gene. J
Neurosci 1998, 18:1280-1296.
Lonze BE, Ginty DD: Function and regulation of CREB family
transcription factors in the nervous system. Neuron 2002,
35:605-623.
Carlezon WA Jr, Duman RS, Nestler EJ: The many faces of CREB.
Trends Neurosci 2005, 28:436-445.
UCSC Genome Bioinformatics []
Genome Biology 2006, 7:R85
/>