Báo cáo y học: "Transcriptional response to alcohol exposure in Drosophila melanogaster" potx
Bạn đang xem bản rút gọn của tài liệu. Xem và tải ngay bản đầy đủ của tài liệu tại đây (333.25 KB, 10 trang )
Genome Biology 2006, 7:R95
comment reviews reports deposited research refereed research interactions information
Open Access
2006Morozovaet al.Volume 7, Issue 10, Article R95
Research
Transcriptional response to alcohol exposure in Drosophila
melanogaster
Tatiana V Morozova
*†
, Robert RH Anholt
*†‡
and Trudy FC Mackay
*‡
Addresses:
*
WM Keck Center for Behavioral Biology, North Carolina State University, Raleigh, NC 27695, USA.
†
Department of Zoology, North
Carolina State University, Raleigh, NC 27695, USA.
‡
Department of Genetics, North Carolina State University, Raleigh, NC 27695, USA.
Correspondence: Trudy FC Mackay. Email:
© 2006 Morozova et al.; licensee BioMed Central Ltd.
This is an open access article distributed under the terms of the Creative Commons Attribution License ( which
permits unrestricted use, distribution, and reproduction in any medium, provided the original work is properly cited.
Drosophila's response to alcohol<p>Whole-genome transcriptional analysis following alcohol exposure in flies identifies key enzymes in conserved metabolic pathways that may contribute to human alcohol sensitivity.</p>
Abstract
Background: Alcoholism presents widespread social and human health problems. Alcohol
sensitivity, the development of tolerance to alcohol and susceptibility to addiction vary in the
population. Genetic factors that predispose to alcoholism remain largely unknown due to extensive
genetic and environmental variation in human populations. Drosophila, however, allows studies on
genetically identical individuals in controlled environments. Although addiction to alcohol has not
been demonstrated in Drosophila, flies show responses to alcohol exposure that resemble human
intoxication, including hyperactivity, loss of postural control, sedation, and exposure-dependent
development of tolerance.
Results: We assessed whole-genome transcriptional responses following alcohol exposure and
demonstrate immediate down-regulation of genes affecting olfaction, rapid upregulation of
biotransformation enzymes and, concomitant with development of tolerance, altered transcription
of transcriptional regulators, proteases and metabolic enzymes, including biotransformation
enzymes and enzymes associated with fatty acid biosynthesis. Functional tests of P-element
disrupted alleles corresponding to genes with altered transcription implicated 75% of these in the
response to alcohol, two-thirds of which have human orthologues.
Conclusion: Expression microarray analysis is an efficient method for identifying candidate genes
affecting complex behavioral and physiological traits, including alcohol abuse. Drosophila provides a
valuable genetic model for comparative genomic analysis, which can inform subsequent studies in
human populations. Transcriptional analyses following alcohol exposure in Drosophila implicate
biotransformation pathways, transcriptional regulators, proteolysis and enzymes that act as
metabolic switches in the regulation of fatty acid metabolism as important targets for future studies
of the physiological consequences of human alcohol abuse.
Background
The National Institute on Alcohol Abuse and Alcoholism has
estimated that approximately 14 million people in the United
States suffer from alcoholism [1]. Genetic studies have dem-
onstrated that the propensity for alcohol abuse is determined
by multiple genes. Thus, vulnerability to alcohol abuse shows
Published: 20 October 2006
Genome Biology 2006, 7:R95 (doi:10.1186/gb-2006-7-10-r95)
Received: 5 June 2006
Revised: 10 August 2006
Accepted: 20 October 2006
The electronic version of this article is the complete one and can be
found online at />R95.2 Genome Biology 2006, Volume 7, Issue 10, Article R95 Morozova et al. />Genome Biology 2006, 7:R95
all the hallmarks of a quantitative trait, as it is polygenic and
subject to genotype by environment interactions. Efforts to
map chromosomal regions (quantitative trait loci (QTL)) that
harbor genes responsible for alcohol-related traits have iden-
tified at least 24 QTL regions in the mouse genome [2].
Although candidate genes have been identified within such
QTL regions, including the multiple PDZ domain protein
Mpdz on chromosome 4 [3], conclusive evidence that links
candidate genes within QTL regions directly to the phenotype
is often difficult to obtain. Quantitatively measuring alcohol
dependence without confounding contributions of other psy-
chiatric or social disorders is challenging with human sub-
jects, although studies in ethnically defined populations have
implicated alcohol dehydrogenase [4], the GABA
A
receptor
complex [5], and the serotonin 1B receptor in alcohol sensitiv-
ity [6,7].
Flies are naturally exposed to ethanol, as they feed on fer-
mented food. Exposing flies to low concentrations of ethanol
stimulates locomotor activity, whereas high concentrations of
ethanol induce an intoxicated phenotype that shows marked
similarities to human alcohol intoxication, characterized by
locomotor impairments, loss of postural control, sedation
[8,9] and exposure-dependent development of tolerance [10].
Alcohol sensitivity in Drosophila melanogaster can be quan-
tified in an 'inebriometer', a 122 cm long vertical glass col-
umn, which contains a series of slanted mesh partitions to
which flies can attach [11]. Flies are introduced in the top of
the column and exposed to ethanol vapors. As they lose pos-
tural control they fall through the column. The elution time
from the column is used as a measure of sensitivity to alcohol
intoxication. Following an initial exposure to alcohol, flies
develop tolerance, manifested upon a second exposure by a
shift in the elution profile [10]. Tolerance peaks within hours
after exposure and persists up to 24 hours in some individuals
[10].
Here, we exploited the power of the Drosophila system to
evaluate whole-genome transcriptional profiles that reflect
alterations in gene expression upon exposure to alcohol and
during development of tolerance, to gain insights into the
underlying cellular and physiological mechanisms that
respond to alcohol exposure. We then evaluated alcohol sen-
sitivity and the development of tolerance in flies with muta-
tions in 20 genes that were implicated by the analysis of
differential transcript abundance, and identified 15 novel
candidate genes affecting alcohol related phenotypes, 10 of
which have human orthologues. Thus, whole genome tran-
scriptional analysis following alcohol exposure in Drosophila
can identify candidate genes and metabolic pathways that are
relevant to alcohol abuse and its physiological consequences
in people.
Results and discussion
We hypothesized that analysis of gene expression after one
and two exposures to ethanol would reveal novel genes and
pathways underpinning the genomic response to ethanol, and
that subsequent functional tests with mutations in such genes
would confirm them as candidate genes for future detailed
investigation. This strategy requires that mutations are gen-
erated in a common homozygous (isogenic) genetic back-
ground, since effects of segregating variants in an outbred
strain will be of the same magnitude as the mutational effects
we wish to detect. Fortuitously, a panel of single P-transposa-
ble element insertional mutations has been generated in each
of five Canton-S derived isogenic strains (Canton S A, B, C, E,
F) as part of the Drosophila Gene Disruption Project [12]. We
took advantage of this resource and characterized for each of
the 5 isogenic strains the responseto ethanol after an initial
exposure and the development of tolerance after a second
exposure 2 hours later, at 2 ages (3 to 5 days and 12 to 15 days
post eclosion). We observed that sensitivity and development
of tolerance are highly sensitive to genetic background (Addi-
tional data file 5). Canton-S B flies show the most pronounced
development of tolerance, which is maximal two hours after
exposure to undiluted ethanol vapors. Tolerance is least
apparent in flies in the Canton-S E genetic background (Fig-
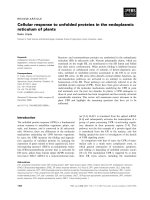
ure 1a). Furthermore, three- to five-day old flies are more sen-
sitive than older flies to the initial alcohol exposure, and
consequently show greater tolerance (Figure 2). Therefore,
we used three- to five-day old Canton-S B flies for our tran-
scriptional analysis.
We collected flies either without exposure to ethanol, imme-
diately after exposure to ethanol and passage through the ine-
briometer, or from a population that had developed tolerance
two hours after the initial ethanol exposure (Figure 1b). We
used 5 independent replicates of 30 3- to 5-day old males for
each time point and generated cRNA for hybridization to high
density oligonucleotide microarrays. Raw microarray data
are given in Additional data file 1.
We performed analysis of variance to identify probe sets with
significant differences in expression between the three treat-
ments, and a false positive discovery rate of q < 0.05 to
account for multiple tests [13]. Significant probe sets were
further analyzed by post hoc Tukey tests to identify which
samples accounted for transcriptional differences between
the treatments (Additional data file 2). We identified 582
probe sets with changes in gene expression between the treat-
ment groups at q < 0.05 (Additional data file 2). Among these
genes 112 encode predicted transcripts of unknown function,
173 have both mouse and human orthologues, 13 genes have
orthologues only in the mouse, and 21 have only human
orthologues. A total of 34 probe sets were significant at a false
positive discovery rate of q < 0.001; of these, 8 have mamma-
lian orthologues (Table 1).
Genome Biology 2006, Volume 7, Issue 10, Article R95 Morozova et al. R95.3
comment reviews reports refereed researchdeposited research interactions information
Genome Biology 2006, 7:R95
We categorized the 582 significant probe sets as 'acutely' up-
or down-regulated if transcript levels show sustained altered
expression after the first exposure to ethanol; 'slowly' up-or
down-regulated if transcript abundance only changes after
the second exposure to alcohol; and 'transiently' up- or down-
regulated if transcript levels are altered following the first
exposure to ethanol, but are not sustained during the devel-
opment of tolerance. We found 78 genes that show acute
down-regulation and 77 genes that show acute up-regulation,
In addition, 104 genes are slowly down-regulated, 258 genes
are slowly up-regulated, 33 genes are transiently down-regu-
lated, and 32 genes are transiently up-regulated.
Probe sets were annotated and compiled in Gene Ontology
categories using Affymetrix software [14] and the FlyBase
data base [15,16] (Additional data files 3 and 4). Gene Ontol-
ogy categories that are significantly more abundant among
the probe sets than expected by chance include genes associ-
ated with olfactory function, which are acutely down-regu-
lated, regulators of signal transduction, which are acutely up-
regulated, metabolic enzymes, including peptidases, hydro-
lases and pigmentation genes, which are slowly down-regu-
lated, and transcriptional regulators and circadian genes,
which are slowly up-regulated (Additional data files 3 and 4).
It is possible that the slow up-regulation of genes affecting
circadian rhythm could be attributable to the two hour differ-
ence in sampling the control animals and those tested for
tolerance.
Expression of a suite of genes associated with odor recogni-
tion is acutely down-regulated, including genes that encode
the odorant binding proteins lush, Obp19a, Pbprp1-5, the
odorant receptor Or67d, and the ubiquitous odorant receptor
Or83b, which is necessary for transport and insertion of
odorant receptors in the chemosensory dendritic membranes
of olfactory neurons [17] (Table 1 and Additional data file 2).
Olfactory specific protein E and antennal proteins 5 and 10
are also acutely down-regulated (Table 1). This pattern of
altered transcript abundance reflects acute down-regulation
of olfactory function upon exposure to undiluted ethanol
vapor. Expression of two olfactory proteins is up-regulated:
Obp99d is slowly up-regulated and Pinocchio, a gene that
encodes a protein implicated in removal of xenobiotics from
the sensillar perilymph [18], is transiently up-regulated upon
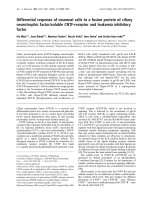
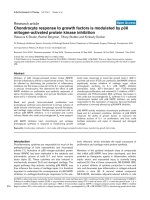
Sensitivity and development of tolerance to alcohol in Drosophila melanogasterFigure 1
Sensitivity and development of tolerance to alcohol in Drosophila melanogaster. (a) Inebriometer elution profiles of Canton S B and Canton S E flies after
exposure to concentrated ethanol vapor. Note the shifts in peak elution time between the first (solid symbols) and second (open symbols) ethanol
exposure, and the difference in this peak shift between Canton S B and Canton S E. (b) Schematic diagram of the experimental design used to assess whole
genome transcriptional changes after ethanol exposure. The numbers indicate samples collected for microarray analysis, as follows: 1, control flies; 2, flies
after a single exposure to ethanol; 3, flies that develop tolerance during a 2 h interval prior to a second exposure to ethanol.
1 2 3 4 5 6 7 8 9 10 11 12 13
1 2 3 4 5 6 7 8 9 10 11 12 13
1
2
3
0
5
10
15
20
25
30
51015
0
5
10
15
20
25
30
51015
Canton S B
Canton S E
Canton S B
(b)
(a)
Number of flies (percentage of total)
1st exposure
Elution time (min)
Number of flies
2h
Number of flies
Elution time (min)
2nd exposure
R95.4 Genome Biology 2006, Volume 7, Issue 10, Article R95 Morozova et al. />Genome Biology 2006, 7:R95
exposure to ethanol (Table 1). In addition, biotransformation
enzymes, including those encoded by Cyp6a2 and Cyp6a13,
and glutathione-S-transferase D5, are acutely up-regulated.
Since Pinocchio is extensively expressed throughout the third
antennal segment [18], it is unlikely that the observed reduc-
tion in expression of the subset of odorant binding proteins
and odorant receptors is due to ethanol induced tissue
damage.
Immediate up-regulation is also observed for transcripts
involved in response to stress, including l(2)efl, Mpk2 and
Hsp70Ab. Several transcriptional regulators are rapidly up-
regulated, including cabut, Aly and Drop along with tran-
scripts involved in protein ubiquitination (mib1, CG11414,
CG40045 and TSG101). CG1516, which is orthologous to
human pyruvate carboxylase is also acutely up-regulated
after ethanol exposure (Additional data file 2).
During the two hour period in which tolerance culminates we
observe modulation of transcription of a different set of
genes. Sixteen genes that encode proteases are down-regu-
lated along with six genes associated with lipid transport and
fatty acid metabolism, including bubblegum, NLaz and
Hmgs. Two biotransformation enzymes, encoded by Cyp12e1
and Cyp4ac1, are also down-regulated, as is the transcrip-
tional regulator Sir2.
At the same time there is an extensive increase in expression
of transcriptional regulators, proteases and metabolic
enzymes. Nineteen transcription factors, eleven proteases
and thirty enzymes associated with metabolism, including
signal transduction components (protein kinase C δ, rdgA, G
protein subunit γ1, fz2), enzymes associated with fatty acid
biosynthesis and intermediary metabolism (for example,
malic enzyme), and biotransformation enzymes (encoded by
Cyp6a8, Cyp4e3, Cyp309a1, GstD1, GstE5, GstE7) are up-
regulated (Additional data file 2). Thus, a single exposure to
ethanol has the potential to elicit profound changes in the
protein composition of the cell through altered transcrip-
tional regulation and proteolysis aimed at rapidly adapting
cellular metabolism to the consequences of alcohol
intoxication.
Forty-six genes with altered transcript abundance on our
microarrays correspond to murine orthologues implicated in
altered transcriptional regulation in a recent meta-analysis
study of alcohol drinking preference in mice [19] (Additional
data file 2). Furthermore, several of the genes with changes in
transcript levels have been associated previously with
responses to alcohol exposure, including lush, which encodes
a Drosophila odorant binding protein that interacts with
short chain alcohols [20] and the contact pheromone cis-vac-
cenyl acetate [21], NLaz, which encodes an orthologue of
human apolipoprotein D, which is preferentially expressed in
prefrontal cortex of alcoholics [22], and period, a regulator of
circadian activity that has been associated with alcohol con-
sumption in mice and humans [23]. In addition, Sorbitol
dehydrogenase 2, CG1600 and v(2)k05816, which harbor
alcohol dehydrogenase activity (Additional data file 2), also
show altered transcript levels.
Mutant analysis has implicated a handful of other genes in
sensitivity to ethanol. These include the cheapdate allele of
amnesiac [24], which encodes a neuropeptide thought to
activate the cyclic AMP signaling pathway [25]; the calcium/
calmodulin-dependent adenylate cyclase encoded by the
rutabaga (rut) gene [24]; the axonal migration and cell adhe-
sion receptor, fasciclin II (Fas2) [26]; PkaR2, which encodes
a cyclic AMP-dependent protein kinase [27]; the gene encod-
ing the GABA-B receptor 1 [28]; and the genes encoding the
Drosophila neuropeptide F (npf, a homolog of the mamma-
lian neuropeptide Y) and its receptor [29]. In addition, heat
stress has been found to induce tolerance to a subsequent
exposure to ethanol and implicated a nucleic acid binding
zinc finger protein encoded by the hangover (hang) gene in
both the response to heat stress and the induction of ethanol
tolerance [30]. Induction of ethanol tolerance was completely
abolished in flies carrying both null mutations in hang and in
the gene encoding tyramine β-hydroxylase (Tbh), which sug-
gested that hang and the neurotransmitter octopamine medi-
ate separate pathways involved in the induction of ethanol
tolerance [30]. Further, mutations in slowpoke, which
encodes a large-conductance calcium-activated potassium
channel, eliminate the capacity for rapid tolerance, defined as
reduction of the duration of sedation on a second exposure to
ethanol [31,32].
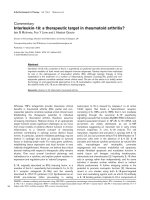
Inebriometer elution profiles of 3- to 5-day old (top) and 12- to 15-day old (bottom) flies after the initial (closed symbols, blue arrows) and a second, 2 h later (open symbols; red arrows) exposure to ethanolFigure 2
Inebriometer elution profiles of 3- to 5-day old (top) and 12- to 15-day old
(bottom) flies after the initial (closed symbols, blue arrows) and a second,
2 h later (open symbols; red arrows) exposure to ethanol.
0
5
10
15
20
25
30
5101520
0
5
10
15
20
25
30
5101520
Number of flies (percentage of total)
Elution time (min)
1st exposure
3-5 day old flies
12-15 day old flies
2nd exposure
Genome Biology 2006, Volume 7, Issue 10, Article R95 Morozova et al. R95.5
comment reviews reports refereed researchdeposited research interactions information
Genome Biology 2006, 7:R95
However, none of these genes exhibited significant altera-
tions in transcript abundance following one or two exposures
to ethanol in this study, at our false discovery rate threshold
of q < 0.05. Several factors could account for this discrepancy.
First, the genes may have low levels of expression in adult
flies, such as amnesiac and GABA-B-1, which had absent calls
Table 1
Probe sets with altered transcriptional regulation after ethanol exposure with q < 0.001
Probe set ID p value Gene name Biological process Changes in expression
1623332_at 1.91E-05 CG31106 Transmission of nerve impulse; carbohydrate
metabolism
Transient up-regulation
1623605_a_at 2.20E-05 Serpin-27A (M,H)* Toll signaling pathway; defense response Transient up-regulation
1624662_at 2.20E-05 CG11414 Protein ubiquitination Acute up-regulation
1624736_a_at 2.20E-05 CG11878 Unknown Slow up-regulation
1625193_at 2.20E-05 CG31272 Lipid metabolism; neurotransmitter secretion;
transport
Slow up-regulation
1626882_at 2.35E-05 Pinocchio Olfactory behavior;response to chemical
stimulus
Transient up-regulation
1627080_at 5.07E-05 CG14893 Unknown Slow up-regulation
1627385_at 6.86E-05 minidiscs Amino acid transport, metabolism Transient down-regulation
1628229_at 6.86E-05 Trypsin 29F Proteolysis Slow up-regulation
1628494_a_at 6.86E-05 CG33525 Negative regulation of transcription, DNA-
dependent
Slow up-regulation
1628647_at 1.06E-04 CG33110 Fatty acid biosynthesis; very-long-chain fatty
acid metabolism
Slow up-regulation
1628947_s_at 1.06E-04 Ecdysone-inducible gene L2 (M,H)* Cell adhesion Acute up-regulation
1629012_at 1.06E-04 period (M,H)* Long-term memory; circadian rhythm; signal
transduction; negative regulation of
transcription from RNA polymerase II
promoter
Transient down-regulation
1629592_at 1.32E-04
η
Trypsin (M,H)* Proteolysis Transient down-regulation
1629617_at 1.44E-04 cabut Regulation of transcription from RNA
polymerase II promoter; JNK cascade;
autophagic cell death
Acute up-regulation
1630302_at 1.66E-04 Odorant-binding protein 99d Transport; autophagic cell death Slow up-regulation
1631406_at 1.66E-04 CG3106 (M,H)* Unknown Transient down-regulation
1632222_a_at 2.25E-04 CG17752 Extracellular transport; cation transport Slow up-regulation
1632228_at 2.58E-04 CG10505 Response to toxin; extracellular transport;
defense response
Slow up-regulation
1633700_at 2.78E-04 antennal protein 10 (M,H)* Sensory perception of chemical stimulus Acute down-regulation
1633794_a_at 3.22E-04 antennal protein 5 Signal transduction Acute down-regulation
1633913_at 3.80E-04 Cytochrome P450-6a8 Electron transport; steroid metabolism; lauric
acid metabolism
Slow up-regulation
1634318_at 3.98E-04 lush Response to ethanol; sensory perception of
smell; olfactory behavior
Acute down-regulation
1634591_at 4.38E-04 Rpd3 Regulation of transcription from RNA
polymerase II promoter; determination of adult
life span; gene silencing
Slow up-regulation
1635815_at 5.47E-04 CG5819 (M,H)* Transmission of nerve impulse; cell adhesion Acute up-regulation
1636202_s_at 6.40E-04 CG8931 Transport Transient up-regulation
1636611_at 6.40E-04 Pheromone-binding protein-related protein
1 (M)*
Signal transduction; sensory perception;
response to pheromone
Acute down-regulation
1636771_at 6.40E-04 CG8562 Proteolysis Slow down-regulation
1638066_at 6.40E-04 CG9238 Glycogen metabolism Slow up-regulation
1638246_at 6.52E-04 Olfactory-specific E Signal transduction; response to pheromone;
transport
Acute down-regulation
1638452_at 7.01E-04 CG6733 Proteolysis Slow down-regulation
1639368_at 7.73E-04 CG5804 Lipid transport; cell acyl-CoA homeostasis Transient down-regulation
1639934_at 7.77E-04 capulet Actin filament organization; bristle
morphogenesis
Slow up-regulation
1640755_at 8.83E-04 Picot Phosphate metabolism; extracellular transport;
cation transport
Slow up-regulation
Transcripts that show sustained altered expression after the first exposure to ethanol are indicated as 'acutely up- or down-regulated genes'.
Transcripts that show altered expression only after the second exposure are designated as 'slowly up- or down-regulated genes'. The designation
'transient up-regulation' refers to genes that show increased expression after the first exposure to ethanol, but a return to control levels 2 h later
after the second exposure. *Genes that have human (H) and/or mouse (M) orthologues.
R95.6 Genome Biology 2006, Volume 7, Issue 10, Article R95 Morozova et al. />Genome Biology 2006, 7:R95
and were consequently not included in the analysis. Second,
the magnitude of the differences in expression may have been
too small to be detected with our experimental design. Fas2,
Pka-R2, rut, npf, hang and Tbh all exhibited changes in tran-
script abundance on exposure to ethanol, but the mean differ-
ences between treatments were not large enough to be
Table 2
P[GT1]-element insertion lines with transposon insertions at genes with ethanol-dependent altered transcriptional regulation
Gene symbol P-element insertion site Biological process Canton S* background Mean elution time (min)
†
(1st exposure)
Time shift (between 1st and
2nd exposures)
Slow down-regulation
Fkbp13 In 1st intron Protein folding A 6.7 ± 0.25 2 min
‡
↑
Sir2 410 bp in exon 1 Regulation of transcription,
DNA-dependent; chromatin
silencing
B 5.0 ± 0.2 2 min
§
↓
Bubblegum
H
In 1st intron Fatty acid metabolism C 6.2 ± 0.21 0.5 min (NS) ↓
Acute up-regulation
CG1516
H
125 bp upstream of
transcription initiation site
of the longest transcript
Pyruvate metabolism; fatty
acid biosynthesis
E 4.2 ± 0.12 1 min (NS) ↑
Transient up-regulation
Thor 431 bp upstream of
transcription initiation site
Negative regulation of
translational initiation;
response to stress; defense
response
E 7.5 ± 0.11; R 2.5 min
§
↑
Pyruvate dehydrogenase kinase
H
47 bp in exon 1 Pyruvate metabolism;
tricarboxylic acid cycle;
regulation of phosphate
metabolism
F 7.4 ± 0.30; R 1 min
‡
↑
Slow up-regulation
v(2)k05816
H
281 bp upstream of
transcription initiation site
Fatty acid biosynthesis A 6.1 ± 0.25 1 min (NS) ↑
elbow B
H
888 bp upstream of
transcription initiation site
Tracheal system
development
A 6.8 ± 0.26 0.5 min (NS) ↓
Hormone receptor-like in 38 1,428 kb upstream of
transcription initiation site
Regulation of transcription
from RNA polymerase II
promoter; intracellular
signaling cascade
A 5.8 ± 0.22; S 1 min (NS) ↓
nuclear fallout
H
In 4th intron Actin cytoskeleton
reorganization; microtubule-
based process
B 6.6 ± 0.30 1 min (NS) ↓
CG12505 136 bp upstream of
transcription initiation site
Unknown B 4.8 ± 0.18 1.5 min
‡
↓
tramtrack 219 bp in exon 1 of the
longest transcript
Regulation of transcription
from RNA polymerase II
promoter; peripheral
nervous system
development
B 5.8 ± 0.20 1 min
§
↑
CG9086
H
50 bp in exon 1 Protein ubiquitination B 6.1 ± 0.18 1.5 min
§
↓
CG6767 In 1st intron Nucleotide biosynthesis,
metabolism
B 7.0 ± 0.16; R 0.5 min (NS) ↑
CG32434 36 bp upstream of
transcription initiation site
Unknown B 6.1 ± 0.26 2 min
§
↓
frizzled 2
H
147 bp in exon 1 Signal transduction; G-
protein coupled receptor
protein signaling pathway
E 5.9 ± 0.13; R 2 min
§
↑
Malic enzyme
H
In 1st intron Malate metabolism;
tricarboxylic acid cycle
E 6.4 ± 0.15; R 6 min
¶
↑
CG9238 73 bp in exon 1 Glycogen metabolism F 7.6 ± 0.12; R 3.5 min
§
↑
spalt major
H
154 bp upstream of
transcription initiation site
Tracheal system
development; sensory organ
development; negative
regulation of transcription
F 6.9 ± 0.18; R 0.5 min (NS) ↓
lola In 1st intron Transmission of nerve
impulse; regulation of
transcription from RNA
polymerase II promoter
F 6.1 ± 0.11; R 3 min
§
↑
*See Additional data file 5 for mean elution times of P-element free Canton S genetic backgrounds A, B, C, E and F.
†
S and R designate P-element
insert lines that are significantly more sensitive or more resistant than the co-isogenic control, respectively (one-way ANOVA). An H after a gene
symbol indicates genes that have human orthologues. Up and down arrows designate increase or decrease, respectively, in the time shift between the
first and second ethanol exposure compared with the co-isogenic control (Student's t-test).
‡
p < 0.05,
§
p < 0.01,
¶
p < 0.001. bp, base-pairs; NS, not
significant.
Genome Biology 2006, Volume 7, Issue 10, Article R95 Morozova et al. R95.7
comment reviews reports refereed researchdeposited research interactions information
Genome Biology 2006, 7:R95
significant. Third, differences in the definition of tolerance
may be relevant. slowpoke expression in the nervous system
is required for tolerance defined as reduced sedation on a sec-
ond exposure to ethanol four hours after the initial exposure
[31,32] but the effects of reduced slowpoke expression have
not been tested in our paradigm. Fourth, the mutational
effects may be due to post-transcriptional regulation. Never-
theless, our results point at modulation of a complex genetic
network upon alcohol exposure, in contrast to a simple linear
model of two distinct and independent cellular pathways
[30].
Next, we asked to what extent genes with altered expression
on the microarrays (Additional data file 2) can be causally
implicated in determining alcohol sensitivity or the tolerance
response. We identified 20 genes with altered transcription
following alcohol exposure for which co-isogenic P-element
insert lines were available with a transposon insertion in or
near the candidate gene [12], and determined elution profiles
during the initial alcohol exposure and two hours later. Five
replicate assays were performed for each line and mean elu-
tion times were compared to the appropriate co-isogenic P-
element free control strains in either the Canton-S A, B, C, E
or F genetic backgrounds (Table 2). One line shows greater
sensitivity and seven lines are more resistant to a single alco-
hol exposure than the controls. Four lines show a statistically
significant reduction in the peak shift of the modal elution
time two hours after the initial exposure, whereas seven
showed a greater shift in modal elution time after developing
alcohol tolerance. It is of interest to note that three P-element
insertion lines in the Canton-S E genetic background, which
itself shows only a small tolerance response (Figure 1a), show
substantially increased tolerance responses when trans-
posons are inserted in or near the Malic enzyme, Thor or fz2
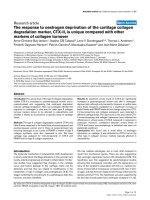
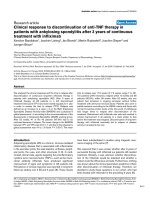
genes. Overall, there is a significant positive correlation (r =
0.61 ± 0.187, 0.001 <p < 0.01) between the mutational effects
on the initial sensitivity to the inebriating effects of ethanol
and the subsequent development of tolerance (Table 2, Figure
3). While mutations in genes associated with increased resist-
ance to the first exposure to alcohol tend to develop greater
tolerance (for example, Thor, Malic enzyme, CG9248), there
are also many instances of mutations affecting only increased
(for example, Fkbp13, lola) or decreased (for example, Sir2,
CG9238) induction of tolerance, indicating that the develop-
ment of tolerance is a process that is at least partially inde-
pendent from initial sensitivity to alcohol exposure.
In total, 15 P-element insertion lines (75%) show altered
responsiveness to ethanol exposure compared to controls
(Table 2); 6 of these lines had mutational effects on both ini-
tial response and tolerance; 6 affected only tolerance, and 3
affected only the initial response. This percentage is similar to
a previous study in which 67% of co-regulated genes identi-
fied on expression microarrays of single P-element insert
smell impaired mutations could be implicated in an epistatic
network that mediates olfactory avoidance behavior [33].
Thus, expression microarray analysis is an efficient method
for identifying candidate genes affecting complex behavioral
and physiological traits.
Among the 15 P-element [34] insertion lines that tag genes
with differences in transcript abundance on exposure to eth-
anol, 10 have human orthologues (Table 2), including 5
enzymes associated with intermediary metabolism and fatty
acid biosynthesis (CG1516, Pyruvate dehydrogenase kinase,
Malic enzyme, bubblegum and v(2)k05816 with correspond-
ing human orthologues pyruvate carboxylase (PC), Pyruvate
dehydrogenase kinase, isoenzyme 3 (PDK3), Malic enzyme 1,
NADP(+)-dependent (ME1), bubblegum related protein
(BGR), and fatty acid synthase (FASN)), three transcription
factors (elbow B, spalt major and frizzled 2 with correspond-
ing human orthologues zinc finger protein 503 (ZNF503),
sal-like1 (SALL1) and frizzled homolog 8 (FZD8)), CG9086
(with human orthologue Ubiquitin protein ligase E3 compo-
nent n-recognin 2 (UBR2)), and nuclear fallout (with human
orthologue RAB11 family interacting protein 4
(RAB11FIP4)).
Alcohol-induced fatty acid biosynthesis is well documented in
heavy drinkers and leads to alcohol induced fatty liver syn-
drome in alcohol-dependent people [35,36]. The identifica-
tion of multiple enzymes associated with intermediary
metabolism and fatty acid biosynthesis in the response to
alcohol exposure in Drosophila is, therefore, of particular
interest. Pyruvate carboxylase, malic enzyme and pyruvate
dehydrogenase kinase are critical regulators of intermediary
metabolism (Figure 4). Another gene with altered transcrip-
tional regulation, CG5629, is also of interest, even though no
Correlation between initial sensitivity to the inebriating effects of ethanol and the subsequent development of tolerance for 20 P-element mutant linesFigure 3
Correlation between initial sensitivity to the inebriating effects of ethanol
and the subsequent development of tolerance for 20 P-element mutant
lines. All values are expressed as deviations from the co-isogenic control
line.
-3
-2
-1
0
1
2
3
4
5
6
7
-2 -1 0 1 2 3 4
Tolerance
(deviation from control)
Initial sensitivity
(deviation from contro
l)
R95.8 Genome Biology 2006, Volume 7, Issue 10, Article R95 Morozova et al. />Genome Biology 2006, 7:R95
homozygous viable co-isogenic P-element insertion line is
available. CG5629 encodes an orthologue of phosphopan-
tothenyl cysteine synthetase, which is critical for fatty acid
biosynthesis as it participates in the biosynthesis of Coen-
zyme A. Genes associated with pyruvate metabolism, includ-
ing pyruvate carboxylase and pyruvate dehydrogenase
kinase, also showed altered transcriptional regulation in alco-
hol preferring inbred mice [19]. These observations point to a
central role for pyruvate metabolism in determining alcohol
sensitivity and suggest that the cyclic metabolic pathway,
which enables transport of acetyl-CoA across the mitochon-
drial membrane and generation of cytosolic NADPH, both
critical substrates for fatty acid metabolism, is an important
determinant for the ability to develop alcohol tolerance (Fig-
ure 4).
Conclusion
Drosophila provides a powerful model for the identification
of genes that respond to alcohol exposure. Dependent on
their genetic background, flies can develop tolerance after an
initial exposure, and transcriptional profiling shows that the
development of tolerance is a process that is at least partially
independent from initial sensitivity to alcohol. A significant
fraction of genes implicated in the response to alcohol in flies
have human orthologues and form part of conserved cellular
and metabolic pathways. Whereas most studies on alcohol-
ism in human populations have targeted genes associated
with neurotransmission, our findings from the Drosophila
model suggest that it might be fruitful to refocus some of
these efforts on other targets, including (but not limited to)
biotransformation pathways, transcriptional regulators, pro-
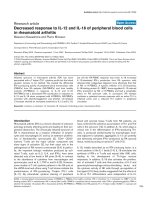
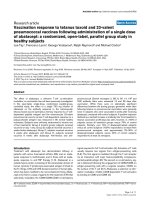
Identification of a conserved metabolic network likely to be associated with alcohol sensitivity in flies and humansFigure 4
Identification of a conserved metabolic network likely to be associated with alcohol sensitivity in flies and humans. Ethanol is converted via the alcohol
dehydrogenase and aldehyde dehydrogenase reactions into acetate, which is subsequently conjugated to co-enzyme A (CoA; not shown). The biosynthetic
pathway of co-enzyme A is schematically depicted in the red box. Acetyl-CoA produced in excess can be converted into fatty acids. The diagram highlights
auxiliary pathways for the biosynthesis of fatty acids. The blue box illustrates how pyruvate carboxylase and malic enzyme mediate a cyclic metabolic
pathway, which via the mitochondrial citrate and pyruvate transporters results in the net transport of acetyl-CoA across the mitochondrial membrane and
generation of cytosolic NADPH, both critical substrates for fatty acid metabolism. An alternative metabolic pathway is the direct conversion of pyruvate
into acetyl-CoA via the pyruvate dehydrogenase complex. This complex is inhibited through phosphorylation by pyruvate dehydrogenase kinase.
C
O
H
O
C
C
O
3
pyruvate
C
O
H
O
C
C
O
2
C
OO
oxaloacetate
pyruvate
carboxylase
ATP
ADP
CO
2
C
O
H
O
C
C
OH
2
C
OO
H
malate
malate
dehydrogenase
NADH
NAD
+
malic enzyme
NADP
NADPH
+
CO
2
fatty acid
synthesis
mitochondrion cytosol
oxaloacetate oxaloacetate
pyruvate pyruvate
citrate citrate
acetylCoA
acetylCoA
NADH
Malate
NADPH
Phosphopantothenyl
cysteine synthetase
4-phosphopantothenate
Coenzyme A
pyruvate
dehydrogenase
complex
pyruvate dehydrogenase kinase
NADH
NAD
+
CoA
4-phosphopantothenyl -
cysteine
C
O
H
O
C
C
O
3
C
O
H
O
C
C
O
3
pyruvate
C
O
H
O
C
C
O
2
C
OO
C
O
H
O
C
C
O
2
C
O
H
O
C
C
O
2
C
OO
C
OO
oxaloacetate
ATP
ADP
CO
2
CO
2
C
O
H
O
C
C
OH
2
C
OO
H
C
O
H
O
C
C
OH
2
C
OO
C
OO
H
malate
NADH
NAD
+
NADP
NADPH
+
CO
2
CO
2
fatty acid
synthesis
mitochondrion cytosol
oxaloacetate oxaloacetate
pyruvate pyruvate
citrate citrate
acetylCoA
acetylCoA
NADH
Malate
NADPH
4-phosphopantothenate
Coenzyme A
pyruvate
dehydrogenase
complex
NADH
NAD
+
CoA
4-phosphopantothenyl -
cysteine
Genome Biology 2006, Volume 7, Issue 10, Article R95 Morozova et al. R95.9
comment reviews reports refereed researchdeposited research interactions information
Genome Biology 2006, 7:R95
teolysis and enzymes that act as metabolic switches in the reg-
ulation of fatty acid metabolism.
Materials and methods
Drosophila stocks
Flies used for microarray experiments were in an isogenic
Canton-S B genetic background. Homozygous P-element
insertion lines contained P(GT1)-elements [34] in or near
candidate genes in co-isogenic Canton S A, B, C, E or F back-
grounds and were generated by Dr Hugo Bellen (Baylor Col-
lege of Medicine, Houston, TX, USA) as part of the Berkeley
Drosophila Genome Project [12]. Behavioral assays were con-
ducted between 9:00 am and 1:00 pm. Flies were not exposed
to CO
2
anesthesia for at least 24 h prior to the assay. All flies
were reared on cornmeal/molasses/agar medium under
standard culture conditions (25°C, 12:12 hour light/dark
cycle).
Alcohol sensitivity and tolerance
To quantify alcohol sensitivity, we tested flies (5 replicates/
genotype, N = 100/replicate) in an inebriometer [11] pre-
equilibrated with ethanol vapor, from which they were eluted
at one minute intervals. The mean elution time is a measure
of alcohol sensitivity. To measure alcohol tolerance [10], we
subjected flies to an initial exposure to ethanol, and recorded
their elution profile as described above. We allowed the flies
to recover for 2 h, and then repeated the assay with the same
flies. The difference in the shift of modal elution times (5 rep-
licates/genotype, N = 100/replicate) between the second and
first assays is a measure of tolerance. We used analysis of var-
iance to assess whether the sensitivity of P-element insertion
lines differed significantly from the control, according to the
model:
Y =
µ
+ L + R(L) +
ε
where
µ
is the overall mean, L is the fixed effect of line (P-ele-
ment insertion versus control), R is the random effect of rep-
licate, nested within line, and
ε
is the variance within
replicates. We used t-tests to assess the significance of the
difference in modal elution times between the first and sec-
ond exposures.
Whole genome expression analysis
To assess transcriptional regulation after ethanol exposure,
we used 3 to 5 day old Canton-S B males. We collected five
replicates of pools of 30 flies with 0, 1 or 2 exposures to etha-
nol. For each replicate, we began with two groups of >100
flies. A total of 15 flies from each group was not exposed to
ethanol (control flies; Figure 1b) and were pooled and frozen
immediately on dry ice. We passed the remaining flies from
each group through the inebriometer, and collected individu-
als that eluted at 3 to 5 minutes (the peak elution time for the
first exposure; Figure 1b). A total of 15 of these flies from each
group was pooled and frozen immediately on dry ice. The
remaining flies were kept on standard fly food for 2 h. They
were then passed once again through the inebriometer in 2
groups, and 15 flies from each group that eluted at 7 to 10
minutes (the peak elution time for the 2nd exposure; Figure
1b) were collected, pooled, and frozen.
Total RNA was extracted from the 15 samples (three treat-
ments × five replicates/treatment) using the Trizol reagent
(Gibco BRL, Gaithersburg MD, USA). Biotinylated cRNA
probes were hybridized to high density oligonucleotide
microarrays (Drosophila GeneChip 2.0, Affymetrix Inc.,
Santa Clara, CA, USA) and visualized with a streptavidin-phy-
coerythrin conjugate, as described in the Affymetrix Gene-
Chip Expression Analysis Technical Manual (2000), using
internal references for quantification.
Data analysis
The quantitative estimate of expression of each probe set is
the Signal (Sig) metric, as described in the Affymetrix Micro-
array Suite, Version 5.0. The 18,769 probe sets on the Affyme-
trix Drosophila GeneChip 2.0 are represented by 14 perfect-
match (PM) and 14 mismatch (MM) pairs. The Sig metric is
computed using the weighted log(PM-MM) intensity for each
probe set, and was scaled to a median intensity of 500. A
detection call of Present, Absent, or Marginal is also reported
for each probe set. We excluded all probe sets with samples
called 'Absent' from the analysis. On the remaining probe
sets, we conducted one-way fixed effect ANOVAs of the Sig-
nal metric using the GLM procedure in SAS [37], with the fol-
lowing model:
Y =
µ
+ T +
ε
where Y is the observed value for each treatment,
µ
is the
overall mean value, T is the fixed effect of treatment and
ε
is
the error variance between replicate arrays. We corrected the
p values for multiple tests by calculating the false positive dis-
covery rate q-value, which estimates the proportion of false
positives among all terms declared significant [13] and used a
confidence level of q < 0.05 as measure of statistical signifi-
cance. We identified 582 probe sets with altered transcrip-
tional regulation at q < 0.05 (Additional data file 2) and
performed further analysis by post hoc Tukey tests using the
MEANS procedure in SAS [37] to identify the direction (up-
or down-regulation) of expression between treatment groups
(control, 1st exposure, and 2nd exposure) at the p < 0.05
level. Gene ontology categories were annotated using Affyme-
trix [14] and FlyBase [15,16] compilations. We conducted χ
2
tests to determine which categories are over- or under-repre-
sented by probe sets that are significantly up- or down-regu-
lated between treatment groups compared to the expected
number of genes in each category based on its representation
on the microarray (Additional data files 3 and 4). The micro-
array data discussed in this publication have been deposited
in NCBIs Gene Expression Omnibus [38] and are accessible
through GEO Series number GSE5382 [39].
R95.10 Genome Biology 2006, Volume 7, Issue 10, Article R95 Morozova et al. />Genome Biology 2006, 7:R95
Additional data files
The following additional data are available with the online
version of this paper. Additional data file 1 contains raw
microarray data without any analysis. Additional data file 2 is
a list of all probe sets differentially expressed between treat-
ment groups with q < 0.05. Additional data file 3 contains
biological process gene ontology categories of the genes listed
in Additional data file 2. Additional data file 4 contains
molecular function gene ontology categories of genes listed in
Additional data file 2. Additional data file 5 lists information
regarding influences of different genetic backgrounds on eth-
anol sensitivity and tolerance development.
Additional data file 1Raw microarray data without any analysisRaw microarray data without any analysis.Click here for fileAdditional data file 2List of all probe sets differentially expressed between treatment groups with q < 0.05List of all probe sets differentially expressed between treatment groups with q < 0.05.Click here for fileAdditional data file 3Biological process gene ontology categories of the genes listed in Additional data file 2Biological process gene ontology categories of the genes listed in Additional data file 2.Click here for fileAdditional data file 4Molecular function gene ontology categories of genes listed in Additional data file 2Molecular function gene ontology categories of genes listed in Additional data file 2.Click here for fileAdditional data file 5Influences of different genetic backgrounds on ethanol sensitivity and tolerance developmentInfluences of different genetic backgrounds on ethanol sensitivity and tolerance development.Click here for file
Acknowledgements
We thank RF Lyman for advice with data analysis. This work was supported
by grants from the National Institutes of Health (to RRHA and TFCM). This
is a publication of the WM Keck Center for Behavioral Biology.
References
1. National Institute on Alcohol Abuse and Alcoholism of the
National Institutes of Health []
2. Crabbe JC, Phillips TJ, Buck KJ, Cunningham CL, Belknap JK: Identi-
fying genes for alcohol and drug sensitivity: recent progress
and future directions. Trends Neurosci 1999, 22:173-179.
3. Fehr C, Shirley RL, Belknap JK, Crabbe JC, Buck KJ: Congenic map-
ping of alcohol and pentobarbital withdrawal liability loci to
a <1 centimorgan interval of murine chromosome 4: identi-
fication of Mpdz as a candidate gene. J Neurosci 2002,
22:3730-3738.
4. Mulligan CJ, Robin RW, Osier MV, Sambuughin N, Goldfarb LG, Kit-
tles RA, Hesselbrock D, Goldman D, Long JC: Allelic variation at
alcohol metabolism genes (ADH1B, ADH1C, ALDH2) and
alcohol dependence in an American Indian population. Hum
Genet 2003, 113:325-336.
5. Radel M, Vallejo RL, Iwata N, Aragon R, Long JC, Virkkunen M, Gold-
man D: Haplotype-based localization of an alcohol depend-
ence gene to the 5q34 γ-aminobutyric acid type A gene
cluster. Arch Gen Psychiatry 2005, 62:47-55.
6. Goldman D, Oroszi G, Ducci F: The genetics of addictions:
uncovering the genes. Nat Rev Genet 2005, 6:521-532.
7. Sinha R, Cloninger CR, Parsian A: Linkage disequilibrium and
haplotype analysis between serotonin receptor 1B gene var-
iations and subtypes of alcoholism. Am J Med Genet B Neuropsy-
chiatr Genet 2003, 121:83-88.
8. Singh CM, Heberlein U: Genetic control of acute ethanol-
induced behaviors in Drosophila. Alcohol Clin Exp Res 2000,
24:1127-1136.
9. Wolf FW, Rodan AR, Tsai LT, Heberlein U: High-resolution anal-
ysis of ethanol-induced locomotor stimulation in Drosophila.
J Neurosci 2002, 22:11035-11044.
10. Scholz H, Ramond J, Singh CM, Heberlein U: Functional ethanol
tolerance in Drosophila. Neuron 2000, 28:261-271.
11. Weber KE: An apparatus for measurement of resistance to
gas-phase reagents. Drosophila Inform Serv 1988, 67:91-93.
12. Bellen HJ, Levis RW, Liao G, He Y, Carlson JW, Tsang G, Evans-Holm
M, Hiesinger PR, Schulze KL, Rubin GM, et al.: The BDGP gene dis-
ruption project: single transposon insertions associated with
40% of Drosophila genes. Genetics 2004, 167:761-781.
13. Storey JD, Tibshirani R: Statistical significance for genomewide
studies. Proc Natl Acad Sci USA 2003, 100:9440-9445.
14. Affymetrix: Netaffx Analysis Center [yme
trix.com]
15. The FlyBase Consortium: The FlyBase Database of the Dro-
sophila Genome Projects and Community Literature [http:/
/flybase.bio.indiana.edu]
16. Drysdale RA, Crosby MA: FlyBase: genes and gene models.
Nucleic Acids Res 2005, 33:D390-395.
17. Larsson MC, Domingos AI, Jones WD, Chiappe ME, Amrein H,
Vosshall LB: Or83b encodes a broadly expressed odorant
receptor essential for Drosophila olfaction. Neuron 2004,
43:703-714.
18. Rollmann SM, Mackay TF, Anholt RR: Pinocchio, a novel protein
expressed in the antenna, contributes to olfactory behavior
in Drosophila melanogaster. J Neurobiol 2005, 63:146-158.
19. Mulligan MK, Ponomarev I, Hitzemann RJ, Belknap JK, Tabakoff B,
Harris RA, Crabbe JC, Blednov YA, Grahame NJ, Phillips TJ, et al.:
Toward understanding the genetics of alcohol drinking
through transcriptome meta-analysis. Proc Natl Acad Sci USA
2006, 103:6368-6373.
20. Kim MS, Repp A, Smith DP: LUSH odorant-binding protein
mediates chemosensory responses to alcohols in Drosophila
melanogaster. Genetics 1998, 150:711-721.
21. Xu P, Atkinson R, Jones DN, Smith DP: Drosophila OBP LUSH is
required for activity of pheromone-sensitive neurons. Neuron
2005, 45:193-200.
22. Flatscher-Bader T, van der Brug M, Hwang JW, Gochee PA, Mat-
sumoto I, Niwa S, Wilce PA: Alcohol-responsive genes in the
frontal cortex and nucleus accumbens of human alcoholics.
J Neurochem 2005, 93:359-370.
23. Spanagel R, Pendyala G, Abarca C, Zghoul T, Sanchis-Segura C, Mag-
none MC, Lascorz J, Depner M, Holzberg D, Soyka M, et al.: The
clock gene Per2 influences the glutamatergic system and
modulates alcohol consumption. Nat Med 2005, 11:35-42.
24. Moore MS, DeZazzo J, Luk AY, Tully T, Singh CM, Heberlein U: Eth-
anol intoxication in Drosophila: Genetic and pharmacological
evidence for regulation by the cAMP signaling pathway. Cell
1998, 93:997-1007.
25. Feany MB, Quinn WG: A neuropeptide gene defined by the
Drosophila memory mutant amnesiac. Science 1995,
268:869-873.
26. Cheng Y, Endo K, Wu K, Rodan AR, Heberlein U, Davis RL: Dro-
sophila fasciclinII is required for the formation of odor mem-
ories and for normal sensitivity to alcohol. Cell 2001,
105:757-768.
27. Park SK, Sedore SA, Cronmiller C, Hirsh J: Type II cAMP-depend-
ent protein kinase-deficient Drosophila are viable but show
developmental, circadian, and drug response phenotypes. J
Biol Chem 2000, 275:20588-20596.
28. Dzitoyeva S, Dimitrijevic N, Manev H: Gamma-aminobutyric acid
B receptor 1 mediates behavior-impairing actions of alcohol
in Drosophila: adult RNA interference and pharmacological
evidence. Proc Natl Acad Sci USA 2003, 100:5485-5490.
29. Wen T, Parrish CA, Xu D, Wu Q, Shen P: Drosophila neuropeptide
F and its receptor, NPFR1, define a signaling pathway that
acutely modulates alcohol sensitivity. Proc Natl Acad Sci USA
2005, 102:2141-2146.
30. Scholz H, Franz M, Heberlein U: The hangover gene defines a
stress pathway required for ethanol tolerance development.
Nature 2005, 436:845-847.
31. Cowmeadow RB, Krishnan HR, Atkinson NS: The slowpoke gene
is necessary for rapid ethanol tolerance in Drosophila. Alcohol
Clin Exp Res 2005, 29:1777-1786.
32. Cowmeadow RB, Krishnan HR, Ghezzi A, Al'Hasan YM, Wang YZ,
Atkinson NS: Ethanol tolerance caused by slowpoke induction
in Drosophila. Alcohol Clin Exp Res 2006, 30:745-753.
33. Anholt RR, Dilda CL, Chang S, Fanara JJ, Kulkarni NH, Ganguly I, Roll-
mann SM, Kamdar KP, Mackay TF: The genetic architecture of
odor-guided behavior in Drosophila: epistasis and the
transcriptome. Nat Genet 2003, 35:180-184.
34. Lukacsovich T, Asztalos Z, Awano W, Baba K, Kondo S, Niwa S,
Yamamoto D: Dual-tagging gene trap of novel genes in Dro-
sophila melanogaster. Genetics 2001, 157:727-742.
35. Lieber CS: Alcoholic fatty liver: its pathogenesis and mecha-
nism of progression to inflammation and fibrosis. Alcohol
2004, 34:9-19.
36. You M, Crabb DW: Recent advances in alcoholic liver disease
II. Minireview: molecular mechanisms of alcoholic fatty liver.
Am J Physiol Gastrointest Liver Physiol 2004, 287:G1-6.
37. SAS Institute: SAS/STAT User's Guide. Release 6.12 Cary, NC: SAS
Institute; 1988.
38. Barrett T, Suzek TO, Troup DB, Wilhite SE, Ngau WC, Ledoux P,
Rudnev D, Lash AE, Fujibuchi W, Edgar R: NCBI GEO: mining mil-
lions of expression profiles - database and tools. Nucleic Acids
Res 2005, 33:D562-566.
39. GEO: NCBI Gene Expression Omnibus [http://
www.ncbi.nlm.nih.gov/geo/query/acc.cgi?acc=GSE5382]