Báo cáo y học: "Dissection of a metastatic gene expression signature into distinct components" ppsx
Bạn đang xem bản rút gọn của tài liệu. Xem và tải ngay bản đầy đủ của tài liệu tại đây (765.81 KB, 12 trang )
Genome Biology 2006, 7:R117
comment reviews reports deposited research refereed research interactions information
Open Access
2006Roepmanet al.Volume 7, Issue 12, Article R117
Research
Dissection of a metastatic gene expression signature into distinct
components
Paul Roepman
*
, Erica de Koning
†
, Dik van Leenen
*
, Roel A de Weger
†
, J
Alain Kummer
†
, Piet J Slootweg
†
and Frank CP Holstege
*
Addresses:
*
Department of Physiological Chemistry, University Medical Center Utrecht, Universiteitsweg, Utrecht, the Netherlands.
†
Department of Pathology, University Medical Center Utrecht, Heidelberglaan, Utrecht, the Netherlands.
Correspondence: Frank CP Holstege. Email:
© 2006 Roepman et al.; licensee BioMed Central Ltd.
This is an open access article distributed under the terms of the Creative Commons Attribution License ( which
permits unrestricted use, distribution, and reproduction in any medium, provided the original work is properly cited.
Diagnostic signature dissection<p>The dissection of predictive expression signatures into different components based on tumor versus stroma expression shows a strik-ingly skewed distribution of metastasis associated genes.</p>
Abstract
Background: Metastasis, the process whereby cancer cells spread, is in part caused by an
incompletely understood interplay between cancer cells and the surrounding stroma. Gene
expression studies typically analyze samples containing tumor cells and stroma. Samples with less
than 50% tumor cells are generally excluded, thereby reducing the number of patients that can
benefit from clinically relevant signatures.
Results: For a head-neck squamous cell carcinoma (HNSCC) primary tumor expression signature
that predicts the presence of lymph node metastasis, we first show that reduced proportions of
tumor cells results in decreased predictive accuracy. To determine the influence of stroma on the
predictive signature and to investigate the interaction between tumor cells and the surrounding
microenvironment, we used laser capture microdissection to divide the metastatic signature into
six distinct components based on tumor versus stroma expression and on association with the
metastatic phenotype. A strikingly skewed distribution of metastasis associated genes is revealed.
Conclusion: Dissection of predictive signatures into different components has implications for
design of expression signatures and for our understanding of the metastatic process. Compared to
primary tumors that have not formed metastases, primary HNSCC tumors that have metastasized
are characterized by predominant down-regulation of tumor cell specific genes and exclusive up-
regulation of stromal cell specific genes. The skewed distribution agrees with poor signature
performance on samples that contain less than 50% tumor cells. Methods for reducing tumor
composition bias that lead to greater predictive accuracy and an increase in the types of samples
that can be included are presented.
Background
DNA microarray technology has advanced our understanding
of cancer by providing genome-wide mRNA expression meas-
urements of different tumor types [1-3]. Such studies have
been used to identify new subtypes of cancer [4-7]. Specific
gene expression signatures have been found that can predict
treatment response [8], metastatic disease [9,10], and recur-
rence rate [11] and that are associated with poor outcome in
Published: 11 December 2006
Genome Biology 2006, 7:R117 (doi:10.1186/gb-2006-7-12-r117)
Received: 20 October 2006
Revised: 29 November 2006
Accepted: 11 December 2006
The electronic version of this article is the complete one and can be
found online at />R117.2 Genome Biology 2006, Volume 7, Issue 12, Article R117 Roepman et al. />Genome Biology 2006, 7:R117
cancer patients [12,13]. Despite the fact that some aspects of
signature discovery studies still need optimization [14-16],
the potential of cancer genomics is already starting to be real-
ized, with the first signatures becoming available for use in
the clinic or in their final prospective validation phase [17].
Although in a few cases laser capture microdissection (LCM)
has been applied [18,19], expression profiling studies of solid
tumors generally employ whole tumor sections consisting of
tumor cells and the surrounding tissue microenvironment.
This includes extracellular matrix components and stromal
cells, such as fibroblasts and immune response cells [20].
Because gene expression patterns are thus derived from both
tumor cells and tumor stroma, it is important to consider the
degree to which inclusion of stromal cells influences the out-
come of tumor profiling studies.
This general question is particularly interesting when consid-
ering signatures for prediction of metastasis. Metastasis is the
process whereby cancer cells spread to other sites in the body
and is the principal cause of cancer-related deaths. To choose
appropriate treatment strategies, it is of great importance to
assess the presence of metastasis in cancer patients [21]. It
has recently become clear that stromal cells play an active role
in tumor cell dissemination, which is caused by tumor-host
interactions in which the microenvironment surrounding the
tumor cells is an active partner during invasion and meta-
static spread of cancerous cells [20,22-24]. Indeed, functional
analysis of metastasis predictive signatures has indicated that
these signatures likely also contain many genes that are spe-
cifically expressed in tumor stroma [9,10,25].
Although it has recently become clear that tumor stroma
plays an important role in tumor invasion and metastasis,
cancer research has traditionally focused on processes within
tumor cells. Microarray studies generally only include tumor
sections with a high percentage of tumor cells, thereby
excluding a significant number of samples from signature
analysis. To increase the number of patients that may benefit
from newly developed diagnostic signatures, it is worthwhile
to consider ways of designing signatures that also take into
account tumor samples with low tumor cell percentages.
Increased focus on stroma components will also likely
improve our understanding of the mechanisms underlying
tumorigenesis.
Head and neck squamous cell carcinomas (HNSCCs) arise in
the upper aero-digestive tract and are the fifth most common
malignancy in western populations, occurring with a rising
frequency world-wide due to increased general life-expect-
ancy and an increase in alcohol and tobacco consumption
[26,27]. As with other tumor types, appropriate treatment
depends on assessment of disease progression and, in partic-
ular, on assessment of the presence of metastases in regional
lymph nodes close to the site of the primary tumor. Due to dif-
ficulties in detecting such (micro-)metastases reliably, a large
number of patients do not currently receive the most appro-
priate treatment [28-30]. Several expression signatures have
recently been reported for HNSCCs that can discriminate
between metastasizing and benign tumors [25,31-33].
Although large-scale multi-center validation is still under-
way, assessment of independent samples indicates that
implementation in clinical practice may improve treatment
for up to 65% of patients with HNSCC in the oral cavity and
oropharynx [25].
As with other solid-tumor profiling studies, one of the criteria
for inclusion of samples in the latter study was the presence
of more than 50% tumor cells in analyzed sections [13]. Here
we investigate the influence of stroma/tumor percentage and
show that the metastatic state of samples with lower tumor
cell percentage is less accurately predicted. Using LCM to
generate 35 related samples with artificially altered propor-
tions of stroma versus tumor cells, the loss of predictive accu-
racy and the relationship between tumor cells and stroma is
investigated further. The expression patterns of 685 metasta-
sis associated genes are determined, leading to dissection of
the metastatic signature into several components based on
expression in tumor versus stroma and association with a
metastatic or non-metastatic phenotype. The signature genes
are very unevenly distributed over the different components,
which has implications for our understanding of the meta-
static process and for the design of expression signatures.
Results
Decrease in tumor cell percentage reduces predictive
accuracy
HNSCC lymph node metastasis signatures have previously
been identified using complete primary tumor sections that
contain both tumor cells and tumor stroma [25]. Samples
containing less than 50% tumor cells were excluded from this
previous study, which resulted in identification of over 800
metastasis associated genes useful for prediction in a variety
of signature compositions [34]. Within the samples included
in these previous studies, a trend towards lower predictive
accuracy for lower tumor percentage samples is indicated
(Figure 1a, gray bars). This trend is even more apparent upon
analysis of new samples with lower than 50% tumor cells
(Figure 1a, white bar). Starting from the optimum tumor per-
centage of 60% to 70% (Figure 1c), the discriminatory power
of the predictor is clearly reduced for samples containing less
than 50% tumor cells (Figure 1b), which is in agreement with
the decrease in predictive accuracy (Figure 1a). Interestingly,
samples with the highest tumor percentage also show a slight
loss of discriminatory power (Figure 1c), indicating that there
may be an optimal composition of tumor sample sections for
accurate prediction of the metastatic state. These results indi-
cate a decrease in predictive accuracy that is related to an
increased portion of stromal cells in tumor sections, despite
the fact that metastatic signatures carry a considerable
Genome Biology 2006, Volume 7, Issue 12, Article R117 Roepman et al. R117.3
comment reviews reports refereed researchdeposited research interactions information
Genome Biology 2006, 7:R117
number of genes that are likely expressed in the stroma
[9,34].
Laser capture microdissection derived samples reveal
a predictive bias
Analysis of the influence of tumor cell percentage is con-
founded by the availability of sufficient samples representing
a wide range of section compositions and, within each range
of compositions, the availability of enough samples repre-
senting the possible predictive outcomes, that is, either with
metastasis (N+) or without metastasis (N0). To circumvent
this problem we applied LCM to generate, from complete pri-
mary tumor sections, multiple artificial samples that differed
only in tumor percentage (see Figure 2 and Materials and
methods for details). The samples chosen for this analysis
represent a range of predictive accuracies for both the N0 and
N+ outcome, including samples that are only marginally well
predicted (Figure 3a, first column). A total of 35 artificial
samples were generated by varying the proportion of tumor
cells between 0% and 100%. The advantage of this approach
is that any difference in signature profile between multiple
artificial samples derived from a single tumor is entirely due
to the different tumor percentages rather than individual
sample heterogeneity. To determine whether this approach is
valid, we first tested whether LCM samples that retained the
original tumor percentage (Figure 2h) show the same signa-
ture outcome as the original complete tumor sections. The
results of this analysis (Figure 3a, third column versus second
column) confirm that generating artificial samples with LCM
and implementation of the required additional RNA amplifi-
cation procedure does itself not spoil the predictive outcome
(Figure 3a).
From each of seven primary HNSCC tumor samples (three
N0 and four N+, in which one N+ sample (A16) was weakly
classified as N0), five artificial samples were created by com-
bining isolated tumor (Figure 2b) and stromal areas (Figure
2e) in different proportions, thereby generating a total of 35
samples consisting of 0%, 25%, 50%, 75% or 100% tumor
cells. Dye-swap replicate DNA microarray analysis was per-
formed for these 35 samples and the HNSCC predictive signa-
ture outcome was tested using a predictor consisting of 685
genes. These were selected from a total of 825 metastasis
associated genes [34] by removing genes that showed any bias
in the double amplification procedure required for analysis of
the small amounts of material available by LCM (see Materi-
als and methods). Intriguingly, the predictive outcome was
considerably influenced by tumor percentage (Figure 3b).
This is especially true for samples with a low tumor content
and agrees with the trend observed for the low tumor percent-
age sections shown in Figure 1a. Although differences
between N0 and N+ tumors still remain, all seven analyzed
tumors showed a bias towards a metastatic (N+) profile upon
increase of the stroma percentage and a bias towards a non-
metastasis (N0) profile upon increase in tumor cell percent-
age. Since this counterintuitive tumor percentage predisposi-
Predictive accuracy of the metastatic signature decreases for samples with low tumor percentageFigure 1
Predictive accuracy of the metastatic signature decreases for samples with
low tumor percentage. (a) Predictive accuracy of the metastatic HNSCC
signature per tumor percentage group. The predictive accuracy is
expressed as the percentage of samples for which the previously published
120-gene primary tumor signature [25] correctly determined the absence
or presence of metastasis based on comparison with histological
examination of surgically removed neck lymph tissue. Signature outcome
for samples with a tumor percentage of (b) 50% or less, (c) between 60%
and 70% and (d) 80% or more. A signature outcome less than zero
indicates a metastatic (N+) profile and an outcome above zero indicates a
non-metastatic (N0) outcome. Solid circles indicate tumor samples from
patients with metastasis; open circles indicate tumor samples from
patients without metastasis.
50
60
70
80
90
100
<50
50 60 70
80
(%)
tumor percentage group
>90
-
50% and lower
-1 -0.5 0 0.5 1
outcome
60-70%
-1 -0.5 0 0.5 1
outcome
80% and higher
-1 -0.5 0 0.5 1
outcome
accuracy
(a)
(b)
(c)
(d)
R117.4 Genome Biology 2006, Volume 7, Issue 12, Article R117 Roepman et al. />Genome Biology 2006, 7:R117
tion is likely caused by tumor or stroma cell specific gene
expression, we decided to divide the signature genes into dif-
ferent categories and determine how the different compo-
nents of the signature influenced the predictive outcome in a
tumor percentage dependent manner.
Metastasis is characterized by primary tumor gene
expression loss and stromal cell activation
The first criterion for subdividing the metastasis associated
genes was based on whether genes are expressed predomi-
nantly in stroma, in tumor cells or in both (Figure 3c). This
subdivision into three subsets of genes is based on correlation
of gene expression with the different tumor percentages in the
entire set of 35 artificial samples, with genes ordered from left
to right as stroma expressed and tumor expressed, respec-
tively. To verify this subdivision, 100% tumor cell LCM sam-
ples were compared to 100% stroma LCM samples directly on
12 additional microarrays (dye-swap replicate for each of 6
samples for which there was still sufficient LCM material).
The ratios of this direct comparison are depicted in green
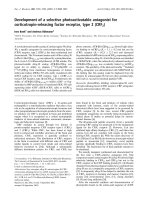
Isolation of tumor cells and tumor stroma from complete primary tumor sectionsFigure 2
Isolation of tumor cells and tumor stroma from complete primary tumor sections. LCM microdissection was used to isolate tumor and stromal areas to
generate artificial samples from complete primary tumor sections. (a,d,g) From primary tumor sections, areas comprising mainly (b) tumor cells or (e)
tumor stroma, or (h) random circles were isolated using LCM. Samples with different tumor percentages were made by combining multiple tumor cell
areas (b) and multiple tumor stroma areas (e) at varying ratios. Artificial samples for which the original tumor-stroma proportion was retained were made
by isolation of multiple circled areas randomly distributed across the tumor section (h). See Materials and methods for more details. (c,f,i) Primary tumor
sections after LCM of desired areas. The tissue sections shown here were colored using hematoxylin-eosin staining.
(a) (b)
(c)
(d) (e) (f)
(g) (h) (i)
Genome Biology 2006, Volume 7, Issue 12, Article R117 Roepman et al. R117.5
comment reviews reports refereed researchdeposited research interactions information
Genome Biology 2006, 7:R117
(stroma expressed) and red (tumor expressed) in Figure 3c
and confirm the subdivision based on correlation with all the
different tumor percentages. Interestingly, the results show
that 12% of genes in the predictive signature are predomi-
nantly stroma expressed, 25% are more tumor cell specific,
with the bulk equally expressed in tumor and stroma.
These three groups were then further subdivided into two cat-
egories each, based on whether up-regulation is associated
with the presence or absence of metastasis (Figure 3d). Two
striking observations become apparent upon subdividing the
signature genes in this way. The first is the skewed distribu-
tion of genes over the six different categories. While there are
a significant number of stroma expressed genes for which up-
regulation is associated with the presence of metastasis, there
are virtually no stroma expressed genes for which up-regula-
tion is associated with the absence of metastasis (Figure 3d,
left-hand side). In other words, the presence of metastasis is
associated with up-regulation of a specific set of stroma
expressed genes, but not with inactivation of stroma specific
genes in the primary tumor. For the tumor cell expressed
genes within the signature, an oppositely skewed distribution
is also evident, although to a somewhat lower degree (Figure
3d, right-hand side). There are a significant number of tumor
cell expressed genes for which increased expression is associ-
ated with the absence of a metastasis, but a much lower
number of tumor cell expressed genes for which upregulation
is associated with presence of metastasis. For HNSCCs in the
oral cavity or oropharynx, the metastasizing primary tumor
is, therefore, characterized by upregulation of stroma specific
genes and inactivation of tumor cell specific genes. The 685
metastasis associated genes and their distribution over the
different signature components are presented in Additional
data file 1.
Besides providing important insights into the metastatic
process itself, this skewed distribution may account for the
predisposition of signature genes to falsely predict the
presence of a metastasis for samples with reduced tumor per-
centage (Figure 3b). Because metastasis is associated with
increased expression of a subset of stroma specific genes, with
little to no down-regulation of stroma specific genes, an
increased proportion of stroma in whole tumor sections will
result in a bias towards an N+ prediction, even for primary
tumors that are in fact N0. The other skew in the distribution,
more down- than up-regulation of tumor cell specific genes in
an N+ tumor, works in the same way and adds to the predis-
position towards an N+ prediction in low tumor cell percent-
age samples. To test the idea that the skewed distribution
underlies the bias towards predicting an N+ phenotype in
samples with reduced tumor cell percentage, N0/N+ predic-
tions were repeated on the 35 artificially composed LCM sam-
ples, using only those signature genes specifically expressed
in either tumor cells or stroma. As expected, this signature is
even more skewed towards predicting the N+ phenotype than
the complete set of signature genes (Figure 3e versus Figure
3b).
Skewed distribution of metastasis associated genes
across distinct signature components
A second important observation that is apparent upon subdi-
viding the signature genes into different categories can be
made for genes that are expressed in both stroma and tumor
(Figure 3d, middle group). Using only signature genes that
are equivalently expressed in both stroma and tumor cells
would be an ideal way in which to circumvent tumor cell per-
centage biases in signatures. Whereas hardly any skewed N0/
N+ distribution is seen for this group, the predictive power to
discriminate between N0 and N+ tumors is markedly reduced
compared to the tumor cell and stroma specific genes. This is
apparent from the lower degree of association with either an
N+ or an N0 phenotype (Figure 3d). Because of their weaker
association with either an N0 or N+ phenotype, a signature
based exclusively on genes expressed in both tumor cells and
stroma has insufficient predictive power to strongly discrimi-
nate between N0 and N+ primary tumors, either for the arti-
ficially generated samples (Figure 3f), or as tested on the
entire original set of 66 primary tumor samples used to gen-
erate Figure 1 (overall accuracy is reduced from 86% to 76%).
Based on the results described above, the previously identi-
fied predictive HNSCC signature can be separated into one
part that contains genes that are equally expressed between
tumor and stroma but with limited predictive power, and a
second part with tumor and stromal specific genes that have
strong discriminatory power but a skewed N0/N+ distribu-
tion. A model for this composition and the ensuing bias in
predictions shows the presence of four unequally distributed
components (Figure 4a), alongside the actual distribution of
such stroma and tumor cell specific genes (Figure 4b). The
two large components contain N0 associated tumor genes
(tumor N0) and N+ associated stromal genes (stroma N+).
The two smaller components contain some tumor N+ genes
and hardly any stroma N0 genes (Figure 4b). As is depicted
(Figure 4a,b), the skewed sizes of these four components
result in a signature that is unstable in its predictive outcome
with regard to different tumor percentages (Figure 3e). If this
model is accurate, adjustments to correct for
overrepresentation should result in a predictive signature
with reduced bias for different tumor percentages, as is indi-
cated in the model shown in Figure 4c. Accordingly, from the
initial comprehensive set of metastasis associated genes, a set
of 119 predictive genes were selected that showed the greatest
balance for the different signature components (Figure 4d;
Additional data file 1). As expected, if these models are cor-
rect, the balanced HNSCC metastasis signature indeed shows
a great reduction in tumor cell percentage bias for its predic-
tive outcome when tested on the artificially composed LCM
samples (Figure 4e). Using the balanced signature, the artifi-
cial tumor samples with a tumor percentage ranging from
25% to 100% now show a predictive outcome largely inde-
R117.6 Genome Biology 2006, Volume 7, Issue 12, Article R117 Roepman et al. />Genome Biology 2006, 7:R117
pendent of tumor percentage and a strong reduction in the
N+ predisposition for N0 samples containing no tumor cells
(Figure 4e).
Balanced signature performs better on low tumor cell
percentage samples
To test whether predictive bias correction using a balanced
signature does not exclusively work on the LCM composed
samples, the performance of the balanced signature was
determined on the set of 77 complete primary tumor sections
(Figure 1), including the additional samples with less than
50% tumor cells. Here too, the balanced HNSCC metastasis
signature outperforms the original signatures [34], especially
for samples with a lower degree of tumor cells (Figure 4f). An
odds ratio expresses the chance that the performance is based
on random occurrence. The odds ratio for overall predictive
accuracy for the less than 50% tumor cell samples rose from
6.5 (p = 0.07) to 12 (p = 0.02) upon application of the bal-
anced signature. The improvement is incremental but signif-
icant for patients wishing to benefit from future diagnostic
signatures, especially because this indicates that a larger
group of samples can be included in signature profiling by
taking into account the possibility of skewed distributions of
signature genes. Another possible approach for adjusting the
signature is weighting the predictive correlations of individ-
ual signature components based on tumor cell percentage in
the sample. This mathematical correction results in a similar
improvement in predictive accuracy (Figure 4f). Alternative
methods for taking skewed signature compositions into
account in future studies are discussed below.
Discussion
In this study we have investigated the effects of tumor compo-
sition on the performance of a predictive signature, dissected
the signature into different components and show that loss of
predictive accuracy on low tumor cell percentage samples is,
in part, caused by a skewed distribution of signature genes
within these different components. The results have implica-
tions for our understanding of how metastases arise, for
treatment of metastases and suggest several ways in which
expression signatures can be improved.
Stroma and tumor cell interactions
Functional category analyses of classifiers has previously
indicated the presence of both tumor cell specific and stromal
expressed genes in metastasis associated signatures
[9,25,34]. By directly comparing LCM stroma fields with
tumor fields we show that, for an exhaustive collection of 685
HNSCC lymph node metastasis associated genes, 12% are
predominantly expressed in stroma, 25% in tumor cells and
the majority in both tumor and stroma. This agrees with
recent discoveries highlighting the contribution of the sur-
rounding microenvironment towards cancer development
[35-37] and the interplay between tumor and stromal cells
that leads to metastasis [22,24,38].
A striking finding is the skewed distribution of stromal and
tumor cell expressed genes with regard to their association
with the presence or absence of metastasis (Figure 3d). Com-
pared to the primary tumors that show no metastasis, the
metastasizing primary head-neck tumor is characterized by
exclusive up-regulation of a subset of stroma specific genes,
concomitant with predominant inactivation of a subset of
tumor specific genes. This is in agreement with the idea that
tissue surrounding tumor cells is actively transformed into a
metastasis supportive microenvironment [20,22,24]. The
fact that metastasis is more strongly associated with down-
regulation of tumor cell specific genes than their activation
suggests that, in tumor cells, loss-of-function plays a more
dominant role in acquiring a metastatic phenotype than gain
of function. Future analyses may indicate whether any of the
tumor cell metastasis associated genes are causal for the con-
comitant changes observed in stroma expression. Dissection
of the large set of 685 metastasis associated genes [34] into
much smaller groups of strongly metastasis associated genes
with defined expression should simplify the task of finding
suitable therapeutic targets for treatment of metastasis.
The HNSCC metastasis signature outcome shows tumor cell percentage bias due to skewed distribution of signature componentsFigure 3 (see following page)
The HNSCC metastasis signature outcome shows tumor cell percentage bias due to skewed distribution of signature components. (a) Metastatic
signature profiles of seven analyzed primary HNSCCs based on: complete tumor sections and the originally identified 102-signature genes [25] (original);
complete sections and the set of 685 metastasis associated predictive genes (complete); and the 685-gene set and synthetic samples in which the original
tumor-stroma proportion was retained (lcm). Blue indicates a non-metastatic (N0) profile, and yellow indicates a metastatic (N+) profile. (b) Metastatic
signature profiles of synthetic samples from 7 primary tumors that retained the original tumor percentage (lcm) or contained 0%, 25%, 50%, 75% or 100%
tumor cells, respectively. Profiles are based on the predictive 685 gene set; colors are as in (a). (c) The set of 685 predictive genes are ordered according
to the correlation of their expression level with the 35 analyzed tumor percentages. Colors are based on a direct microarray comparison of tumor cells
and tumor stroma, which confirms that negatively correlated (<-0.50) genes are mainly expressed in the stroma and positively correlated gene (>0.50) are
tumor cell associated. Green indicates higher expression in tumor stroma compared to tumor cells and red indicates higher expression in tumor cells than
in tumor stroma. Which of the 685 signature genes are distributed over which different components is described in detail in Additional data file 1. (d)
Tumor percentage correlation and signature association (N0 or N+) of the predictive genes. Tumor percentage correlative groups as shown in (c). Blue
indicates genes that are associated with the N0 signature profile, and yellow those associated with an N+ profile. Stromal genes are mostly N+ associated,
that is, with higher expression in N+ primary tumor sections, while N0 profile related predictive genes are more commonly expressed in tumor cells, that
is, down-regulated in N+ primary tumors. (e) As (b), but for the tumor and stromal specific predictive genes (259 genes). (f) As (b), but for the non-
specific predictive genes that are similarly expressed between tumor cells and tumor stroma (tumor percentage correlation between -0.50 and 0.50).
Genome Biology 2006, Volume 7, Issue 12, Article R117 Roepman et al. R117.7
comment reviews reports refereed researchdeposited research interactions information
Genome Biology 2006, 7:R117
Figure 3 (see legend on previous page)
685-set
tumor or stroma
specific genes (259)
non-specific
genes (426)
(a)
(b)
(c)
(d)
(e) (f)
11 9
A4
136
A9
20
A16
A6
11 9
A4
136
A9
20
A16
A6
complete
original
lcm
685-set
N0 N+
predictive outcome
lcm
0
25
50
75
100
11 9
A4
136
A9
20
A16
A6
lcm
0
25
50
75
100
11 9
A4
136
A9
20
A16
A6
lcm
0
25
50
75
100
stromal
genes (85)
tumor
genes (174)
stroma
tumorboth
11 9
A4
A9
20
A16
A6
samples
samples
N0
N+
signature association
tumor-% corr
0.5
0.5
-0.5
-0.5
0
%
%%
R117.8 Genome Biology 2006, Volume 7, Issue 12, Article R117 Roepman et al. />Genome Biology 2006, 7:R117
Figure 4 (see legend on next page)
low
high
original signature
tumor N0
tumor N+
stroma N0
stroma N+
N+
N0
tumor-%
(a)
corrected signature
tumor N0
stroma N0
tumor N+
stroma N+
low
high
N+
N0
tumor-%
(c)
(e)
N0 N+
predictive outcome
balanced tumor-stroma
gene set (119)
lcm
0
25
50
75
100
11 9
A4
136
A9
20
A16
A6
signature odds ratio
original
all samples
balanced
mathematical
selection
tumor-% 50
_
<
20 31
126.5
p=2e-6
p=0.07 p=0.02
p=5e-7
(f)
33
12
p=0.02
p=9e-8
stroma
original signature
(b)
N+
N0
tumor
balanced signature
(d)
stroma
N+
N0
tumor
%
Genome Biology 2006, Volume 7, Issue 12, Article R117 Roepman et al. R117.9
comment reviews reports refereed researchdeposited research interactions information
Genome Biology 2006, 7:R117
Two-thirds of the genes comprising the HNSCC metastatic
signature have similar expression in tumor cells and stroma.
On their own, these only marginally discriminate between N0
and N+ tumors, presumably due to lower differences in
expression for these genes between the two tumor types.
Because these genes are expressed in both stroma and tumor
cells and exhibit less discriminatory power, such genes may
be an indirect mark of genetic polymorphisms associated with
the metastatic phenotype, rather than directly causal for
metastasis. This idea is in line with indications that a metas-
tasis expression signature is a product of genetic polymor-
phisms rather than changes caused during tumorigenesis
[39]. Another interesting feature of the signature genes is the
absence of highly specific, individual gene expression capable
of discriminating between N0 and N+ tumor or stroma. This
agrees with the difficulties in finding highly specific metasta-
sis markers for primary tumors and the fact that successful
signatures require contributions of large numbers of genes
for accurate prediction. This also indicates that the metastatic
phenotype is caused by relatively minor changes in expres-
sion of a large number of genes.
Expression signature design
The skewed distribution of metastasis signature genes over
the different components (Figure 3) has important implica-
tions for design of expression signatures. Samples consisting
of lower than 50% tumor are generally excluded from profil-
ing studies. This is an important but not well-documented
issue. For example, approximately 30% of tumors in our cur-
rent collection of head-neck tumor samples do not fulfill this
criterion (P Roepman, unpublished results). Such samples
have been excluded from many successful profiling studies
and cannot be included in future implementation of diagnos-
tic profiling unless approaches are devised to allow inclusion
based on accurate predictions. Even a marginal decrease in
tumor content to 40% or 25% for inclusion in future studies is
a significant step forward for the patients involved.
Here we confirm that the metastatic status of samples with a
lower proportion of tumor cells are indeed less accurately
predicted (Figure 1) and demonstrate that, at least in part,
this is due to the skewed distribution of metastasis associated
genes over several different signature components (Figure 3).
Because the most strongly metastasis associated genes are
stromal genes that become up-regulated and tumor cell genes
that are down-regulated (Figure 3d), the presence of a higher
amount of stromal material will a priori predispose a
metastatic signature to make an N+ prediction. The loss of
discriminatory power observed on whole tumor sections is
not always skewed towards making false N+ predictions for
lower tumor percentage samples (Figure 1b), suggesting that
other factors, such as sample heterogeneity, also play a role.
Due to the large number of samples required to counter het-
erogeneity, it is, at present, not possible to determine une-
quivocally whether all the loss in predictive accuracy
observed for lower tumor cell percentage samples (Figure 1a)
can be attributed to the skewed distribution of signature
genes. Nevertheless, the improved outcome on artificial LCM
generated samples (Figure 4e) and complete tumor sections
(Figure 4f) indicates that, if steps are taken to analyze signa-
ture compositions and correct for skewed distributions over
the different components, then a larger number of patients
will in future benefit from diagnostic signatures.
In this study, we present three methods for improved predic-
tion of lower tumor percentage samples. The first method
involves selection of signature genes expressed similarly in
both tumor cells and stroma. The weaker discriminatory
power of such genes is perhaps related to having no specific
role in either tumor or stroma. When used on their own, the
signature lacks sufficient discriminatory power, even when all
426 such genes are used together (Figure 3f). The two other
approaches do include the skewed signature components, but
compensate the resulting bias by selecting either a balanced
number of genes (Figure 4d), or by tumor cell percentage
weighted correction of individual component predictions.
Both improve predictive accuracy for low tumor cell percent-
age samples, without loss of overall accuracy. Analysis of sig-
nificantly more low-tumor-percentage samples is required to
ascertain whether these are indeed the best approaches. Such
a study could also investigate the possibility of designing two
different independent signatures: one 'stromal-related' signa-
ture based on low tumor percentage samples and one 'tumor-
related' signature based on high tumor percentage samples.
Via this approach, a biological characteristic, that is, the
interplay between tumor and stromal cells, will be divided
Balancing the tumor and stromal HNSCC signature components results in a more robust and accurate predictive profileFigure 4 (see previous page)
Balancing the tumor and stromal HNSCC signature components results in a more robust and accurate predictive profile. (a) Tumor cell specific and
tumor stroma specific HNSCC signature genes can be dissected into four compartments: stroma N+, tumor N+, stroma N0 and tumor N0. Light grey
indicates N0 association, and dark grey indicates N+ association. (b) Model for the relative contribution of the four components shown in (a) to the initial
HNSCC signature. Combining the four components into one predictive outcome (indicated by arrows) results in tumor percentage signature bias. Low
tumor percentage samples (left-hand side) show a more N+ biased profile (dark grey), whereas samples with a very high tumor percentage (right-hand
side) exhibit a bias towards an N0 profile (light grey). (c) As (b), but for a corrected signature composition that does not exhibit a strong bias in the
predictive outcome of low and high tumor percentage samples. (d) Selection of a set of 119 HNSCC signature genes that are equally distributed across
the four different components, plotted similarly as in (a). (e) Predictive outcomes based on the corrected signature that consists of the 119 genes shown
in (d). The corrected signature shows a strong reduction in predictive bias for samples with a low or very high tumor percentage; colors are as in Figure
3b. (f) Odds ratios for the signature outcome for prediction of metastasis based on the original signature, the balanced signature and through weighted
correction based on the tumor cell percentage of samples.
R117.10 Genome Biology 2006, Volume 7, Issue 12, Article R117 Roepman et al. />Genome Biology 2006, 7:R117
into two separate signatures. Moreover, due to splitting the
sample set into two, at least twice as many samples will be
needed to achieve similar statistical significance. Insufficient
numbers of such samples in our collection renders it as yet
impossible to conclude whether this approach is feasible.
Regardless of the issue of current sample availability, the
importance of the present study is that it successfully dissects
a clinically relevant diagnostic signature into separate com-
ponents, and shows that skewed distribution of signature
genes over the different components contributes to lower pre-
dictive accuracy for low tumor percentage samples. It will be
important to determine whether other signatures have simi-
lar properties and future studies can now take the possibility
of skewed distributions of signature genes into account, lead-
ing to inclusion of more samples and increasing the number
of patients to which diagnostic signatures can be applied.
Conclusion
Expression signatures that are derived from samples contain-
ing multiple tissue types can be dissected into multiple com-
ponents. For a 685 gene signature associated with lymph
node metastasis in HNSCC, there is a strikingly skewed
distribution of the genes over the six different components of
the signature. The metastasizing primary tumor is character-
ized by down-regulation of tumor cell specific genes and up-
regulation of stromal genes. Dissection of the 685 metastasis
associated genes in this way enables assessment of which
gene products are better suited for targeted therapy. The
skewed distribution of signature genes over the various com-
ponents explains loss of predictive accuracy for samples con-
taining lower amounts of tumor cells. The loss of predictive
accuracy can, in part, be resolved by selecting genes that
together form a signature with a balanced composition over
the different components. This will allow more samples with
lower amounts of tumor cells to be included in future
analyses.
Materials and methods
Tumor samples
Previously determined gene expression data of 66 primary
HNSCC tumor samples were used in this study [25]. In addi-
tion, 11 extra tumor samples were analyzed for their gene
expression profile. Selection criteria for this additional set of
samples were identical to the previous set of 66, except that
complete tumor sections of these 11 samples showed a tumor
content of less than 50%. RNA processing, microarray
hybridization and analysis of the 11 samples was performed as
previously described [25].
Artificial tumor percentage samples
For 7 primary tumors (3 N0, 4 N+) selected from the previ-
ously analyzed set of 66 samples, 5 artificial samples were
generated with 0%, 25%, 50%, 75% or 100% tumor cells and
one artificial sample in which the original tumor percentage
was retained. The artificial tumor percentage samples were
generated by LCM of a tumor tissue section thus isolating 1
mm
2
tumor tissue in total. The artificial samples that differed
in tumor percentage were made by combining multiple iso-
lated tumor cell areas (Figure 2b) and multiple isolated tumor
stroma fields (Figure 2e) in different ratios, for example, a
75% sample was generated by LCM of 0.75 mm
2
tumor cells
and 0.25 mm
2
tumor stroma. The artificial samples in which
the original composition was retained were generated by iso-
lation of random circled areas from the complete tumor sec-
tion (Figure 2h).
LCM and RNA isolation
Frozen tumor sections (10 μm) were fixated on PALM Mem-
braneSlides (PALM MicroLaser Systems, Bernried, Ger-
many) and colored with hematoxylin for 30 seconds. LCM
was performed using the PALM MicroBeam System. Total
RNA from captured microdissected cells was isolated using
the PicoPure™ RNA Isolation Kit (Arcturus, Sunnyvale, CA,
USA). RNA quality was checked on the 2100 Bioanalyzer
(Agilent, Santa Clara, CA, USA).
RNA amplification and fluorescent labeling
RNA isolated from LCM samples was amplified using two
rounds of T7 linear amplification. The first round was per-
formed as described elsewhere [25] except that T7 in vitro
transcription (IVT) was performed for two instead of four
hours and without incorporation of aminoallyl-UTP. The first
round cRNA was used as a template for a second round of
amplification. Samples were vacuum concentrated to 9 μl and
1 μl random primers (1 μg/μl; Invitrogen, Paisley, Scotland)
was added. Subsequently, first strand cDNA synthesis was
performed as previously described [25] followed by incuba-
tion at 94°C for 5 minutes. After cooling the samples on ice, 1
μl of the previously used double anchored T7-poly(dT) primer
was added [25] and the samples were incubated for 5 minutes
at 70°C and subsequently for 3 minutes at 48°C. Second
strand cDNA synthesis, second round IVT and cRNA cleanup
were preformed as described elsewhere [25]. During the sec-
ond amplification round, aminoallyl-UTP was incorporated
into the generated cRNA, enabling direct coupling of fluo-
phores before hybridization. Direct coupling of cy5 or cy3
fluophores was done as described previously [25]. Yield, qual-
ity and label incorporation were quantified spectrophotomet-
rically and on the 2100 Bioanalyzer (Agilent).
Gene expression analysis
Gene expression patterns were determined using 70-mer oli-
gonucleotide DNA microarrays containing over 21,000
human gene features [25]. Before hybridization, the micro-
array slides were incubated in borohydrate buffer (2× SSC
(0.3 M NaCl, 50 mM sodium citrate), 0.05% SDS and 0.25%
w/v sodium borohydrate (Sigma-Aldrich, St. Louis, MO,
USA) for 30 minutes at 42°C. We combined 300 ng of cy5 or
cy3 labeled sample target (with a labeled nucleotide incorpo-
ration of 3% to 5%) with 300 ng reverse labeled reference
Genome Biology 2006, Volume 7, Issue 12, Article R117 Roepman et al. R117.11
comment reviews reports refereed researchdeposited research interactions information
Genome Biology 2006, 7:R117
cRNA [25], which was then fragmented using Ambion's Frag-
mentation kit (Ambion, Austin, TX, USA). Microarray
hybridization was performed as described elsewhere [40].
The slides were scanned in the Agilent G2565AA DNA Micro-
array Scanner. Images were quantified and corrected for
background using Imagene software (Biodiscovery, El Seg-
undo, CA, USA). Quantified expression data were normalized
as described previously [25]. Microarray layout, expression
data and protocols have been deposited in compliance with
MIAME in the ArrayExpress database, with accession num-
bers A-UMCU-3 and E-TABM-152.
Metastasis signature outcome
The metastasis predictive signature outcome of each analyzed
HNSCC sample was determined by calculating the correlation
of its specific gene expression pattern with the previously
determined typical metastatic (N+) and non-metastatic (N0)
profiles, as described previously [25]. Combined, the N+ and
N0 profile correlations denoted a single predictive signature
outcome for each analyzed sample for a specific set of predic-
tive genes. Positive correlation indicated an N+ profile, nega-
tive correlation an N0 profile. From the previously identified
comprehensive set of 825 predictive genes [34], 685 genes
that showed a robust profile when including the LCM and
double amplification procedures were analyzed here. The
removed 140 genes showed a bias in expression measurement
due to the introduction of the LCM and double amplification
procedures and gave a 1.5-fold difference in expression for at
least 3 of the 7 analyzed tumor samples due to the changed
technical procedures. The remaining 685 genes showed no or
only marginal change in expression in 1 or 2 of the 7 analyzed
tumor samples.
Additional data files
The following additional data are available with the online
version of this paper. Additional data file 1 is a table listing the
685 metastasis associated genes and their distribution over
the different signature components.
Additional file data 1The 685 metastasis associated genes and their distribution over the different signature componentsThe 685 metastasis associated genes and their distribution over the different signature componentsClick here for file
Acknowledgements
We thank M Groot Koerkamp and D Bouwmeester for microarray pro-
duction and A Leijen and Y El Hankouri for computer assistance. This work
was funded by the Netherlands Centre for Biomedical Genetics and the
Netherlands Organization for Scientific Research (NOW) grant 901-01-
238.
References
1. Huang E, Ishida S, Pittman J, Dressman H, Bild A, Kloos M, D'Amico
M, Pestell RG, West M, Nevins JR: Gene expression phenotypic
models that predict the activity of oncogenic pathways. Nat
Genet 2003, 34:226-230.
2. Segal E, Friedman N, Kaminski N, Regev A, Koller D: From signa-
tures to models: understanding cancer using microarrays.
Nat Genet 2005, 37:S38-45.
3. Bild AH, Yao G, Chang JT, Wang Q, Potti A, Chasse D, Joshi MB, Har-
pole D, Lancaster JM, Berchuck A, et al.: Oncogenic pathway sig-
natures in human cancers as a guide to targeted therapies.
Nature 2006, 439:353-357.
4. Valk PJ, Verhaak RG, Beijen MA, Erpelinck CA, Barjesteh van Waalw-
ijk van Doorn-Khosrovani S, Boer JM, Beverloo HB, Moorhouse MJ,
van der Spek PJ, Lowenberg B, Delwel R: Prognostically useful
gene-expression profiles in acute myeloid leukemia. N Engl J
Med 2004, 350:1617-1628.
5. Perou CM, Sorlie T, Eisen MB, van de Rijn M, Jeffrey SS, Rees CA, Pol-
lack JR, Ross DT, Johnsen H, Akslen LA, et al.: Molecular portraits
of human breast tumours. Nature 2000, 406:747-752.
6. Golub TR, Slonim DK, Tamayo P, Huard C, Gaasenbeek M, Mesirov
JP, Coller H, Loh ML, Downing JR, Caligiuri MA, et al.: Molecular
classification of cancer: class discovery and class prediction
by gene expression monitoring. Science 1999, 286:531-537.
7. Alizadeh AA, Eisen MB, Davis RE, Ma C, Lossos IS, Rosenwald A,
Boldrick JC, Sabet H, Tran T, Yu X, et al.: Distinct types of diffuse
large B-cell lymphoma identified by gene expression
profiling. Nature 2000, 403:503-511.
8. Ma XJ, Wang Z, Ryan PD, Isakoff SJ, Barmettler A, Fuller A, Muir B,
Mohapatra G, Salunga R, Tuggle JT, et al.: A two-gene expression
ratio predicts clinical outcome in breast cancer patients
treated with tamoxifen. Cancer Cell 2004, 5:607-616.
9. Ramaswamy S, Ross KN, Lander ES, Golub TR: A molecular signa-
ture of metastasis in primary solid tumors. Nat Genet 2003,
33:
49-54.
10. Wang Y, Klijn JG, Zhang Y, Sieuwerts AM, Look MP, Yang F, Talantov
D, Timmermans M, Meijer-van Gelder ME, Yu J, et al.: Gene-expres-
sion profiles to predict distant metastasis of lymph-node-
negative primary breast cancer. Lancet 2005, 365:671-679.
11. Paik S, Shak S, Tang G, Kim C, Baker J, Cronin M, Baehner FL, Walker
MG, Watson D, Park T, et al.: A multigene assay to predict
recurrence of tamoxifen-treated, node-negative breast
cancer. N Engl J Med 2004, 351:2817-2826.
12. Huang E, Cheng SH, Dressman H, Pittman J, Tsou MH, Horng CF, Bild
A, Iversen ES, Liao M, Chen CM, et al.: Gene expression predic-
tors of breast cancer outcomes. Lancet 2003, 361:1590-1596.
13. van 't Veer LJ, Dai H, van de Vijver MJ, He YD, Hart AA, Mao M,
Peterse HL, van der Kooy K, Marton MJ, Witteveen AT, et al.: Gene
expression profiling predicts clinical outcome of breast
cancer. Nature 2002, 415:530-536.
14. Tinker AV, Boussioutas A, Bowtell DD: The challenges of gene
expression microarrays for the study of human cancer. Can-
cer Cell 2006, 9:333-339.
15. Simon R, Radmacher MD, Dobbin K, McShane LM: Pitfalls in the
use of DNA microarray data for diagnostic and prognostic
classification. J Natl Cancer Inst 2003, 95:14-18.
16. Ransohoff DF: Rules of evidence for cancer molecular-marker
discovery and validation. Nat Rev Cancer 2004, 4:309-314.
17. Kallioniemi O: Medicine: profile of a tumour. Nature 2004,
428:379-382.
18. Alevizos I, Mahadevappa M, Zhang X, Ohyama H, Kohno Y, Posner M,
Gallagher GT, Varvares M, Cohen D, Kim D, et al.: Oral cancer in
vivo gene expression profiling assisted by laser capture
microdissection and microarray analysis.
Oncogene 2001,
20:6196-6204.
19. Yamabuki T, Daigo Y, Kato T, Hayama S, Tsunoda T, Miyamoto M, Ito
T, Fujita M, Hosokawa M, Kondo S, Nakamura Y: Genome-wide
gene expression profile analysis of esophageal squamous cell
carcinomas. Int J Oncol 2006, 28:1375-1384.
20. Bissell MJ, Radisky D: Putting tumours in context. Nat Rev Cancer
2001, 1:46-54.
21. Forastiere A, Koch W, Trotti A, Sidransky D: Head and neck
cancer. N Engl J Med 2001, 345:1890-1900.
22. Mueller MM, Fusenig NE: Friends or foes - bipolar effects of the
tumour stroma in cancer. Nat Rev Cancer 2004, 4:839-849.
23. Hanahan D, Weinberg RA: The hallmarks of cancer. Cell 2000,
100:57-70.
24. Liotta LA, Kohn EC: The microenvironment of the tumour-
host interface. Nature 2001, 411:375-379.
25. Roepman P, Wessels LF, Kettelarij N, Kemmeren P, Miles AJ, Lijnzaad
P, Tilanus MG, Koole R, Hordijk GJ, van der Vliet PC, et al.: An
expression profile for diagnosis of lymph node metastases
from primary head and neck squamous cell carcinomas. Nat
Genet 2005, 37:182-186.
26. Reid BC, Winn DM, Morse DE, Pendrys DG: Head and neck in situ
carcinoma: incidence, trends, and survival. Oral Oncol 2000,
36:414-420.
27. Bray F, Moller B: Predicting the future burden of cancer. Nat
Rev Cancer 2006, 6:63-74.
R117.12 Genome Biology 2006, Volume 7, Issue 12, Article R117 Roepman et al. />Genome Biology 2006, 7:R117
28. Robbins KT, Clayman G, Levine PA, Medina J, Sessions R, Shaha A,
Som P, Wolf GT: Neck dissection classification update: revi-
sions proposed by the American Head and Neck Society and
the American Academy of Otolaryngology-Head and Neck
Surgery. Arch Otolaryngol Head Neck Surg 2002, 128:751-758.
29. Jones AS, Phillips DE, Helliwell TR, Roland NJ: Occult node metas-
tases in head and neck squamous carcinoma. Eur Arch
Otorhinolaryngol 1993, 250:446-449.
30. Woolgar JA: Pathology of the N0 neck. Br J Oral Maxillofac Surg
1999, 37:205-209.
31. Schmalbach CE, Chepeha DB, Giordano TJ, Rubin MA, Teknos TN,
Bradford CR, Wolf GT, Kuick R, Misek DE, Trask DK, Hanash S:
Molecular profiling and the identification of genes associated
with metastatic oral cavity/pharynx squamous cell
carcinoma. Arch Otolaryngol Head Neck Surg 2004, 130:295-302.
32. Cromer A, Carles A, Millon R, Ganguli G, Chalmel F, Lemaire F,
Young J, Dembele D, Thibault C, Muller D, et al.: Identification of
genes associated with tumorigenesis and metastatic poten-
tial of hypopharyngeal cancer by microarray analysis. Onco-
gene 2004, 23:2484-98.
33. Chung CH, Parker JS, Karaca G, Wu J, Funkhouser WK, Moore D,
Butterfoss D, Xiang D, Zanation A, Yin X, et al.: Molecular classifi-
cation of head and neck squamous cell carcinomas using pat-
terns of gene expression. Cancer Cell 2004, 5:489-500.
34. Roepman P, Kemmeren P, Wessels LF, Slootweg PJ, Holstege FC:
Multiple robust signatures for detecting lymph node metas-
tasis in head and neck cancer. Cancer Res 2006, 66:2361-2366.
35. Kalluri R, Zeisberg M: Fibroblasts in cancer. Nat Rev Cancer 2006,
6:392-401.
36. Pollard JW: Tumour-educated macrophages promote tumour
progression and metastasis. Nat Rev Cancer 2004, 4:71-78.
37. Balkwill F: Cancer and the chemokine network. Nat Rev Cancer
2004,
4:540-550.
38. Joyce JA: Therapeutic targeting of the tumor
microenvironment. Cancer Cell 2005, 7:513-520.
39. Hunter K, Welch DR, Liu ET: Genetic background is an impor-
tant determinant of metastatic potential. Nat Genet 2003,
34:23-24. author reply 25
40. van de Peppel J, Kemmeren P, van Bakel H, Radonjic M, van Leenen
D, Holstege FC: Monitoring global messenger RNA changes in
externally controlled microarray experiments. EMBO Rep
2003, 4:387-393.