Báo cáo y học: "Gene function and expression level influence the insertion/fixation dynamics of distinct transposon families in mammalian introns" doc
Bạn đang xem bản rút gọn của tài liệu. Xem và tải ngay bản đầy đủ của tài liệu tại đây (685.62 KB, 15 trang )
Genome Biology 2006, 7:R120
comment reviews reports deposited research refereed research interactions information
Open Access
2006Sironiet al.Volume 7, Issue 12, Article R120
Research
Gene function and expression level influence the insertion/fixation
dynamics of distinct transposon families in mammalian introns
Manuela Sironi
*
, Giorgia Menozzi
*
, Giacomo P Comi
†
, Matteo Cereda
*
,
Rachele Cagliani
*
, Nereo Bresolin
*†
and Uberto Pozzoli
*
Addresses:
*
Scientific Institute IRCCS E Medea, Bioinformatic Lab, Via don L Monza, 23842 Bosisio Parini (LC), Italy.
†
Dino Ferrari Centre,
Department of Neurological Sciences, University of Milan, IRCCS Ospedale Maggiore Policlinico, Mangiagalli and Regina Elena Foundation,
20100 Milan, Italy.
Correspondence: Uberto Pozzoli. Email:
© 2006 Sironi et al.; licensee BioMed Central Ltd.
This is an open access article distributed under the terms of the Creative Commons Attribution License ( which
permits unrestricted use, distribution, and reproduction in any medium, provided the original work is properly cited.
Dynamics of mammalian transposable elements<p>An analysis of humans and mouse genomes indicates that gene function, expression level, and sequence conservation influence trans-posable elements insertion/fixation in mammalian introns.</p>
Abstract
Background: Transposable elements (TEs) represent more than 45% of the human and mouse
genomes. Both parasitic and mutualistic features have been shown to apply to the host-TE
relationship but a comprehensive scenario of the forces driving TE fixation within mammalian genes
is still missing.
Results: We show that intronic multispecies conserved sequences (MCSs) have been affecting TE
integration frequency over time. We verify that a selective economizing pressure has been acting
on TEs to decrease their frequency in highly expressed genes. After correcting for GC content,
MCS density and intron size, we identified TE-enriched and TE-depleted gene categories. In
addition to developmental regulators and transcription factors, TE-depleted regions encompass
loci that might require subtle regulation of transcript levels or precise activation timing, such as
growth factors, cytokines, hormones, and genes involved in the immune response. The latter,
despite having reduced frequencies of most TE types, are significantly enriched in mammalian-wide
interspersed repeats (MIRs). Analysis of orthologous genes indicated that MIR over-representation
also occurs in dog and opossum immune response genes, suggesting, given the partially independent
origin of MIR sequences in eutheria and metatheria, the evolutionary conservation of a specific
function for MIRs located in these loci. Consistently, the core MIR sequence is over-represented
in defense response genes compared to the background intronic frequency.
Conclusion: Our data indicate that gene function, expression level, and sequence conservation
influence TE insertion/fixation in mammalian introns. Moreover, we provide the first report
showing that a specific TE family is evolutionarily associated with a gene function category.
Background
It is widely recognized that a large fraction of mammalian
genomic DNA is accounted for by interspersed repeated ele-
ments. These sequences have been estimated to represent
more than 50% of the human genome [1]. In particular, the
great majority of human interspersed repeats derive from
Published: 20 December 2006
Genome Biology 2006, 7:R120 (doi:10.1186/gb-2006-7-12-r120)
Received: 31 July 2006
Revised: 25 October 2006
Accepted: 20 December 2006
The electronic version of this article is the complete one and can be
found online at />R120.2 Genome Biology 2006, Volume 7, Issue 12, Article R120 Sironi et al. />Genome Biology 2006, 7:R120
transposable elements (TEs). Four major classes of mamma-
lian TEs have been identified in mammals: long interspersed
elements (LINEs), short interspersed elements (SINEs), LTR
retrotrasposons and DNA transposons.
Overall, TEs cover more than 45% of the human genome [1]
but, most probably, another huge portion of human DNA is
accounted for by ancient transposons that have diverged too
far to be recognized as such. Indeed, different TE subtypes
have been active over different evolutionary periods [2],
implying that multiple copies of propagating elements accu-
mulated over discrete time periods depending on the pres-
ence of an active source. The result of this age-dependent
accumulation is that many TEs are restricted to closely
related species: about a half of human repeats cannot be iden-
tified in genomes of other than primate origin [3]; similarly,
most repeats that can be detected in mouse DNA are specific
to rodents. Nonetheless, repeated sequences that are com-
mon to all mammalian genomes exist as they probably ampli-
fied before the mammalian radiation [3].
Once considered as merely junk DNA, it is now widely recog-
nized that interspersed repeats have been playing a major role
in genome structure evolution as well as having an impact on
increased protein variability [2,4-8] and gene regulation [9].
Also, recent evidence has suggested that LINE elements have
been influencing genome-wide regulation of gene expression
[10] and possibly imprinting [11], while several reports [12-
16] showed that specific TEs in noncoding DNA regions have
been actively preserved among multiple species during evolu-
tion. Still, these observations do not contradict the 'selfish
DNA' concept, regarding TEs as parasitic elements that rely
more on their replication efficiency than on providing selec-
tive advantage to their host [17-19]; rather, evidence of selec-
tive benefits offered by TEs indicate that these elements have,
in some instances, been 'domesticated' [20] or recruited to
serve their host, a process also referred to as exaptation [21].
Several studies have suggested that TE integrations have been
subjected to purifying selection to limit the genetic load
imposed on their host. For example, genetic damage caused
by LINE retrotransposition and ectopic recombination has
been hypothesized to be responsible for selection against
these elements within human loci [22]. Also, LINE and LTR
elements have been reported to be underrepresented in prox-
imity to and within genes [23], probably as a cause of their
interference with regulatory processes.
In mammals the great majority of genes are interrupted by
introns that usually outsize coding sequences by several fold.
Similar to TEs, intervening regions were initially regarded as
scrap DNA before being recognized as fundamental elements
in the evolution of living organisms. TEs are abundant within
intronic regions as well as in 5' and 3' intergenic spacers; yet,
a comprehensive analysis of the forces driving TE insertion,
fixation and maintenance within mammalian genes has still
not been carried out. Here we show that gene features such as
sequence conservation, function and expression level shape
TE representation in human genes. Interestingly, we found
evidence that a subset of loci involved in immune responses
are enriched with MIR sequences; analysis of opossum
orthologous genes, as well as of MIR frequency profiles, indi-
cated that these TEs might serve a specific function in these
loci.
Results
TE distribution varies with gene class or function
We wished to verify whether different TE types might be dif-
ferentially represented depending on gene function. TE fre-
quency varies with intron length [24] and GC percentage [1].
Moreover, in line with previous findings [24], we show that,
although differences exist depending on MCS and TE age,
conserved sequences have an overall negative effect on TE fix-
ation frequency (Additional data file 1). For each TE type we
therefore performed multiple regression analysis on TE
number using intronic GC percentage, intron length and con-
served sequence length as independent variables. The fitted
values were then used to predict the expected TE number per
intron (nTEi
exp
). For each gene, the TE normalized abun-
dance (Te
na
) was calculated as follows:
where nTEi
obs
is the observed number of TEs per intron.
These calculations were performed for all TE families in both
human and mouse.
For each TE family, genes displaying three times more or less
TE than expected (TE
na
> 0.5 or TE
na
< -0.5) were classified as
TE-rich or TE-poor, respectively.
We next used GeneMerge [25] to retrieve significant associa-
tions; database annotations for the three categories desig-
nated by the Gene Ontology (GO) Consortium (molecular
function, biological process and cellular component) were
employed. Correction for multiple tests was applied to all sta-
tistical analyses. For each significant GO term retrieved,
genes that are present in the study set and associate (there-
fore contribute) to the term are designated as 'contributing
genes'. We also calculated MCS density and intergenic TE fre-
quency of contributing genes. In particular, for intergenic
sequences, TE
na
(igTE
na
) was calculated as described for
introns; for contributing gene sets the fractional igTE
na
devi-
ation was then calculated as:
(Mean igTE
na
in contributing genes - mean igTE
na
in all
genes)/|mean igTE
na
in all genes|
nTEi nTEi
nTEi nTEi
obs
igene igene
obs
igene
∈∈
∈
∑∑
∑
−
⎛
⎝
⎜
⎜
⎞
⎠
⎟
⎟
−
exp
ex
pp
igene∈
∑
⎛
⎝
⎜
⎜
⎞
⎠
⎟
⎟
Genome Biology 2006, Volume 7, Issue 12, Article R120 Sironi et al. R120.3
comment reviews reports refereed researchdeposited research interactions information
Genome Biology 2006, 7:R120
Similarly, fractional MCS density deviation was calculated for
contributing gene sets.
Data concerning significant (Bonferroni-corrected p value <
0.01) GO associations are summarized in Table 1. Three main
molecular function categories were found to be associated
with genes displaying low TE
na
(for more than one TE family).
The first one is accounted for by genes involved in nucleic acid
binding and transcription; these loci have, on average, high
intronic MCS densities and few TEs in their flanking regions.
The second functional category is represented by genes cod-
ing for cytokines/growth factors/hormones and, more gener-
ally, receptor ligands: these genes do not have, as a whole,
higher than average intron conservation and, with the excep-
tion of LTR-poor genes, tend to have low igTE
na
. The last cat-
egory (not present among Alu-poor genes) is accounted for by
structural molecules, mainly represented by ribosomal pro-
teins. These genes have extremely low MCS densities and
igTE
na
. These same associations were retrieved for mouse
genes (supplementary Table 1 in Additional data file 2),
although no GO term was significantly associated with L1-
depleted mouse genes.
Significant associations were also identified with biological
process GO terms. As expected [1,26] genes involved in mor-
phogenesis/development were over-represented in most TE-
poor groups and displayed extremely conserved intronic
regions as well as few intergenic TEs (except for LTRs). Also,
loci involved in immune defense/response to stimulus were
found to be over-represented among TE-poor genes. These
loci also have less TEs in their flanking regions and, on aver-
age, low MCS densities. Consistently with molecular function
GO term retrieval, genes involved in biological processes such
as transcription and metabolism were found to be overrepre-
sented among TE-poor groups. Again, similar findings were
obtained when mouse genes (supplementary Table 1 in Addi-
tional data file 2) were analyzed, although no biological proc-
ess GO term was significantly over-represented among genes
displaying low LINE or DNA transposon frequencies.
Moreover, a relatively small set of genes involved in sexual
reproduction/spermatogenesis were found to display lower
than expected MIR frequencies (both in introns and inter-
genic sequences) in humans but not in rodents.
TE-rich gene categories
Genes displaying higher than expected TE frequencies were
also identified for all repeat families, although they were less
numerous than TE-poor genes. GO analysis retrieved signifi-
cant associations (Bonferroni-corrected p value < 0.01) only
for MIR-rich human genes (Table 2).
GO terms associated with high MIR density differed between
human (Table 2) and mouse (Table 3); in particular, MIR-rich
genes belong to the immune response pathway in humans,
while they mainly code for ion channels in mice. In both
mammals, MIR density in these genes is not accounted for by
fewer integrations of younger TEs since MIR frequency
remains significantly higher than the average when calculated
on TE-free (unique) intron size. To gain further insight into
this issue, we singled out all genes contributing to at least one
GO term in Table 2 (85 genes) and searched for a murine
ortholog in our mouse gene dataset; 61 best unique reciprocal
orthologs were identified and their MIR density (calculated
on unique intron sequence) was significantly higher (Wil-
coxon rank sum test, p < 10
-14
) than the average (calculated
on all murine genes in our dataset). The same procedure was
applied to mouse MIR-rich genes contributing to GO terms in
Table 3; again, human genes displayed significantly higher
intronic MIR densities (Wilcoxon rank sum test, p < 10
-14
).
The difference between human and mouse in GO terms asso-
ciated with MIR-rich genes, therefore, results from the cut-off
we used (TE
na
> 0.5, corresponding to three times more than
expected) to define MIR-rich genes.
We next wished to verify whether these genes also had higher
frequencies of other ancestral TEs, namely L2s and DNA
transposons. The frequencies of these elements were calcu-
lated on TE-free intron size and no significant differences
were identified in either human or mouse when MIR-rich
genes involved in immune responses were compared to all
genes (not shown); this finding suggests that relaxation of
selective constraints allowing accumulation of ancestral TE
insertions is not responsible for MIR over-representation in
these genes. Conversely, MIR-rich ion channel introns also
displayed significantly higher frequencies of both DNA trans-
posons and L2s, indicating, therefore, that the relative enrich-
ment in old TEs is not specific to MIRs.
We therefore wished to verify whether high MIR frequency in
immune response genes also occurs in mammalian species
other than human and mouse. We therefore analyzed MIR
frequency in dog, as well as in our most distant extant mam-
malian ancestors, namely metatherian. To this aim we
searched both Canis familiaris and Monodelphis domestica
(gray short-tailed opossum) annotation tables and retrieved
dog/opossum genomic positions corresponding to human
transcripts in our dataset. A total of 5,476 human genes could
be located on the Monodelphis sequence (7,454 on the dog
sequence) and, out of 85 MIR-rich immune response genes,
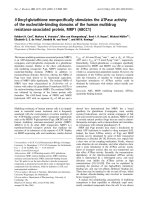
77 were identified in opossum (79 in dog). We then calculated
the frequency of mammalian-wide MIRs within dog and
opossum genes: in both species (Figure 1) immune response
loci displayed significantly higher frequencies compared to
the remaining genes (Wilcoxon rank sum test, p < 10
-15
and
0.022 for dog and opossum, respectively). Interestingly, in
addition to mammalian-wide MIR sequences, metatherian/
monotremata-specific MIR-related TEs are interspersed in
the opossum genome. These latter are mainly accounted for
by MON1 and MAR1 [3], and show 90% identity with the MIR
core sequence [27]. Opossum immune response loci also
R120.4 Genome Biology 2006, Volume 7, Issue 12, Article R120 Sironi et al. />Genome Biology 2006, 7:R120
Table 1
GO terms associated with TE-poor genes
Under-represented TE type
GO term Description Alu L1 L2 LTR DNA transp. MIR
Molecular
function
N MCS IG N MCS IG N MCS IG N MCS IG N MCS IG N MCS IG
GO:0003676 Nucleic acid binding - - - - - - 468 0.88* -0.44* 598 0.86* -0.27* - - - 327 1.07 -0.29*
GO:0003677 DNA binding - - - - - - - - - 394 1.27* -0.17 - - - 219 1.6* -0.34*
GO:0003723 RNA binding - - - - - - 131 0.08 -0.49* 153 0.13 -0.42* - - - 91 0.03 -0.12
GO:0003700 Transcription factor
activity
138 2.45* -0.63* 171 1.9* -0.51* 160 2.1* -0.41* 220 1.82* -0.09 165 2.18* -0.65* 125 2.23* -0.76*
GO:0030528 Transcription
regulator activity
159 2.35* -0.59* - - - - - - 279 1.57* -0.1 - - - 152 2.04* -0.67*
GO:0004871 Signal transducer
activity
3480.32-0.45* -
GO:0004888 Transmembrane
receptor activity
1380.23-0.31 -
GO:0005102 Receptor binding 137 0.5 -0.57* 170 0.29 0.03 149 0.24 0.14 192 0.33 0.2 155 0.32 -0.02 - - -
GO:0001664 G-protein-coupled
receptor binding
-25-0.14-0.23 -26-0.16-0.1 -
GO:0008083 Growth factor
activity
470.98-0.16 -640.730.45* -
GO:0005125 Cytokine activity 69 0.59 -0.71* 84 0.29 -0.36 - - - 91 0.44 0.48* 76 0.42 0.24 - - -
GO:0008009 Chemokine activity - - - 25 -0.14 -0.23 - - - - - - 26 -0.16 -0.1 - - -
GO:0042379 Chemokine receptor
binding
-25-0.14-0.23 -26-0.16-0.1 -
GO:0005179 Hormone activity 33 0.49 -0.71 - - - 41 0.11* -0.44 - - - 34 0.19* -0.47 27 0.49 -0.64
GO:0005184 Neuropeptide
hormone activity
10-0.120.27 -110.010.68 -
GO:0004252 Serine-type
endopeptidase
activity
-50-0.34*-0.01 -
GO:0004263 Chymotrypsin
activity
-38-0.45*-0.1 -
GO:0004295 Trypsin activity - - - 39 -0.45* -0.21 - - - - - - - - - - - -
GO:0003735 Structural
constituent of
ribosome
- - - 100 -0.34* -0.25 89 -0.41* -0.72* 116 -0.37* -0.58* 79 -0.35* -0.5 63 -0.33* -0.47
GO:0005198 Structural molecule
activity
- - - 212 -0.04 -0.4* 192 -0.11* -0.43* 260 -0.07 -0.2 - - - - - -
Biological process
GO:0007275 Development 335 1.41* -0.55* 410 1.13* -0.45* 386 1.19* -0.23 512 1.09* 0.1 384 1.32* -0.45* 258 1.58* -0.48*
GO:0009653 Morphogenesis 222 1.24* -0.48* - - - - - - 334 0.94* 0.21* - - - - - -
GO:0009887 Organogenesis 186 1.03* -0.46* - - - - - - 270 0.8* 0.22* - - - - - -
GO:0009888 Histogenesis - - - - - - - - - 47 0.49 0.46 - - - - - -
GO:0008544 Epidermis
development
24-0.27-1.4* -
GO:0001501Skeletal development361.4*-0.23 -
Genome Biology 2006, Volume 7, Issue 12, Article R120 Sironi et al. R120.5
comment reviews reports refereed researchdeposited research interactions information
Genome Biology 2006, 7:R120
GO:0007267 Cell-cell signaling 137 0.71* -0.27 162 0.69* 0.03 - - - - - - - - - - - -
GO:0007166 Cell surface receptor
linked signal
transduction
1610.29*-0.45* -
GO:0007186 G-protein coupled
receptor protein
signaling pathway
930.17-0.51* -
GO:0006952 Defense response 172 0.13* -0.75* 217 -0.08* -0.16 202 -0.11* -0.19 259 0* 0.01 219 -0.04* -0.2 - - -
GO:0006955 Immune response 155 0.17* -0.7* 201 -0.08* -0.19 - - - - - - 202 -0.05* -0.17 - - -
GO:0050896 Response to stimulus 268 0.13 -0.61* - - - - - - - - - - - - - - -
GO:0009607 Response to biotic
stimulus
187 0.1* -0.69* 240 -0.1* -0.21 222 -0.14* -0.16 290 -0.05* 0 235 -0.07* -0.25 - - -
GO:0009613 Response to pest,
pathogen or parasite
99 -0.02* -0.8* - - - - - - - - - 127 -0.33* -0.13 - - -
GO:0043207 Response to external
biotic stimulus
106 -0.09* -0.86* - - - - - - - - - 134 -0.36* -0.17 - - -
GO:0006817 Phosphate transport 27 -0.05 -0.39 - - - - - - - - - - - - - - -
GO:0006820Anion transport 410.03-0.47 -
GO:0015698 Inorganic anion
transport
380.03-0.49 -
GO:0006350 Transcription - - - - - - - - - 386 1.22* -0.16 - - - 211 1.43* -0.43*
GO:0045449 Regulation of
transcription
- - - - - - - - - 365 1.31* -0.15 - - - 198 1.53* -0.45*
GO:0006351 Transcription, DNA-
dependent
- - - - - - - - - 369 1.25* -0.16 - - - 203 1.48* -0.45*
GO:0006355 Regulation of
transcription, DNA-
dependent
- - - - - - 267 1.38* -0.23 355 1.31* -0.16 - - - 196 1.53* -0.46*
GO:0006139 Nucleobase,
nucleoside,
nucleotide and
nucleic acid
metabolism
-3011.08-0.23
GO:0019219 Regulation of
nucleobase,
nucleoside,
nucleotide and
nucleic acid
metabolism
- - - - - - - - - 371 1.29* -0.16 - - - 202 1.51* -0.46*
GO:0019222 Regulation of
metabolism
- - - - - - 303 1.32* -0.2 409 1.24* -0.16 - - - 217 1.54* -0.38*
GO:0006412 Protein biosynthesis - - - 144 -0.14 -0.34 - - - 179 -0.1* -0.48* - - - - - -
GO:0050876 Reproductive
physiological process
181.19-0.76 -
GO:0000003Reproduction -440.09*-0.38
GO:0019953Sexual reproduction -430.06*-0.38
GO:0007276Gametogenesis -390.14*-0.39
GO:0048232 Male gamete
generation
-330.07*-0.05
GO:0007283Spermatogenesis -330.07*-0.05
Significant differences are marked with an asterisk. DNA transp., DNA transposon; N, number of contributing genes; MCS, fractional intronic MCS
density deviation (see text); IG, fractional igTEna deviation (see text).
Table 1 (Continued)
GO terms associated with TE-poor genes
R120.6 Genome Biology 2006, Volume 7, Issue 12, Article R120 Sironi et al. />Genome Biology 2006, 7:R120
display higher metatherian/monotremata-specific MIR fre-
quencies compared to the remaining genes (Wilcoxon rank
sum test, p = 0.0023) (Figure 1).
Characterization of MIR sequences associated with
immune response genes
We next wished to verify whether MIR sequences in immune
response genes have some feature distinguishing them from
MIRs in other genomic locations. Four highly related MIR
subtypes (MIR, MIR3, MIRb and MIRm) have been identified
in the murine and human genomes [3]; the four subtypes dis-
play a central, almost identical 70 base-pair (bp) core region
[28]. To verify whether any MIR region has been preferen-
tially retained in MIR-rich immune response genes, we
retrieved all MIR elements located in the intronic regions of
these genes or in their flanking intergenic spacers. In the lat-
ter case, we restricted the analysis to TEs located within 15 kb
of 5' or 3' gene boundaries. We next used the different MIR
subtype reference sequences [3] to align all instances in
immune response gene introns or intergenic spacers sepa-
rately. To verify whether any MIR region was over- or under-
represented in these genes, we compared the average relative
frequency at each position with frequencies derived from 100
samples of an equal number of MIR sequences randomly
selected from either introns or intergenic spacers. The mean,
as well as the 1st and 99th percentiles in random sample fre-
quency distributions were then calculated at each position;
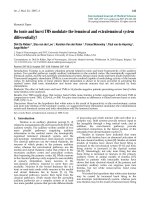
they are plotted in Figure 2a together with average frequen-
cies of MIRs located in immune response genes. This calcula-
tion was not performed for MIRm sequences because of their
paucity (47 instances in immune genes). The frequency pro-
file of MIR, MIR3 and MIRb sequences located in immune
response gene introns indicates that the central core region is
over-represented (beyond the 99th percentile) compared to
Table 2
GO terms associated with TE-rich human genes
Over-represented TE types
GO term Description Alu L1 L2 LTR DNA transp. MIR
Molecular function NMCS IG
GO:0008009 Chemokine activity - - - - - 9 -0.91* -0.66
GO:0005125 Cytokine activity - - - - - 24 -0.42 -0.13
GO:0001584 Rhodopsin-like receptor activity - - - - - 19 -0.44 0.31
GO:0042379 Chemokine receptor binding - - - - - 9 -0.91* -0.66
GO:0005102 Receptor binding - - - - - 38 -0.45 -0.03
GO:0001664 G-protein-coupled receptor binding - - - - - 9 -0.91* -0.66
Biological process
GO:0050874 Organismal physiological process - - - - - 89 -0.57* 0.01
GO:0009607 Response to biotic stimulus - - - - - 70 -0.69* 0.36
GO:0006955 Immune response - - - - - 60 -0.67* 0.23
GO:0009611 Response to wounding - - - - - 31 -0.73* 0.11
GO:0006954 Inflammatory response - - - - - 24 -0.79* 0.06
GO:0006952 Defense response - - - - - 66 -0.7* 0.3
GO:0045087 Innate immune response - - - - - 26 -0.78* 0.07
GO:0016064 Humoral defense mechanism - - - - - 14 -0.65 0.24
GO:0009617 Response to bacteria - - - - - 13 -0.83* 0.34
GO:0009613 Response to pest, pathogen or parasite - - - - - 47 -0.72* 0.21
GO:0043207 Response to external biotic stimulus - - - - - 51 -0.74* 0.16
GO:0006950 Response to stress - - - - - 53 -0.72* 0.16
GO:0042742 Defense response to bacteria - - - - - 9 -0.98* 0.36
GO:0009605 Response to external stimulus - - - - - 65 -0.76* 0.19
GO:0009620 Response to fungi - - - - - 6 -1* 0.91
GO:0009628 Response to abiotic stimulus - - - - - 28 -0.83* 0.55
GO:0042221 Response to chemical substance - - - - - 27 -0.83* 0.7
GO:0050896 Response to stimulus - - - - - 85 -0.71* 0.31
GO:0006968 Cellular defense response - - - - - 14 -0.64 -0.14
GO:0007267 Cell-cell signaling - - - - - 37 -0.26 -0.32
GO:0042330 Taxis - - - - - 17 -0.78* -0.1
GO:0006935 Chemotaxis - - - - - 17 -0.78* -0.1
GO:0030574 Collagen catabolism - - - - - 7 -0.69 -0.77
Significant differences are marked with an asterisk. DNA transp., DNA transposon; N, number of contributing genes; MCS, fractional intronic MCS
density deviation (see text); IG, fractional igTEna deviation (see text).
Genome Biology 2006, Volume 7, Issue 12, Article R120 Sironi et al. R120.7
comment reviews reports refereed researchdeposited research interactions information
Genome Biology 2006, 7:R120
the background intronic frequency. These same findings did
not apply to MIRb and MIR3 sequences in intergenic regions
flanking immune response genes (Figure 2b). Similar results
(supplemental Figure 2 in Additional data file 2) were
obtained for mouse MIR sequences located in immune
response genes.
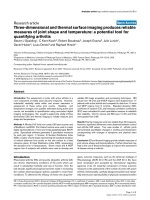
We therefore analyzed the human/mouse co-conservation
profile (that is, the frequency of bases that, in both human
and mouse, are equal to the MIR consensus sequence) of
human/mouse orthologous MIR instances. No significant dif-
ference was observed (Figure 3a-c) between MIRs located in
immune response introns and random MIR samples. Yet, as
is evident from Figure 3d, the central portion of intronic MIR
sequences, either located in defence response genes or not, is
more frequently co-conserved compared to 5' and 3' flanking
regions.
Repeat content as a function of expression level
Different TE types have been reported to differentially associ-
ate with gene regions depending on expression levels [29]. To
get further insight into this issue, we calculated expression
level (averaged over all tissues) for human and mouse genes
in our dataset. Since different experimental methods for
measuring gene expression have been shown to yield differ-
ent results [30], we used expression data derived from two
different experimental methods, namely microarray and
serial analysis of gene expression (SAGE). For each family,
TE
na
was then plotted against expression level and lowess
curves calculated (see Materials and methods for details). To
address the significance of the observed trends, 100 lowess
smooths were calculated after random data permutations and
empirical probability intervals were calculated (see Materials
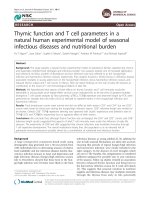
and methods). As is evident from Figure 4a, a marked
decrease in TE
na
is observed for genes above the 70th to 80th
gene expression percentile. Results obtained from SAGE
expression data, as well as for murine genes, gave similar
results and are available in Additional data file 2.
To gain further insight, we wished to compare intronic with
intergenic TE frequecies (TE number/sequence length). In
fact, intergenic and intronic regions belong to the same
isochore (that is, they display a similar CG percentage) and
their lengths are correlated [31], as well as their MCS density
(Spearman rho = 0.37, p < 10
-16
); therefore, TE density can be
directly compared. Thus, for each gene we calculated the rel-
ative frequency difference as:
(TEf
intron
/meanTEf
intron
) - (TEf
inter
/meanTEf
inter
)
where TEf
intron
is the average TE frequency for all introns in
the same gene, meanTEf
intron
is the average TE frequency for
all introns in all genes, TEf
inter
is the TE frequency averaged
for 5' and 3' regions flanking each gene and meanTEf
inter
is the
average TE frequency for all intergenic spacers. Again lowess
curves were obtained, as well as empirical probability inter-
vals derived from 100 random permutations; as shown in Fig-
ure 4b, for highly expressed genes and for all TE types, a
significant decreasing trend is observed when frequency dif-
ferences are plotted against gene expression. The same obser-
vations were confirmed using expression data derived from
SAGE experiments and they also apply to mouse genes (sup-
plementary Figures 3 to 5 in Additional data file 2). It is worth
noting that very similar results were also obtained when the
same calculations were performed using 8 kb sequences
flanking each gene (4 kb each side) instead of entire inter-
genic regions (supplementary Figure 6a,b in Additional data
file 2 for human genes and data obtained with either microar-
ray or SAGE, respectively). For the latter analyses only genes
Table 3
GO terms associated with TE-rich mouse genes
Over-represented TE types
GO term Description B1 L1 LTR L2 MIR B2/ID/B4
Molecular function N MCS IG N MCS IG N MCS IG
GO:0005215 Transporter activity - - - 64 -0.24 0.33 - - - - - -
GO:0005216 Ion channel activity - - - - - - 28 0.2 -0.05 - - -
GO:0015268 Alpha-type channel activity - - - - - - 33 0.13 0.12 - - -
GO:0015267 Channel or pore class transporter activity - - - - - - 33 0.13 0.12 - - -
GO:0005261 Cation channel activity - - - - - - 23 0.37* -0.08 - - -
GO:0005244 Voltage-gated ion channel activity - - - - - - 19 0.34 -0.1 - - -
Biological process
GO:0030001 Metal ion transport - - - - - - 26 0.31* -0.06 - - -
GO:0007264 Small GTPase mediated signal transduction - - - - - - - - - 14 -0.14 0.79
Significant differences are marked with an asterisk. N, number of contributing genes; MCS, fractional intronic MCS density deviation (see text); IG,
fractional igTEna deviation (see text).
R120.8 Genome Biology 2006, Volume 7, Issue 12, Article R120 Sironi et al. />Genome Biology 2006, 7:R120
displaying both 3' and 5' intergenic regions longer than 10 kb
were selected (n = 3,477).
Discussion
TE distribution in mammalian genomes has been addressed
in numerous studies. Yet, many questions concerning the
nature of the host-element relationship still remain unan-
swered and a comprehensive scenario of the selective forces
affecting TE fixation in mammalian genomes is still missing.
In particular, genome-wide analyses of TE type distribution
within and in proximity to human genes have often neglected
relevant features, such as sequence conservation, gene func-
tion and expression level.
Since the precise removal of an inserted transposon is a rare
event [32], present day TE distribution is the result of inser-
tion frequency and fixation probability over time. Previous
work had indicated that TE frequency inversely correlates
with different measures of noncoding sequence conservation
[24,33,34]. We confirm here (see Additional data file 1) that
these observations are explained by the intrinsic mutagenic
potential of transposition and the necessity of preserving
multispecies conserved sequences from disruption. In fact,
TE insertion is counterselected at different degrees depend-
ing on the relative timing of MCS fixation and TE activity.
Given this premise and considering insertion to be mutagenic
irrespective of TE family or type, we analyzed the distribution
of different TEs in human introns after correcting for the
known parameters affecting either integration frequency or
fixation probability, namely GC content [1,35], intron size
[24,34] and MCS density (this study and [24]). All analyses
have been carried out in parallel on human and mouse genes.
Such a procedure strengthens the ensuing conclusions since
the majority of TEs are specific to either species [3] and the
maintenance of ancestral TEs also differs between primates
and rodents due to the higher mutation rate of the latter [34].
Also, we analyzed intronic TE distribution in association with
Analysis of MIR frequency in dog and opossum immune defense genesFigure 1
Analysis of MIR frequency in dog and opossum immune defense genes. MIR sequences were divided into mammalian-wide and metatherian/monotremata-
specific. Immune response genes displayed significantly higher frequencies of both MIR types compared to the remaining genes. Box height represents
sample interquartile range and the bold line depicts the median position. The whiskers extend to the most extreme data point, which is no more than 1.5
times the interquartile range from the box.
Immune response Other
0.0000 0.0005 0.0010 0.0015
Dog mammalian−wide
Frequency
Immune response Other
0.0000 0.0005 0.0010 0.0015
Opossum mammalian−wide
Frequency
Immune response Other
0.0000 0.0005 0.0010 0.0015
Opossum metatheria/monotremata−specific
Frequency
Genome Biology 2006, Volume 7, Issue 12, Article R120 Sironi et al. R120.9
comment reviews reports refereed researchdeposited research interactions information
Genome Biology 2006, 7:R120
both MCS content and TE abundance in intergenic regions. In
fact, although we corrected for MCS presence in multiple
regression fitting, MCS content represents an indication of
gene complexity and regulatory accuracy [36]. On the other
hand, TE representation in intergenic spacers might highlight
differences in TE effect depending on location; this is espe-
cially relevant for TE families that have been previously
reported to be preferentially abundant in intergenic versus
intronic regions or vice versa [23].
The initial analysis of the human genome sequence [1] had
indicated that the HOX gene cluster is virtually deprived of
TEs; the same result was obtained upon analysis of the mouse
genome and interpreted in terms of TEs disturbing fine tuned
regulation of developmental genes. A more recent study indi-
cated that TE-free regions are significantly associated with
genes coding for developmental regulators or transcription
factors [26].
Our GO data indicate that functional classes associated with
TE-poor genes extend well beyond highly conserved gene cat-
egories such as developmental regulators and transcription
factors. In fact, some MCS-poor gene function categories also
display lower than expected TEs; genes coding for structural
molecules and ribosomal proteins are deprived of most TE
families in both introns and intergenic spacers. These loci are
mainly accounted for by housekeeping genes; if low TE repre-
sentation in intronic regions might be explained by the need
to reduce transcriptional costs (in agreement with TE paucity
in introns of highly expressed genes, as discussed below), the
reason why TEs are also excluded from intergenic spacers is
more difficult to explain. One possibility is that extensive
methylation of repetitive elements might exert a negative reg-
ulation on nearby gene expression with detrimental conse-
quences for housekeeping genes. Indeed, several reports [37-
40] have suggested the existence of specific methylation pat-
terns in TEs (probably representing a cellular defence mech-
anism against transposition) and methylation has been
shown to spread in cis from TEs to flanking cellular sequences
Analysis of human MIR sequences associated with immune response genesFigure 2
Analysis of human MIR sequences associated with immune response genes. (a) Relative frequency at each position of MIR (n = 277), MIRb (n = 382) and
MIR3 (n = 104) consensus sequences in immune response gene introns (red lines). Mean profiles and intervals corresponding to the 1st and 99th
percentiles in 100 random sample frequency distributions are represented by black lines and grey areas, respectively. (b) The same as in (a) for MIRs
located in intergenic regions. MIR, n = 239; MIRb, n = 345; MIR3, n = 97. Hatched lines delimit the MIR CORE region.
0 50 100 150 200 250
0.000 0.004 0.008
MIR
Position (bp)
Relative frequency
(a)
0 50 100 150 200 250
0.000 0.004 0.008
0 50 100 150 200 250
0.000 0.004 0.008
0 50 100 150 200 250
0.000 0.004 0.008
MIRb
Position (bp)
Relative frequency
0 50 100 150 200 250
0.000 0.004 0.008
0 50 100 150 200 250
0.000 0.004 0.008
0 50 100 150 200
0.000 0.004 0.008
MIR3
Position (bp)
Relative frequency
0 50 100 150 200
0.000 0.004 0.008
0 50 100 150 200
0.000 0.004 0.008
0 50 100 150 200 250
0.000 0.004 0.008
MIR
Position (bp)
Relative frequency
(b)
0 50 100 150 200 250
0.000 0.004 0.008
0 50 100 150 200 250
0.000 0.004 0.008
0 50 100 150 200 250
0.000 0.004 0.008
MIRb
Position (bp)
Relative frequency
0 50 100 150 200 250
0.000 0.004 0.008
0 50 100 150 200 250
0.000 0.004 0.008
0 50 100 150 200
0.000 0.004 0.008
MIR3
Position (bp)
Relative frequency
0 50 100 150 200
0.000 0.004 0.008
0 50 100 150 200
0.000 0.004 0.008
R120.10 Genome Biology 2006, Volume 7, Issue 12, Article R120 Sironi et al. />Genome Biology 2006, 7:R120
in plants and yeast [41,42]. In this respect, it is intriguing that
Alus, which show lower methylation levels [40], possibly due
to their association with a 'protective' sperm protein [43], are
not preferentially excluded from these same housekeeping
gene sets (Table 1). Similar considerations might be applied
to genes coding for cytokines, growth factors, and hormones
as well as genes involved in immune responses, all of which
display few intronic and intergenic TEs. Still, these genes are
not housekeeping genes or highly expressed and they also dis-
play lower than expected Alu frequencies. We speculate that
these gene categories might require extremely subtle regula-
tion of transcript levels (especially in the case of secreted pro-
teins) or precise timing of activation (for example, in
response to a stimulus). Indeed, altered hormone or cytokine
levels have been associated with human disease and cancer
(reviewed in [44,45]), while the effects of immune response
gene misregulation are easily envisaged. As mentioned above,
TEs can influence gene expression by both altering the epige-
netic state of TE-carrying alleles [46,47] and providing pro-
moters and transcription factor binding sites (either
enhancers or suppressors (reviewed in [48,49]) to the genes
neighboring their integration sites. In particular, Alus have
been shown to potentially carry functional sites for different
transcription factors as well as for both steroid-hormone and
retinoic acid receptors (reviewed in [48]); these observations
have led to the speculation that Alu integration might cause a
genetic disease not through gene coding sequence disruption
but rather through alteration of gene expression patterns
[50]. Indeed, several gene categories displaying lower than
expected intronic Alu frequencies also show significantly
fewer Alus in flanking intrergenic spacers.
It is interesting to notice that genes involved in immune
response, which display extremely low conservation in both
coding [51-53] and non-coding sequences [36], as well as a
higher content of TEs in their untranslated sequences [54],
are deprived of most TE types but enriched in MIR sequences
in three eutherian species (human, mouse and dog). Given
the partially independent origin of MIR sequences in eutheria
and metatheria, it is important to notice that analysis of
orthologous genes indicated that MIR over-representation
also occurs in opossum immune response genes, suggesting
the evolutionary conservation of a specific function for MIRs
located in these loci.
MIRs belong to a large TE superfamily referred to as CORE-
SINE [53]; all CORE-SINE TEs share a common 65 bp central
region that was proposed to be either relevant for retrotrans-
positional activity [27,55] or functional in the host genome
[28]. Previous studies noted a higher representation in mam-
malian genomes of MIR core regions compared to flanking 3'
and 5' sequences [12,28]; our data indicate that the core
sequence is both more frequent and more conserved in the
human genome, as assessed by co-conservation profiles.
Since MIRs are thought to be long time fossils [28], this
observation suggests that the core might serve some general
function in mammalian genomes. Indeed, upon analysis of
aligned human-mouse intergenic sequences, Silva et al. [12]
suggested that the core region is more often present in align-
ing orthologous regions than expected on the basis of back-
ground genome frequency. Our data indicate that this
observation also applies to MIR sequences located in immune
response gene introns. To our knowledge, this is the first
report showing that a specific TE family is evolutionarily
associated with a gene function category. Whether MIRs
located in defense response genes serve a specific function or
they share a common role with the other core sequences in the
genome remains to be elucidated. Recent works indicated
that two ancient SINE families have been extensively exapted
in the human genome and copies of these TEs have been
recruited to serve distinct functions in different genomic loca-
tions [14,16]. This might also be the case for MIRs; alterna-
tively, these sequences might all share a general role in the
human genome that is particularly important in immune
defense loci.
The last part of our work is devoted to studying the influence
of gene expression level on TE distribution. In fact, despite
the small population size, it has been reported that human
genes show signatures consistent with selection mediated by
expression levels [56]. In particular, selective pressure aimed
at reducing transcriptional cost has been proposed to act on
highly expressed human genes and TEs had been suggested as
possible targets for selection to act upon [57]. Our findings
strongly support this view: all TE families are under-repre-
sented in highly expressed genes. While the ability of LINE
L1s to affect mRNA transcription/processing efficiency [10]
might explain their exclusion from highly expressed introns,
Alus have been reported to associate with highly expressed
gene regions [29] and no direct effect on transcription or
processing has ever been described for ancestral TE families.
Therefore, the expression-dependent exclusion of all TE fam-
ilies from intronic regions is strongly consistent with the need
to reduce the transcription energetic costs. The issue had also
been raised as to whether a selective pressure is still acting on
highly expressed genes or if we merely witness the remnants
of a previous action of selection (still not at equilibrium) [56].
Co-conservation profile of MIR sequencesFigure 3 (see following page)
Co-conservation profile of MIR sequences. Co-conservation frequency at each position of (a) MIR (n = 277), (b) MIRb (n = 382) and (c) MIR3 (n = 104)
consensus sequences in immune response gene introns (red lines). Frequency intervals corresponding to the 1st and 99th percentiles in 100 random
sample frequency distributions are represented by the black lines. (d) Co-conservation profiles of MIR sequences located in human introns; in this case,
positions correspond to the alignment of the three MIR subtypes: MIR (black), MIRb (red) and MIR3 (blue).
Genome Biology 2006, Volume 7, Issue 12, Article R120 Sironi et al. R120.11
comment reviews reports refereed researchdeposited research interactions information
Genome Biology 2006, 7:R120
Figure 3 (see legend on previous page)
0 50 100 150 200 250
0.0 0.1 0.2 0.3 0.4 0.5 0.6
Position (bp)
Relative frequency
0 50 100 150 200 250
0.0 0.1 0.2 0.3 0.4 0.5 0.6
0 50 100 150 200 250
0.0 0.1 0.2 0.3 0.4 0.5 0.6
(a)
0 50 100 150 200 250
0.0 0.2 0.4 0.6
Position (bp)
Relative frequency
0 50 100 150 200 250
0.0 0.2 0.4 0.6
0 50 100 150 200 250
0.0 0.2 0.4 0.6
(b)
0 50 100 150 200
0.0 0.2 0.4 0.6 0.8 1.0
Position (bp)
Relative frequency
0 50 100 150 200
0.0 0.2 0.4 0.6 0.8 1.0
0 50 100 150 200
0.0 0.2 0.4 0.6 0.8 1.0
(c)
0 50 100 150 200 250
0.0 0.1 0.2 0.3 0.4
Position (bp)
Relative frequency
(d)
0 50 100 150 200 250
0.0 0.1 0.2 0.3 0.4
0 50 100 150 200 250
0.0 0.1 0.2 0.3 0.4
R120.12 Genome Biology 2006, Volume 7, Issue 12, Article R120 Sironi et al. />Genome Biology 2006, 7:R120
Our data support the first hypothesis: Alus, which represent
relatively young TEs are under-represented in highly
expressed introns and, in both human and mouse, separation
in TE divergence classes did not reveal any different expres-
sion-dependent association with TE age (not shown).
Materials and methods
Sequence retrieval and analysis
For creation of the intron database, human genes that had
been annotated in the NCBI Reference Sequence (RefSeq)
collection were selected (reviewed or validated entries only);
for mouse genes 'Provisional' entries were also included.
Genomic sequences, intron/exon boundaries and intergenic
regions were derived from the UCSC genome annotation
database [58] (assembly hg17 for human and mm5 for
mouse). Intronless genes were discarded and, for each gene,
the transcript corresponding to the longest genomic sequence
and containing the highest number of exons was selected. The
datasets are composed of 7,614 human and 5,550 mouse
genes, accounting for 81,599 and 55,553 introns, respectively.
For each gene, the closest 5' and 3' known genes were identi-
fied (using the UCSC knownGene table [58]); intergenic
regions were defined as the genomic portions extending
upstream and downstream of the transcribed region to the
closest gene.
Transposable elements were identified and categorized using
the UCSC annotation tables that rely on RepeatMasker. MCS
were obtained using phastCons predictions [13,59], which are
based on a phylogenetic hidden Markov model and are avail-
able through the UCSC database (phastConsElements Table
[58]). MCSs were derived from human/chimpanzee/mouse/
rat/dog/chicken/pufferfish/zebrafish multiz alignments
[58].
Only purely noncoding phastCons elements were selected
(that is, MCSs partially overlapping with exons were dis-
carded); a total of 238,005 and 596,018 human MCSs were
retrieved in introns and intergenic sequences, respectively. In
Gene-expression dependent variation in TE intronic abundanceFigure 4
Gene-expression dependent variation in TE intronic abundance. Gene expression levels were derived from microarray data. (a) Lowess fit (solid line) and
probability intervals (hatched lines) of TE
na
versus gene expression level (log transformed values) for the six TE families. (b) Lowess fit (solid line) and
probability intervals (hatched lines) of intronic to intergenic relative TE frequency difference (see text) versus gene expression level (log transformed
values).
12345
−1.0 −0.5 0.0 0.5
log
10
(gene expression)
TE
na
ALU
12345
−1.0 −0.5 0.0 0.5
log
10
(gene expression)
TE
na
MIR
12345
−1.0 −0.5 0.0 0.5
log
10
(gene expression)
TE
na
L1
12345
−1.0 −0.5 0.0 0.5
log
10
(gene expression)
TE
na
L2
12345
−1.0 −0.5 0.0 0.5
log
10
(gene expression)
TE
na
LTR
12345
−1.0 −0.5 0.0 0.5
log
10
(gene expression)
TE
na
DNA
12345
−1.0 −0.5 0.0 0.5
log
10
(gene expression)
relative frequency difference
12345
−1.0 −0.5 0.0 0.5
log
10
(gene expression)
relative frequency difference
12345
−1.0 −0.5 0.0 0.5
log
10
(gene expression)
relative frequency difference
12345
−1.0 −0.5 0.0 0.5
log
10
(gene expression)
relative frequency difference
12345
−1.0 −0.5 0.0 0.5
log
10
(gene expression)
relative frequency difference
12345
−1.0 −0.5 0.0 0.5
log
10
(gene expression)
relative frequency difference
(a)
(b)
Genome Biology 2006, Volume 7, Issue 12, Article R120 Sironi et al. R120.13
comment reviews reports refereed researchdeposited research interactions information
Genome Biology 2006, 7:R120
mouse, 133,458 intronic and 312,752 intergenic MCSs were
identified.
For the identification of human-mouse orthologous pairs, the
EnsMart database [60] was interrogated and only entries rep-
resenting unique best reciprocal hits were selected.
Retrieval of opossum and dog genes and annotations was per-
formed using UCSC tables [58] referring to assembly
monDom1 and canFam2. In particular, opossum/dog mRNA
accession numbers were identified by cross-referencing
tables 'geneName' and 'gbCdnaInfo' [58]. Genomic locations
were next retrieved through tables xenoMrna or
blastHg17KG. Monodelphis and dog TE annotations were
directly obtained from UCSC [58] and MIR number per gene
was calculated as the number of distinct elements fully con-
tained between gene boundaries. MIR frequency was calcu-
lated as MIR number/gene length.
Gene classification
Gene associations with GO terms and their descriptions were
performed by cross-referencing the UCSC hg17 kgXref table
[57] with the GO database [61]. Association and description
files were then created and significant associations between
gene groups and GO terms were identified using GeneMerge
[25].
MIR sequence analysis
MIR consensus sequences were derived from the Genetic
Information Research Institute (RepeatMasker database,
release 20060314) [62].
For calculation of the MIR relative frequency profile, human
or mouse MIR instances were aligned to the consensus
sequence using SWAT [63]. Microinsertions in human and
mouse instances were ignored. The relative frequency profile
at each position of the consensus sequence was calculated as
the number of instances covering the position divided by the
total number of bases in instances.
For calculation of MIR co-conservation profiles, we used the
liftOver utility at the UCSC genome browser [58] to obtain
human/mouse orthologous MIR instances. MIRs were then
aligned to the reference sequence using ClustalW. Microin-
sertions in human instances were ignored. For each MIR
position in human instances we calculated the frequency of
co-conservation (that is, the frequency of bases that, in both
human and mouse, are equal to the MIR consensus
sequence). This procedure was applied to both MIRs located
in immune response introns and to 100 randomly selected
MIR samples of equal size and located within intronic
regions. The co-conservation profile was then calculated
using a smoothing spline with a span of ten bases over non-
CpG positions.
Expression data
Microarray expression data for human and mouse genes were
derived from previous high-throughoutput gene expression
studies [64,65]; they are publicly accessible through the
UCSC database (tables 'gnfHumanAtlas2median' and
'gnfHumanAtlas2medianExps', and 'gnfMouseAtlas2median'
and 'gnfMouseAtlas2medianExps') [58]. We only considered
probes corresponding to genes that had been included in our
database; signals from duplicated probes on the same chip
were averaged as well as replicates from the same tissue. A
gene was considered to be expressed in a given tissue if its sig-
nal level was higher or equal to 200 arbitrary units, as previ-
ously recommended [64]. Data derived from tumor tissues
were discarded. In the case of SAGE data, for each transcript
entry in our databases we extracted a SAGE tag (10 bp down-
stream of the most 3' NlaIII site). For both human and
mouse, tags were then matched to all RefSeq mRNAs and
purged if they corresponded to more than one transcript.
SAGE libraries were obtained from the SAGE Genie website
[66]; for both organisms, libraries containing less than
20,000 tags, corresponding to tumor tissues, uncharacter-
ized tissues, pharmacological treatments and mutated sam-
ples were discarded. As previously suggested [67], libraries
with mean tag GC content >0.5 were also removed. We
retained 81 human libraries (both long and short tags),
accounting for 21 tissues; for mouse, we retained 98 libraries
accounting for 41 tissues.
Finally, we added all counts for libraries representing the
same tissue type and converted absolute tag counts to relative
tag counts (counts per million).
Statistical analysis
All statistical analyses were performed using R [68]. Locally
weighted scatter plot smoothing was performed using lowess
curves [69]. These curves are produced by weighted least-
square linear fitting within a window sliding through the data.
The size of the window (span) controls the degree of smooth-
ing and the curves are made robust by iterating the fit within
each window discarding outliers. In all cases 5 robustifying
iterations were performed and a span of 0.5 was used. To
allow empirical p value calculations, we performed 100 inde-
pendent random data permutations of the variable on the y
axis. Indeed, computing lowess smooths after random per-
mutations of the data can be used as a reference to gauge the
significance of the pattern observed on the actual data [70].
Probability interval limits were chosen, for each x value, as
corresponding to p = 0.005 and p = 0.995 in the distribution
of the 100 permutated y values considered as a Gaussian.
Additional data files
The following additional data are available with the online
version of this paper. Additional data file 1 contains supple-
R120.14 Genome Biology 2006, Volume 7, Issue 12, Article R120 Sironi et al. />Genome Biology 2006, 7:R120
mentary text presenting analysis of MCS density and TE inte-
gration frequency over evolutionary time. A supplementary
figure describing the results is also provided (supplementary
Figure 1) together with its legend. Additional data file 2 con-
tains supplementary Table 1, and supplementary Figures 2 to
6 and their legends: supplementary Table 1 lists GO terms
associated with mouse TE-poor genes; supplementary Figure
2 shows analysis of murine MIR sequences associated with
immune response genes; supplementary Figure 3 shows
gene-expression dependent variation in TE intronic abun-
dance for human genes (SAGE data); supplementary Figure 4
shows gene-expression dependent variation in TE intronic
abundance for mouse genes (microarray data); supplemen-
tary Figure 5 shows gene-expression dependent variation in
TE intronic abundance for mouse genes (SAGE data); supple-
mentary Figure 6 shows intronic to intergenic relative fre-
quency difference (calculated on gene flanks rather than
entire intergenic regions).
Additional data file 1Analysis of MCS density and TE integration frequency over evolu-tionary timeSupplementary text presenting analysis of MCS density and TE integration frequency over evolutionary time. A supplementary fig-ure describing the results is also provided (supplementary Figure 1) together with its legend.Click here for fileAdditional data file 2Supplementary Table 1 and supplementary Figures 2 to 6Supplementary Table 1 lists GO terms associated with mouse TE-poor genes. Supplementary Figure 2 shows analysis of murine MIR sequences associated with immune response genes. Supplemen-tary Figure 3 shows gene-expression dependent variation in TE intronic abundance for human genes (SAGE data). Supplementary Figure 4 shows gene-expression dependent variation in TE intronic abundance for mouse genes (microarray data). Supplementary Fig-ure 5 shows gene-expression dependent variation in TE intronic abundance for mouse genes (SAGE data). Supplementary Figure 6 shows intronic to intergenic relative frequency difference (calcu-lated on gene flanks rather than entire intergenic regions).Click here for file
Acknowledgements
We are grateful to Dr Roberto Giorda and Matteo Fumagalli for useful dis-
cussion about the manuscript.
References
1. Lander ES, Linton LM, Birren B, Nusbaum C, Zody MC, Baldwin J,
Devon K, Dewar K, Doyle M, FitzHugh W, et al.: Initial sequencing
and analysis of the human genome. Nature 2001, 409:860-921.
2. Smit AF: Interspersed repeats and other mementos of trans-
posable elements in mammalian genomes. Curr Opin Genet Dev
1999, 9:657-663.
3. Jurka J, Kapitonov VV, Pavlicek A, Klonowski P, Kohany O, Walichie-
wicz J: Repbase Update, a database of eukaryotic repetitive
elements. Cytogenet Genome Res 2005, 110:462-467.
4. Makalowski W, Mitchell GA, Labuda D: Alu sequences in the cod-
ing regions of mRNA: a source of protein variability. Trends
Genet 1994, 10:188-193.
5. Nekrutenko A, Li WH: Transposable elements are found in a
large number of human protein-coding genes. Trends Genet
2001, 17:619-621.
6. Sorek R, Ast G, Graur D: Alu-containing exons are alternatively
spliced. Genome Res 2002, 12:1060-1067.
7. Lev-Maor G, Sorek R, Shomron N, Ast G: The birth of an
alternatively spliced exon: 3' splice-site selection in Alu
exons. Science 2003, 300:1288-1291.
8. Iwashita S, Osada N, Itoh T, Sezaki M, Oshima K, Hashimoto E, Kita-
gawa-Arita Y, Takahashi I, Masui T, Hashimoto K, Makalowski W: A
transposable element-mediated gene divergence that
directly produces a novel type bovine Bcnt protein including
the endonuclease domain of RTE-1. Mol Biol Evol 2003,
20:1556-1563.
9. Jordan IK, Rogozin IB, Glazko GV, Koonin EV: Origin of a
substantial fraction of human regulatory sequences from
transposable elements. Trends Genet 2003, 19:68-72.
10. Han JS, Szak ST, Boeke JD: Transcriptional disruption by the L1
retrotransposon and implications for mammalian
transcriptomes. Nature 2004, 429:268-274.
11. Allen E, Horvath S, Tong F, Kraft P, Spiteri E, Riggs AD, Marahrens Y:
High concentrations of long interspersed nuclear element
sequence distinguish monoallelically expressed genes.
Proc
Natl Acad Sci USA 2003, 100:9940-9945.
12. Silva JC, Shabalina SA, Harris DG, Spouge JL, Kondrashovi AS: Con-
served fragments of transposable elements in intergenic
regions: evidence for widespread recruitment of MIR- and
L2-derived sequences within the mouse and human
genomes. Genet Res 2003, 82:1-18.
13. Siepel A, Bejerano G, Pedersen JS, Hinrichs AS, Hou M, Rosenbloom
K, Clawson H, Spieth J, Hillier LW, Richards S, et al.: Evolutionarily
conserved elements in vertebrate, insect, worm, and yeast
genomes. Genome Res 2005, 15:1034-1050.
14. Bejerano G, Lowe CB, Ahituv N, King B, Siepel A, Salama SR, Rubin
EM, Kent WJ, Haussler D: A distal enhancer and an ultracon-
served exon are derived from a novel retroposon. Nature
2006, 441:87-90.
15. Kamal M, Xie X, Lander ES: A large family of ancient repeat ele-
ments in the human genome is under strong selection. Proc
Natl Acad Sci USA 2006, 103:2740-2745.
16. Nishihara H, Smit AF, Okada N: Functional noncoding sequences
derived from SINEs in the mammalian genome. Genome Res
in press.
17. Doolittle WF, Sapienza C: Selfish genes, the phenotype para-
digm and genome evolution. Nature 1980, 284:601-603.
18. Orgel LE, Crick FH: Selfish DNA: the ultimate parasite. Nature
1980, 284:604-607.
19. Yoder JA, Walsh CP, Bestor TH: Cytosine methylation and the
ecology of intragenomic parasites. Trends Genet 1997,
13:335-340.
20. Miller WJ, McDonald JF, Nouaud D, Anxolabehere D: Molecular
domestication - more than a sporadic episode in evolution.
Genetica 1999, 107:197-207.
21. Gould SJ, Vrba ES: Exaptation: A missing term in the science of
form. Paleobiology 1982, 8:4-15.
22. Boissinot S, Entezam A, Furano AV: Selection against deleterious
LINE-1-containing loci in the human lineage. Mol Biol Evol
2001, 18:926-935.
23. Medstrand P, van de Lagemaat LN, Mager DL: Retroelement distri-
butions in the human genome: variations associated with age
and proximity to genes. Genome Res 2002, 12:1483-1495.
24. Sironi M, Menozzi G, Comi GP, Bresolin N, Cagliani R, Pozzoli U: Fix-
ation of conserved sequences shapes human intron size and
influences transposon insertion dynamics. Trends Genet 2005,
21:484-488.
25. Castillo-Davis CI, Hartl DL: GeneMerge-post-genomic analysis,
data mining, and hypothesis testing. Bioinformatics 2003,
19:891-892.
26. Simons C, Pheasant M, Makunin IV, Mattick JS: Transposon-free
regions in mammalian genomes. Genome Res 2006, 16:164-172.
27. Gilbert N, Labuda D: Evolutionary inventions and continuity of
CORE-SINEs in mammals. J Mol Biol 2000, 298:365-377.
28. Smit AF, Riggs AD: MIRs are classic, tRNA-derived SINEs that
amplified before the mammalian radiation. Nucleic Acids Res
1995, 23:98-102.
29. Versteeg R, van Schaik BD, van Batenburg MF, Roos M, Monajemi R,
Caron H, Bussemaker HJ, van Kampen AH: The human transcrip-
tome map reveals extremes in gene density, intron length,
GC content, and repeat pattern for domains of highly and
weakly expressed genes. Genome Res 2003, 13:1998-2004.
30. Semon M, Mouchiroud D, Duret L: Relationship between gene
expression and GC-content in mammals: statistical signifi-
cance and biological relevance. Hum Mol Genet 2005,
14:421-427.
31. Vinogradov AE: Compactness of human housekeeping genes:
selection for economy or genomic design? Trends Genet 2004,
20:248-253.
32. van de Lagemaat LN, Gagnier L, Medstrand P, Mager DL: Genomic
deletions and precise removal of transposable elements
mediated by short identical DNA segments in primates.
Genome Res 2005, 15:1243-1249.
33. Chiaromonte F, Yang S, Elnitski L, Yap VB, Miller W, Hardison RC:
Association between divergence and interspersed repeats in
mammalian noncoding genomic DNA. Proc Natl Acad Sci USA
2001, 98:14503-14508.
34. Pozzoli U, Menozzi G, Comi GP, Cagliani R, Bresolin N, Sironi M:
Intron size in mammals: complexity comes to terms with
economy. Trends Genet in press.
35. Waterston RH, Lindblad-Toh K, Birney E, Rogers J, Abril JF, Agarwal
P, Agarwala R, Ainscough R, Alexandersson M, An P, et al.: Initial
sequencing and comparative analysis of the mouse genome.
Nature 2002, 420:520-562.
36. Sironi M, Menozzi G, Comi GP, Cagliani R, Bresolin N, Pozzoli U:
Analysis of intronic conserved elements indicates that
functional complexity might represent a major source of
negative selection on non-coding sequences. Hum Mol Genet
2005, 14:2533-2546.
37. Yates PA, Burman RW, Mummaneni P, Krussel S, Turker MS: Tan-
Genome Biology 2006, Volume 7, Issue 12, Article R120 Sironi et al. R120.15
comment reviews reports refereed researchdeposited research interactions information
Genome Biology 2006, 7:R120
dem B1 elements located in a mouse methylation center
provide a target for de novo DNA methylation. J Biol Chem
1999, 274:36357-36361.
38. Liang G, Chan MF, Tomigahara Y, Tsai YC, Gonzales FA, Li E, Laird
PW, Jones PA: Cooperativity between DNA methyltrans-
ferases in the maintenance methylation of repetitive
elements. Mol Cell Biol 2002, 22:480-491.
39. Lees-Murdock DJ, De Felici M, Walsh CP: Methylation dynamics
of repetitive DNA elements in the mouse germ cell lineage.
Genomics 2003, 82:230-237.
40. Meunier J, Khelifi A, Navratil V, Duret L: Homology-dependent
methylation in primate repetitive DNA. Proc Natl Acad Sci USA
2005, 102:5471-5476.
41. Arnaud P, Goubely C, Pelissier T, Deragon JM: SINE retroposons
can be used in vivo as nucleation centers for de novo methyl-
ation. Mol Cell Biol 2000, 20:3434-3441.
42. Hall IM, Shankaranarayana GD, Noma K, Ayoub N, Cohen A, Grewal
SI: Establishment and maintenance of a heterochromatin
domain. Science 2002, 297:2232-2237.
43. Chesnokov IN, Schmid CW: Specific Alu binding protein from
human sperm chromatin prevents DNA methylation. J Biol
Chem 1995, 270:18539-18542.
44. Marx SJ, Simonds WF: Hereditary hormone excess: genes,
molecular pathways, and syndromes. Endocr Rev 2005,
26:615-661.
45. Bidwell J, Keen L, Gallagher G, Kimberly R, Huizinga T, McDermott
MF, Oksenberg J, McNicholl J, Pociot F, Hardt C, D'Alfonso S:
Cytokine gene polymorphism in human disease: on-line
databases. Genes Immun 1999, 1:3-19.
46. Morgan HD, Sutherland HG, Martin DI, Whitelaw E: Epigenetic
inheritance at the agouti locus in the mouse.
Nat Genet 1999,
23:314-318.
47. Rakyan VK, Chong S, Champ ME, Cuthbert PC, Morgan HD, Luu KV,
Whitelaw E: Transgenerational inheritance of epigenetic
states at the murine Axin(Fu) allele occurs after maternal
and paternal transmission. Proc Natl Acad Sci USA 2003,
100:2538-2543.
48. Britten RJ: Cases of ancient mobile element DNA insertions
that now affect gene regulation. Mol Phylogenet Evol 1996,
5:13-17.
49. Tomilin NV: Control of genes by mammalian retroposons. Int
Rev Cytol 1999, 186:1-48.
50. Batzer MA, Deininger PL: Alu repeats and human genomic
diversity. Nat Rev Genet 2002, 3:370-379.
51. Castillo-Davis CI, Kondrashov FA, Hartl DL, Kulathinal RJ: The func-
tional genomic distribution f protein divergence in two ani-
mal phyla: coevolution, genomic conflict, and constraint.
Genome Res 2004, 14:802-811.
52. Vallender EJ, Lahn BT: Positive selection on the human genome.
Hum Mol Genet 2004, 13 Spec No 2():R245-254.
53. Nielsen R, Bustamante C, Clark AG, Glanowski S, Sackton TB, Hubisz
MJ, Fledel-Alon A, Tanenbaum DM, Civello D, White TJ, et al.: A scan
for positively selected genes in the genomes of humans and
chimpanzees. PLoS Biol 2005, 3:E170.
54. van de Lagemaat LN, Landry JR, Mager DL, Medstrand P: Transpos-
able elements in mammals promote regulatory variation
and diversification of genes with specialized functions. Trends
Genet 2003, 19:530-536.
55. Gilbert N, Labuda D: CORE-SINEs: eukaryotic short inter-
spersed retroposing elements with common sequence
motifs. Proc Natl Acad Sci USA 1999, 96:2869-2874.
56. Urrutia AO, Hurst LD: The signature of selection mediated by
expression on human genes. Genome Res 2003, 13:2260-2264.
57. Castillo-Davis CI, Mekhedov SL, Hartl DL, Koonin EV, Kondrashov
FA: Selection for short introns in highly expressed genes.
Nat
Genet 2002, 31:415-418.
58. UCSC Genome Browser []
59. Siepel A, Haussler D: Combining phylogenetic and hidden
Markov models in biosequence analysis. J Comput Biol 2004,
11:413-428.
60. MartView [ />61. The Gene Ontology []
62. Genetic Information Research Institute [http://
www.girinst.org]
63. Green Group []
64. Su AI, Cooke MP, Ching KA, Hakak Y, Walker JR, Wiltshire T, Orth
AP, Vega RG, Sapinoso LM, Moqrich A, et al.: Large-scale analysis
of the human and mouse transcriptomes. Proc Natl Acad Sci
USA 2002, 99:4465-4470.
65. Su AI, Wiltshire T, Batalov S, Lapp H, Ching KA, Block D, Zhang J,
Soden R, Hayakawa M, Kreiman G, et al.: A gene atlas of the
mouse and human protein-encoding transcriptomes. Proc
Natl Acad Sci USA 2004, 101:6062-6067.
66. SAGE Genie [ />67. Margulies EH, Kardia SL, Innis JW: Identification and prevention
of a GC content bias in SAGE libraries. Nucleic Acids Res 2001,
29():E60-0.
68. The R Project for Statistical Computing [http://www.r-
project.org]
69. Cleveland W: Robust locally weighted regression and smooth-
ing scatterplots. J Amer Statist Assoc 1979, 74:829-836.
70. Good P: Permutation Tests: A Practical Guide To Resampling Methods For
Testing Hypotheses New York: Springer Verlag; 2000.