Báo cáo y học: "Systematic overestimation of gene gain through false diagnosis of gene absenc" pps
Bạn đang xem bản rút gọn của tài liệu. Xem và tải ngay bản đầy đủ của tài liệu tại đây (138.29 KB, 5 trang )
Genome Biology 2007, 8:402
Correspondence
Systematic overestimation of gene gain through false diagnosis of
gene absence
Olga Zhaxybayeva, Camilla L Nesbø and W Ford Doolittle
Address: Department of Biochemistry and Molecular Biology, Dalhousie University, 5850 College Street, Halifax, NS, B3H 1X5 Canada.
Correspondence: Olga Zhaxybayeva. Email:
Published: 26 February 2007
Genome Biology 2007, 8:402 (doi:10.1186/gb-2007-8-2-402)
The electronic version of this article is the complete one and can be
found online at />© 2007 BioMed Central Ltd
Genomes from different strains of the
same bacterial species often differ
substantially (up to 30%) in gene
content [1-6]. There are two general
ways to account for such gene content
variability (‘patchy distribution’) among
closely related genomes: strain-specific
loss of genes after divergence from a
common species ancestor that con-
tained the genes, and strain-specific
gain of genes after divergence from an
ancestor that lacked them. Gain might
be effected through lateral gene transfer
(LGT), duplication (paralog creation)
or, much less likely, de novo creation.
Several recent publications have
attempted to assess rates of within-
species gain and loss using parsimony-
based approaches applied to gene
presence/absence data, in the context
of a reference strain phylogeny [7-11].
Similar parsimony-based approaches
have also been taken for inferences of
gene gain/loss at larger phylogenetic
distances [12-14].
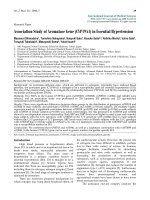
In such analyses, a pattern like that
shown in Figure 1a would be interpreted
to indicate a single event of gain of a
gene X not present in the species
ancestor, after the separation of taxa 4
and 5. Explaining this distribution as the
result of loss of a gene X initially present
in the ancestor would, in contrast,
require a minimum of four separate
events, a seemingly less parsimonious
scenario. However, reasoning by
parsimony in such a situation requires
difficult-to-test assumptions about the
relative frequency of gain and loss events
(that, for instance, losses are not four
times more frequent than gains).
Moreover, such reasoning is simply
beside the point if we have some other
sort of knowledge about the relevant
processes that suggests we might be
misled by appearances. Here we do know
that gain (at least when it occurs by gene
duplication or LGT) could be effectively
instantaneous, but that loss will more
commonly proceed gradually, through
intermediates we might call pseudogenes
and gene remnants (regions recognizable
as gene-derived only by synteny and
statistically significant sequence simi-
larity to the parent gene). There is thus
an inherent asymmetry between gain
and loss both in terms of defining and of
detecting them, and failure to recognize
gene remnants will inevitably lead to
mistaking a situation like that shown in
Figure 1b (in which a gene present in the
species’ ancestor has deteriorated in all
lineages but one) for the situation in
Figure 1a (in which a gene absent from
the ancestor has been gained in a single
lineage). Our goal in the present analysis
was to assess how often such mistakes
might be made.
Although prokaryotic genomes have
traditionally been viewed as efficiently
packed with functioning genes, and
mutationally biased towards rapid
deletion of dysfunctional regions [15],
there are new indications that
significant numbers of pseudogenes
persist in some genomes [16-18]. In
addition, detailed analyses show that in
reduced genomes such as those of
Rickettsia, intergenic regions often
represent decaying remnants of genes
[19]. Some categorization more nuanced
than ‘presence’ versus ‘absence’ might
thus better capture genome history. But
for gain-and-loss surveys of the sort
cited there may seem to be no
alternative to the binary approach. A
gene is considered ‘present’ if repre-
sented by an open reading frame (ORF)
showing significant similarity in
sequence (with arbitrarily chosen signi-
ficance cutoff) and having similar length
Abstract
The usual BLAST-based methods for assessing gene presence and absence lead to systematic
overestimation of within-species gene gain by lateral transfer.
to a query gene; otherwise it is scored as
‘absent’. We systematically screened
groups of closely related genomes (see
Additional data files 1-3) for gene-
family presence/absence patterns using
several common criteria. When poten-
tial gene remnants detectable by less
stringent methods are included, the
number of gene families for which
events of gain or loss within a species
might be inferred (because they are
scored as present only in some strains)
can drop by as much as 90% (or as little
as 7%) - on average about 60%. The
extent to which recognition of such
remnants will decrease estimates of the
rates of gain of genes by LGT and
increase estimates of the gene content
of species’ ancestors will depend on
how recognition affects inferred patterns
of presence and absence as displayed on
a phylogeny of the species’ strains. Each
gene family must be individually
examined, and where there is frequent
between-strain recombination, not only
is strain phylogeny a problematic
concept [20], but it will sometimes be
the case that gene remnants are
themselves acquired by LGT.
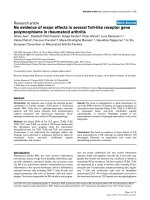
We have assessed the impact of more
complete recognition of gene remnants
in the simplest cases, those species for
which only three genomes are available.
We calculated the number of presence/
absence patterns that change under
different match-length requirements
for the eight such groups in our dataset
(Figure 2). Any change in any of the
402.2 Genome Biology 2007, Volume 8, Issue 2, Article 402 Zhaxybayeva et al. />Genome Biology 2007, 8:402
Figure 1
Illustration of parsimony inference from a gene/presence pattern and a reference tree topology. (a,b) Results of parsimonious inferences for the same
gene family, with different criteria used to define presence/absence patterns. In (a) genes are divided into only two categories, present and absent, while
in (b) the absent genes are further classified into gene remnants and genuinely absent.
Present
Remnant
Genuinely absent
(b)
123 456 7
123 456 7
Species ancestor
Species ancestor
(a)
possible presence/absence patterns as a
consequence of altered BLAST (Basic
Local Alignment Search Tool) [21]
criteria leads to a change in gain/loss
inference on a three-taxon tree, and in
all cases to a change in inferred
ancestral state. Such numbers are not
negligible in comparison with the total
number of inferred presence/absence
patterns (see the last row in Figure 2).
Therefore, without agreed-upon defini-
tions of presence/absence and reliable
methods of detection, quantitation of
rates of within-species gene gain have
questionable meaning. It is both a
Genome Biology 2007, Volume 8, Issue 2, Article 402 Zhaxybayeva et al. 402.3
Genome Biology 2007, 8:402
Figure 2
The analysis of patchily distributed gene families that change their state (present or absent) in different genomes under two different selection criteria for
gene families. Eight groups of three genomes each were analyzed. In one selection scheme, a match-length requirement of 85% in BLASTN was imposed
(stringent selection), while in the other there was no match-length requirement in BLASTN (relaxed selection). Corresponding gene families constructed
under the two criteria were compared and classified into all possible types of gene families (total 3
3
= 27). Of these, only those types of gene families (12)
where at least one gene is present under both criteria, and where at least one gene changes its state under the two criteria, are shown. They are coded
as filled circles (present under both criteria), empty circles (absent under both criteria) and half-filled circles (absent under the stringent criterion and
present under the relaxed criterion). Numbers in the figure indicate the number of patchily distributed gene families that change their state when under
two different selection criteria. The last row is the total number of gene families for which differences in history might be incorrectly inferred, expressed
as a percentage of total gene families detected as present in one or two, but not three, genomes in a genome group. The total number of gene families
used in the calculation is listed in the second table in Additional data file 2. Branches on the three-taxon tree are denoted as a, b, c and d. G, gain; L, loss;
A, ambiguous (both gain and loss are equally parsimonious); C, core (that is, present in all three genomes). The subscript refers to the branch on which
the event is inferred. For the list of genomes in each group see Additional data file 3.
a
b
c
d
Type of
gene
family
G
b
A
cd
33 13 0 18 3 1 29 6
G
a
A
cd
4281831236
G
b
L
a
19 55 1 12 1 3 44 3
G
a
L
b
5 6 4 13 1 1 38 2
G
b
C621573 1984444617
G
a
C433903 1776212512
A
cd
C 121 38 4 27 13 3 48 9
A
cd
L
a
6 155 0 16 4 0 11 3
A
cd
L
b
2310 9 6 0142
A
cd
C 43 852 13 12 76 15 111 7
L
a
C451761212 91613
L
b
C 5 68 4 9 20 11 15 8
Percenta
g
e 28.2 63.9 94.4 19.4 84.0 74.7 38.7 6.4
Most
parsimonious
scenario
Genome groups
BLASTP, 85%
and BLASTN, 85%
BLASTP, 85%
and BLASTN, 0%
Bordetella
Burkholderia
Ehrlichia
ruminatium
Legionella
pneumophila
Mycobacterium
Mycoplasma
hypopneumoniae
Neisseria
Streptococcus
agalactiae
practical concern and of theoretical
interest that we really do not have a
definition for gene loss. It is not clear
where - along the line from the appear-
ance of the first subtly deleterious
regulatory or missense mutation to the
deletion of the last nucleotide - we
would agree to declare a gene to be lost.
Parsimony-based inferences depend on
how we make that declaration, but most
quantitative treatments of gene loss in
evolution avoid this question alto-
gether. Moreover, in recombinogenic
species, the possibility of exchange of
remnants of inactivated genes between
lineages means that there will be
additional difficulties in reconstructing
the decay process for individual genes.
Indeed, in highly recombinogenic
groups such as Neisseria, where homo-
logous recombination, not mutation, is
the principal source of between-strain
sequence variation [22], it should
seldom be possible to reconstruct the
loss of an individual gene as a linear
process of decay. These problems are of
practical concern, as inferences about
gain and loss dominate discussion of
the evolution of pathogenicity and
environmental adaptation within species.
They are also of theoretical interest,
bearing on the use of parsimony in
evolutionary reconstruction.
As a matter of good practice, no claim
that strains of the same species differ in
gene content should be based on BLAST
results alone, as differences in anno-
tation abound and even BLASTing a
single genome against itself does not
recover all its annotated ORFs. No
BLASTP+BLASTN-based estimate of
the number of genes that a genome
must have received by LGT (because
they are absent from sister lineages in
the same species) should be accepted
without recognition that it is probably
too high, possibly by several-fold.
Species seem to differ in the extent to
which such estimates are sensitive to
BLAST parameters, and it is unlikely
that optimal parameters - could these
somehow be established - would be the
same for all species groups. Ideally, all
gene families would be examined for
even highly decayed remnants.
Additional data files
The following additional data are
available online with this paper.
Additional data file 1 contains Materials
and methods for the analyses
performed. Additional data file 2
describes in detail the comparison of
different BLAST-based criteria for
presence/absence detection. Additional
data file 3 is a table listing the
composition of the analyzed genome
groups.
Acknowledgements
This work was supported through CIHR (MOP-
4467) and Genome Atlantic (Genome Canada)
grants to W.F.D. O.Z. is supported through a
CIHR Postdoctoral Fellowship and is an hon-
orary Killam Postdoctoral Fellow at Dalhousie
University. O.Z., C.L.N. and W.F.D. designed
the study. O.Z. carried out all analyses. O.Z. and
W.F.D. wrote the manuscript.
References
1. Welch RA, Burland V, Plunkett G 3rd,
Redford P, Roesch P, Rasko D, Buckles EL,
Liou SR, Boutin A, Hackett J, et al.: Exten-
sive mosaic structure revealed by the
complete genome sequence of
uropathogenic Escherichia coli. Proc
Natl Acad Sci USA 2002, 99:17020-17024.
2. Rasko DA, Ravel J, Okstad OA, Helgason E,
Cer RZ, Jiang L, Shores KA, Fouts DE,
Tourasse NJ, Angiuoli SV, et al.: The
genome sequence of Bacillus cereus
ATCC 10987 reveals metabolic adap-
tations and a large plasmid related to
Bacillus anthracis pXO1. Nucleic Acids
Res 2004, 32:977-988.
3. Paulsen IT, Press CM, Ravel J, Kobayashi
DY, Myers GSA, Mavrodi DV, DeBoy RT,
Seshadri R, Ren Q, Madupu R, et al.: Com-
plete genome sequence of the plant
commensal Pseudomonas fluorescens
Pf-5. Nat Biotechnol 2005, 23:873.
4. Mongodin EF, Hance IR, Deboy RT, Gill SR,
Daugherty S, Huber R, Fraser CM, Stetter
K, Nelson KE: Gene transfer and
genome plasticity in Thermotoga mar-
itima, a model hyperthermophilic
species. J Bacteriol 2005, 187:4935-4944.
5. Nesbø CL, Nelson KE, Doolittle WF: Sup-
pressive subtractive hybridization
detects extensive genomic diversity in
Thermotoga maritima. J Bacteriol 2002,
184:4475-4488.
6. Tettelin H, Masignani V, Cieslewicz MJ,
Donati C, Medini D, Ward NL, Angiuoli SV,
Crabtree J, Jones AL, Durkin AS, et al.:
Genome analysis of multiple patho-
genic isolates of Streptococcus agalac-
tiae: implications for the microbial
“pan-genome”. Proc Natl Acad Sci USA
2005, 102:13950-13955.
7. Hao W, Golding GB: Patterns of bacter-
ial gene movement. Mol Biol Evol 2004,
21:1294-1307.
8. Ortutay C, Gaspari Z, Toth G, Jager E, Vida
G, Orosz L, Vellai T: Speciation in
Chlamydia: genomewide phylogenetic
analyses identified a reliable set of
acquired genes. J Mol Evol 2003, 57:672-
680.
9. Daubin V, Lerat E, Perriere G: The source
of laterally transferred genes in bacte-
rial genomes. Genome Biol 2003, 4:R57.
10. Hao W, Golding GB: The fate of later-
ally transferred genes: life in the fast
lane to adaptation or death. Genome
Res 2006, 16:636-643.
11. Marri PR, Bannantine JP, Paustian ML,
Golding GB: Lateral gene transfer in
Mycobacterium avium subspecies
paratuberculosis. Can J Microbiol 2006,
52:560-569.
12. Kunin V, Ouzounis CA: The balance of
driving forces during genome evolu-
tion in prokaryotes. Genome Res 2003,
13:1589-1594.
13. Mirkin BG, Fenner TI, Galperin MY, Koonin
EV: Algorithms for computing parsi-
monious evolutionary scenarios for
genome evolution, the last universal
common ancestor and dominance of
horizontal gene transfer in the evolu-
tion of prokaryotes. BMC Evol Biol 2003,
3:2.
14. McLysaght A, Baldi PF, Gaut BS: Extensive
gene gain associated with adaptive
evolution of poxviruses. Proc Natl Acad
Sci USA 2003, 100:15655-15660.
15. Mira A, Ochman H, Moran NA: Dele-
tional bias and the evolution of bacte-
rial genomes. Trends Genet 2001,
17:589-596.
16. Ochman H, Davalos LM: The nature and
dynamics of bacterial genomes. Science
2006, 311:1730-1733.
17. Lerat E, Ochman H: Recognizing the
pseudogenes in bacterial genomes.
Nucleic Acids Res 2005, 33:3125-3132.
18. Liu Y, Harrison PM, Kunin V, Gerstein M:
Comprehensive analysis of pseudo-
genes in prokaryotes: widespread
gene decay and failure of putative
horizontally transferred genes. Genome
Biol 2004, 5:R64.
19. Andersson JO, Andersson SG: Pseudo-
genes, junk DNA, and the dynamics of
Rickettsia genomes. Mol Biol Evol 2001,
18:829-839.
20. Feil EJ: Small change: keeping pace
with microevolution. Nat Rev Microbiol
2004, 2:483-495.
21. Altschul SF, Madden TL, Schaffer AA,
Zhang J, Zhang Z, Miller W, Lipman DJ:
Gapped BLAST and PSI-BLAST: a
new generation of protein database
search programs. Nucleic Acids Res 1997,
25:3389-3402.
22. Hanage W, Fraser C, Spratt B: Fuzzy
species among recombinogenic bac-
teria. BMC Biol 2005, 3:6.
23. Thompson JD, Higgins DG, Gibson TJ:
CLUSTAL W: improving the sensitiv-
ity of progressive multiple sequence
alignment through sequence weight-
ing, position-specific gap penalties and
weight matrix choice. Nucleic Acids Res
1994, 22:4673-4680.
24. Swofford D: PAUP* 4.0 Beta Version, Phyloge-
netic Analysis Using Parsimony (and Other
Methods) Sunderland, MA; Sinauer Associ-
ates; 1998.
25. van Dongen S: A cluster algorithm for
graphs. Technical Report INS-R0010.
402.4 Genome Biology 2007, Volume 8, Issue 2, Article 402 Zhaxybayeva et al. />Genome Biology 2007, 8:402
Amsterdam: National Research Institute for
Mathematics and Computer Science in the
Netherlands; 2000.
26. Konstantinidis KT, Tiedje JM: Genomic
insights that advance the species defi-
nition for prokaryotes. Proc Natl Acad Sci
USA 2005, 102:2567-2572.
27. Pearson WR: Effective protein sequence
comparison. Methods Enzymol 1996, 266:
227-258.
28. Fraser-Liggett CM: Insights on biology
and evolution from microbial genome
sequencing. Genome Res 2005, 15:1603-
1610.
29. Nierman WC, DeShazer D, Kim HS, Tet-
telin H, Nelson KE, Feldblyum T, Ulrich RL,
Ronning CM, Brinkac LM, Daugherty SC, et
al.: Structural flexibility in the Burk-
holderia mallei genome. Proc Natl Acad
Sci USA 2004, 101:14246-14251.
Genome Biology 2007, Volume 8, Issue 2, Article 402 Zhaxybayeva et al. 402.5
Genome Biology 2007, 8:402