Báo cáo y học: "DarkHorse: a method for genome-wide prediction of horizontal gene transfer" pptx
Bạn đang xem bản rút gọn của tài liệu. Xem và tải ngay bản đầy đủ của tài liệu tại đây (403.45 KB, 18 trang )
Genome Biology 2007, 8:R16
comment reviews reports deposited research refereed research interactions information
Open Access
2007Podell and GaasterlandVolume 8, Issue 2, Article R16
Method
DarkHorse: a method for genome-wide prediction of horizontal
gene transfer
Sheila Podell and Terry Gaasterland
Address: Scripps Genome Center, Scripps Institution of Oceanography, University of California at San Diego, Gilman Drive, La Jolla, CA 92093-
0202, USA.
Correspondence: Sheila Podell. Email:
© 2007 Podell et al.; licensee BioMed Central Ltd.
This is an open access article distributed under the terms of the Creative Commons Attribution License ( which
permits unrestricted use, distribution, and reproduction in any medium, provided the original work is properly cited.
DarkHorse: predicting horizontal gene transfer<p>DarkHorse is a new approach to rapid, genome-wide identification and ranking of horizontal transfer candidate proteins.</p>
Abstract
A new approach to rapid, genome-wide identification and ranking of horizontal transfer candidate
proteins is presented. The method is quantitative, reproducible, and computationally undemanding.
It can be combined with genomic signature and/or phylogenetic tree-building procedures to
improve accuracy and efficiency. The method is also useful for retrospective assessments of
horizontal transfer prediction reliability, recognizing orthologous sequences that may have been
previously overlooked or unavailable. These features are demonstrated in bacterial, archaeal, and
eukaryotic examples.
Background
Horizontal gene transfer can be defined as the movement of
genetic material between phylogenetically unrelated organ-
isms by mechanisms other than parent to progeny inherit-
ance. Any biological advantage provided to the recipient
organism by the transferred DNA creates selective pressure
for its retention in the host genome. A number of recent
reviews describe several well-established pathways of hori-
zontal transfer [1-4]. Evidence for the unexpectedly high fre-
quency of horizontal transmission has spawned a major re-
evaluation in scientific thinking about how taxonomic rela-
tionships should be modeled [4-9]. It is now considered a
major factor in the process of environmental adaptation, for
both individual species and entire microbial populations.
Horizontal transfer has also been proposed to play a role in
the emergence of novel human diseases, as well as determin-
ing their virulence [10,11].
There is currently no single bioinformatics tool capable of
systematically identifying all laterally acquired genes in an
entire genome. Available methods for identifying horizontal
transfer generally rely on finding anomalies in either nucle-
otide composition or phylogenetic relationships with ortholo-
gous proteins. Nucleotide content and phylogenetic
relatedness methods have the advantage of being independ-
ent of each other, but often give completely different results.
There is no 'gold standard' to determine which, if either, is
correct, but it has been suggested that different methodolo-
gies may be detecting lateral transfer events of different rela-
tive ages [2,12].
In addition to having good sensitivity and specificity, ideal
tools for identifying horizontal transfer at the genomic level
should be computationally efficient and automated. The cur-
rent environment of rapid database expansion may require
analyses to be re-performed frequently, in order to take
advantage of both new genome sequences and new annota-
tion information describing previously unknown protein
functions. Re-analysis using updated data may provide new
insights, or even change conclusions completely.
Published: 2 February 2007
Genome Biology 2007, 8:R16 (doi:10.1186/gb-2007-8-2-r16)
Received: 4 August 2006
Revised: 9 November 2006
Accepted: 2 February 2007
The electronic version of this article is the complete one and can be
found online at />R16.2 Genome Biology 2007, Volume 8, Issue 2, Article R16 Podell and Gaasterland />Genome Biology 2007, 8:R16
A variety of strategies have been used to predict horizontal
gene transfer using nucleotide composition of coding
sequences. Early methods flagged genes with atypical G + C
content; later methods evaluate codon usage patterns as pre-
dictors of horizontal transfer [13-15]. A variety of so called
'genomic signature' models have been proposed, using nucle-
otide patterns of varying lengths and codon position. These
models have been analyzed both individually and in various
combinations, using sliding windows, Bayesian classifiers,
Markov models, and support vector machines [16-19].
One limitation of nucleotide signature methods is that they
can suggest that a particular gene is atypical, but provide no
information as to where it might have originated. To discover
this information, and to verify the validity of positive candi-
dates, signature-based methods rely on subsequent valida-
tion by phylogenetic methods. These cross-checks have
revealed many clear examples of both false positive and false
negative predictions in the literature [20-23].
The fundamental source of error in predictions based on
genomic signature methods is the assumption that a single,
unique pattern can be applied to an organism's entire genome
[24]. This assumption fails in cases where individual proteins
require specialized, atypical amino acid sequences to support
their biological function, causing their nucleotide composi-
tion to deviate substantially from the 'average' consensus for
a particular organism. Ribosomal proteins, a well known
example of this situation, must often be manually removed
from lists of horizontal transfer candidates generated by
nucleotide-based identification methods [25].
The assumption of genomic uniformity is also incorrect in the
case of eukaryotes that have historically acquired a large
number of sequences through horizontal transfer from an
internal symbiont, or an organelle like mitochondrion or
chloroplast. For example, the number of genes believed to
have migrated from chloroplast to nucleus represents a sub-
stantial portion of the typical plant genome [26]. In this case,
patterns of nucleotide composition should fall into at least
two distinct classes, requiring multiple training sets to build
successful models using machine learning algorithms. To
avoid this complexity, many authors propose limiting appli-
cation of their genomic signature methods to simple prokary-
otic or archaeal systems.
Phylogenetic methods seek to identify horizontal transfer
candidates by comparison to a baseline phylogenetic tree (or
set of trees) for the host organism. Baseline trees are usually
constructed using ribosomal RNA and/or a set of well-con-
served, well-characterized protein sequences [27]. Each
potential horizontal transfer candidate protein is then evalu-
ated by building a new phylogenetic tree, based on its individ-
ual sequence, and comparing this tree to the overall baseline
for the organism. Unexpectedness is usually defined as find-
ing one or more nearest neighbors for the test sequence in
disagreement with the baseline tree. More recently, a number
of automated tree building methods have used statistical
approaches to identify trees for individual genes that do not
fit a consensus tree profile [28-32].
Although phylogenetic trees are generally considered the best
available technique for determining the occurrence and direc-
tion of horizontal transfer, they have a number of known lim-
itations. Analysts must choose appropriate algorithms, out-
groups, and computational parameters to adjust for variabil-
ity in evolutionary distance and mutation rates for individual
data sets. Results may be inconclusive unless a sufficient
number and diversity of orthologous sequences are available
for the test sequence. In some cases, a single set of input data
may support multiple different tree topologies, with no one
solution clearly superior to the others. Building trees is espe-
cially challenging in cases where the component sequences
are derived from organisms at widely varying evolutionary
distances.
Perhaps the biggest drawback to using tree-based methods
for identifying horizontal transfer candidates is that these
methods are very computationally expensive and time con-
suming; it is currently impractical to perform them on large
numbers of genomes, or to update results frequently as new
information is added to underlying sequence databases. Even
a relatively small prokaryotic genome requires building and
analyzing thousands of individual phylogenetic trees. To
manage this computational complexity, many authors explor-
ing horizontal transfer events have been forced to limit their
calculations to one or a few candidate sequences at a time.
More recently, semi-automated methods have become avail-
able for building multiple phylogenetic trees at once [33,34].
These methods are suitable for application to whole genomes,
and include screening routines to identify trees containing
potential horizontal transfer candidates. However, to achieve
reasonable sensitivity without an unacceptable false positive
rate, these methods still require each candidate tree identified
by the automated screening process to be manually evaluated.
One recent publication described the automated creation of
3,723 trees, of which 1,384 were identified as containing
potential horizontal candidates [35]. After all 1,384 candidate
trees were inspected manually, approximately half were
judged too poorly resolved to be useful in making a determi-
nation. Of the remaining trees, only 31 were ultimately
selected as containing horizontally transferred proteins.
Despite the Herculean effort involved in producing these
data, the authors concluded that it was only a 'first look' at
horizontal transfer, which would need to be repeated when
more sequence data became available for closely related
organisms.
Given the time and difficulty of creating phylogenetic trees
from scratch, a tool that automatically coupled amino acid
sequence data with known lineage information could avoid an
Genome Biology 2007, Volume 8, Issue 2, Article R16 Podell and Gaasterland R16.3
comment reviews reports refereed researchdeposited research interactions information
Genome Biology 2007, 8:R16
enormous amount of repetitive effort in re-calculating well-
established facts. It is, therefore, somewhat surprising that
currently available methods do not generally take advantage
of resources like the NCBI Taxonomy database, which links
phylogenetic information for thousands of different species to
millions of protein sequences. One notable exception has
been the work of Koonin et al. [1], who searched for horizon-
tal transfer in 31 bacterial and archaeal genomes by a combi-
nation of BLAST searches with semi-automated and manual
screening techniques. To avoid false positive results, these
authors felt it necessary to manually check every 'paradoxical'
best hit, in many cases amounting to several hundred
matches per microbial genome. While this strategy undoubt-
edly improved the quality of results presented, the extensive
amount of time and labor required for manual inspection pre-
cludes applying the techniques used by these authors to larger
eukaryotic genomes, or to the hundreds of new microbial
genomes sequenced since 2001.
One potential problem in using taxonomy database informa-
tion as a horizontal transfer identification tool is the difficulty
of establishing reliable surrogate criteria for orthology, which
might avoid the need for extensive re-building of phyloge-
netic trees. It is well known that 'top hit' sequence alignments
identified by the BLAST search algorithm do not necessarily
return the phylogenetically most appropriate match [36]. In
addition to incorrect ranking of BLAST matches, other diffi-
culties to be overcome include differences in BLAST score sig-
nificance due to mutation rate variability, unequal
representation of different taxa in source databases, and
potential gene loss from closely related species [37]. Finally,
any detection system dependent on identifying phylogeneti-
cally distant matches may sacrifice sensitivity in detecting
horizontal transfer between closely related organisms.
To address these issues, the DarkHorse algorithm combines a
probability-based, lineage-weighted selection method with a
novel filtering approach that is both configurable for phyloge-
netic granularity, and adjustable for wide variations in pro-
tein sequence conservation and external database
representation. It provides a rapid, systematic, computation-
ally efficient solution for predicting the likelihood of horizon-
tally transferred genes on a genome-wide basis. Results can
be used to characterize an organism's historical profile of hor-
izontal transfer activity, density of database coverage for
related species, and individual proteins least likely to have
been vertically inherited. The method is applicable to
genomes with non-uniform compositional properties, which
would otherwise be intractable to genomic signature analysis.
Because the procedure is both rapid and automated, it can be
performed as often as necessary to update existing analyses.
Thus, it is particularly useful as a screening tool for analyzing
draft genome sequences, as well as for application to organ-
isms where the number of database sequences available for
taxonomic relatives is changing rapidly. Promising results
can be then prioritized and analyzed in more depth using
independent criteria, such as nucleotide composition, man-
ual construction of phylogenetic trees, synteneic neighbor
analysis, or other more detailed, labor-intensive methods.
Results
Algorithm overview
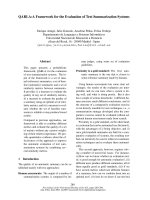
Figure 1 illustrates the basic steps in analyzing a genome
using the DarkHorse algorithm, with Escherichia coli strain
K12 as an example. In addition to protein sequences from the
test genome and a reference database, program input
includes two user-modifiable parameters: a list of self-defini-
tion keywords and/or taxonomy id numbers, and a filter
threshold setting. The self-definition keywords determine
phylogenetic granularity of the search and relative age of
potential horizontal transfer events being examined. The fil-
ter threshold setting is a numerical value used to adjust strin-
gency for relative database abundance or scarcity of
sequences from species closely related to the test genome.
These parameters can be varied independently or iteratively
in repeated runs to fine-tune the scope of the analysis.
The process begins with a low stringency BLAST search, per-
formed for all predicted genomic proteins against the refer-
ence database. All BLAST matches containing self-definition
keywords and/or taxonomy id numbers are eliminated from
these search results. For each genomic protein, the remaining
BLAST alignments are filtered to select a candidate match set,
based on both query-specific BLAST scores and the global fil-
ter threshold setting. Database proteins with the maximum
bit score from each candidate set are used to calculate prelim-
inary 'lineage probability index' (LPI) scores. LPI is a new
metric introduced in this paper that is key to the genome-
wide identification of horizontally transferred candidates.
Organisms closely related to the query genome receive higher
LPI scores than more distant ones, and groups of phylogenet-
ically related organisms receive similar scores to each other,
regardless of their abundance or scarcity in the reference
database. Details of the procedure used to calculate LPI
scores are presented in the Materials and methods section.
Preliminary LPI scores are used to re-order the candidate
sets, now choosing the candidate with the maximum LPI
score from each set as top-ranking. These revised top-ranking
matches are then used to refine preliminary LPI scores in a
second round of calculation. Final results are presented in a
tab-delimited table of results. An example of the program's
tab-delimited output is provided as Additional data file 1.
GenBank nr was chosen as the reference database for this
study to obtain the widest possible diversity of potential
matches, but the algorithm could alternatively be imple-
mented using narrower or more highly curated databases.
The set of query protein sequences must be large enough to
fairly represent the full range of diversity present in the entire
genome. The easiest way to ensure unbiased sampling is to
R16.4 Genome Biology 2007, Volume 8, Issue 2, Article R16 Podell and Gaasterland />Genome Biology 2007, 8:R16
include all predicted protein sequences from a genome, but
this requirement might also be met in other ways, for exam-
ple, with a large set of cDNA sequences. Blast searches per-
formed using predicted amino acid sequences were found to
Flow diagram illustrating DarkHorse work flow, with example numbers for Escherichia coli strain K12Figure 1
Flow diagram illustrating DarkHorse work flow, with example numbers for Escherichia coli strain K12. Parallelograms indicate data, rectangles indicate
processes. Parallelograms with dashed borders indicate intermediate data, output by one step and input to the next step.
3.5 million db protein sequences
4302 query protein sequences
Self-definition keywords
Filter threshold setting
Select non-self candidate set for
each query meeting query-specific
score criteria
Calculate lineage probabilities for
whole genome based on lineages of
matches with top bit scores
Select match with highest lineage
probability in each candidate set
Recalculate lineage
probabilities for top-ranking
matches (final LPI scores)
4179 candidate sets
2
2,771 candidate matches
4179 top-ranking matches
Low stringency BLAST
query v.s. db
639,883 non-self matches
115 lineage probabilities
Table of Results
4179 rows, 18 columns
Genome Biology 2007, Volume 8, Issue 2, Article R16 Podell and Gaasterland R16.5
comment reviews reports refereed researchdeposited research interactions information
Genome Biology 2007, 8:R16
be more useful than nucleic acid searches, resulting in fewer
false positive matches and giving a more favorable signal/
noise ratio.
Parameter settings for the preliminary BLAST search are
used as a coarse filter to reduce computation time and mem-
ory requirements, removing low scoring matches as early as
possible. These initial settings need to be broad enough to
include even very distant orthologs, but do not affect final LPI
scores as long as no true protein orthologs have been prema-
turely eliminated. To reduce the frequency of single-domain
matches to multi-domain proteins, initial filtering for this
study included a requirement for each match to cover at least
60% of the query sequence length. BLAST bit score was used
as a metric for subsequent ranking and filtering steps, to
ensure fairness in analyzing sequences of varying lengths.
Selection and ranking of candidate match sets
One well-known problem in using the BLAST search algo-
rithm to rank candidate matches is that highly conserved pro-
teins can generate multiple database hits with similar scores,
and quantitative differences between the first hit and many
subsequent matches may be statistically insignificant. No sin-
gle, absolute threshold value is suitable as a significance cut-
off for all proteins within a genome, because degree of
sequence conservation varies tremendously. In addition to
variability among proteins, mutation rates and database rep-
resentation can also vary widely between taxa, so appropriate
threshold values may need adjustment by query organism, as
well as by individual protein.
To overcome these problems, DarkHorse considers bit score
differences relative to other BLAST matches against the same
genomic query, rather than considering absolute differences.
For each query protein, a set of ortholog candidates is gener-
ated by selecting all matches that fall within an individually
calculated bit score range. The minimum of this range is set
as a percentage of the best available score for any non-self hit
against that particular query. The percentage is equal to the
global filter threshold setting chosen by the user, which can,
in theory, vary between 0% and 100%. A zero value requires
that all candidate matches for a particular query have bit
scores exactly equal to the top non-self match. Filter thresh-
old settings intermediate between 0% and 100% require that
candidate matches have bit scores in a range within the spec-
ified percentage of the highest scoring non-self match. In
practice, values between 0% and 20% are found to be most
useful in identifying valid horizontal transfer candidates. The
effects of threshold settings on the phylogeny of top-ranking
candidates are illustrated for genomes from four different
organisms in Tables 1 to 7.
Once candidate match sets have been selected for each
genomic protein, lineage information is retrieved from the
taxonomy database. This information is used to calculate pre-
liminary estimates of lineage frequencies among potential
database orthologs of the query genome. These preliminary
estimates are used as guide probabilities in a first round of
candidate ranking, then later refined in a second round of
ranking.
The probability calculation procedure, described in detail in
the Materials and methods section, is based on the average
relative position and frequency of lineage terms. More weight
is given to broader, more general terms occurring at the
beginning of a lineage (for example, kingdom, phylum, class),
and less weight to narrower, more detailed terms that occur
at the end (for example, family, genus, species). To compen-
sate for the fact that some lineages contain more intermediate
terms than others (for example, including super- and/or sub-
classes, orders, or families), the calculation normalizes for
total number of terms, and weights each term according to its
average position among all lineages tested, rather than an
absolute taxonometric rank. The end result is a very fast,
computationally simple technique to assign higher probabil-
ity scores to lineages that occur more frequently, and lower
scores to lineages that occur only rarely. Groups of phyloge-
netically related organisms receive similar lineage probability
scores, even if actual matches to the query genome are une-
venly distributed among individual members of the group.
Table 1
Effect of filter threshold setting on best match lineages for E. coli
Filter threshold setting
0% 2% 5% 10% 20% 30% 40% 60% 80% 100%
Enterobacteria 4,000 4,034 4,052 4,063 4,064 4,078 4,092 4,105 4,112 4,112
Other bacteria 13211210396857476645858
Phage 2724181412117666
Eukaryotes 8666444433
Archaea 0000000000
Total matches 4,167 4,176 4,179 4,179 4,165 4,167 4,179 4,179 4,179 4,179
As discussed in the text, a zero percent filter threshold setting retains only candidates with bit scores equal to the top non-self blast match. A setting
of 100% retains all matches as candidates for subsequent LPI calculations. Some columns have slightly lower total numbers due to matches with
uncultured organisms, which contain no lineage information but were not filtered out in this experiment.
R16.6 Genome Biology 2007, Volume 8, Issue 2, Article R16 Podell and Gaasterland />Genome Biology 2007, 8:R16
The probability calculation is performed twice during each
search for horizontal transfer candidates, once to obtain a set
of preliminary guide probabilities, and a second time to
obtain more refined LPI scores. Initial guide probabilities are
calculated using one sequence from each candidate match set,
selected on the basis of having the highest BLAST bit score in
the set. Once guide probabilities are established, they are
used to re-rank the members of each candidate set by lineage
probability instead of bit score, in some cases resulting in the
choice of a new top-ranking sequence. The lineage-probabil-
ity calculation is then repeated using the revised set of top-
ranking candidates as input, to obtain final LPI scores, which
range between zero and one. Additional rounds of probability
calculation and candidate selection would be possible but are
unnecessary; lineage probability scores generally change only
slightly between the preliminary guide step and final LPI
assignments.
Filter threshold optimization
Selecting a global filter threshold value of zero maximizes the
opportunity to identify horizontal transfer candidates, but
may result in false positives if sequences from closely related
organisms have BLAST scores that are slightly, but not signif-
icantly, lower than the top hit. Using a higher value for the
threshold filter, allowing a wider range of hits to be consid-
ered in the candidate set for each query, helps eliminate false
positive horizontal transfer candidates by promoting matches
from closely related species over those from more distant spe-
cies. However, as the range of acceptable scores for match
candidates is progressively broadened, sensitivity to potential
horizontal transfer events is correspondingly decreased, and
true examples of horizontal transfer may be overlooked.
The effects of filter threshold cutoff settings on phylogenetic
distribution of corrected best matches were examined in
detail for E. coli strain K12. In this example, all protein
matches to the genus Escherichia were excluded under the
user-specified definition of self. In addition, matches contain-
Table 2
Effect of filter threshold setting and LPI score ranking on eukaryotic BLAST matches to E. coli
Filter
threshold
Query id Match id LPI Percent
identity
Query
length
Align
length
e-value Bit score Match
species
Query annotation Match annotation
0.0 AAC74689 CAC43289 0.009 99 603 603 0 1261 Arabidopsi
s thaliana
Beta-glucuronidase Beta-glucuronidase
0.02 AAC74689 ZP_00698534 0.981 99 603 603 0 1255 Shigella
boydii
Beta-galactosidase/beta-
glucuronidase
0.0 AAC76624 AAM52982 0.009 99 382 382 0 741 Dunaliella
bardawil
Mannitol-1-
phosphate
dehydrogenase
Mannitol-1-phosphate
dehydrogenase
0.02 AAC76624 AAN45081.2 0.981 98 382 382 0 738 Shigella
flexneri
Mannitol-1-phosphate
dehydrogenase
0.0 AAC73440 AAU04862 0.001 96 427 425 0 830 Tamarix
chinensis
Cytosine deaminase Cytosine deaminase
0.2 AAC73440 AAV79026 0.925 81 427 420 0 706 Salmonella
enterica
Cytosine deaminase
0.0 AAC73353 AAA35359 0.088 78 155 99 7.0E-42 171 Cercopith
ecus
aethiops
CP4-6 prophage None
0.2 AAC73353 ZP_00825492 0.924 48 155 145 1.0E-36 153 Yersinia
mollaretii
Hypothetical protein
0.0 AAC75891 gi|2143952 0.108 85 458 441 0 719 Rattus
norvegicus
Predicted
transcriptional
regulator
Hepatic glutathione
transporter
0.8 AAC75891 AAD12579 0.927 28 458 403 1.0E-38 164 Salmonella
typhimurium
HilA
0.0 AAC73796 BAB33410 0.029 100 108 108 1.0E-54 213 Pisum
sativum
Predicted inner
membrane protein
Putative senescence-
associated protein
0.0 AAC74583 BAE25662 0.104 92 1325 895 0 1614 Musmuscu
lus
Predicted
lipoprotein
none
0.0 ABD18679 gi|1095170 0.108 93 234 179 3.0E-86 320 Rattus
norvegicus
Predicted protein,
amino terminal
fragment
(pseudogene)
Glutathione
transporter
Rows in bold type contain the top ranked match using a zero threshold setting. Rows in italic type show cases where using a higher filter setting
revealed an alternative match, with a higher LPI score, to the same genomic query.
Genome Biology 2007, Volume 8, Issue 2, Article R16 Podell and Gaasterland R16.7
comment reviews reports refereed researchdeposited research interactions information
Genome Biology 2007, 8:R16
ing the terms 'cloning', 'expression', 'plasmid', 'synthetic',
'vector', and 'construct' were also excluded to remove artifi-
cial sequences that might originally have been derived from
E. coli.
Table 1 summarizes the E. coli filter threshold results. BLAST
matches above the initial screening threshold were found for
4,179 (97%) of the original 4,302 genomic query sequences.
With a filter threshold cutoff of 0%, the great majority of lin-
eage-corrected best matches are closely related
Enterobacterial proteins, as expected. As the filter threshold
is progressively broadened, this number increases from
4,000 to a maximum of 4,112, reflecting the promotion of
matches from closely related species to a best candidate posi-
tion. However, some E. coli proteins had no matches to
Enterobacterial database entries, even at a filter threshold
setting of 100%, where all BLAST hits above the initial
screening minimum are considered equivalent. Matches to
these sequences are found only in phage, eukaryotes, and
more distantly related bacteria, and represent either database
errors, gene loss in all other sequenced members of this line-
age, hyper-mutated sequences unique to this strain of E. coli,
or candidates for lateral acquisition.
Table 2 shows detailed information for the eight eukaryotic
sequences initially identified as best matches to E. coli. For
each E. coli query sequence, the top hit match using a 0%
threshold is shown first (bold). The second line for the same
query (italicized) shows results at the lowest filter value
where an alternative match with a higher LPI score was
found. In five cases, increasing the filter threshold revealed
additional BLAST matches to sequences with higher LPI val-
ues, suggesting the original match might be incorrect. In
three cases, no better match was found, supporting statistical
validity of the original result.
Interpreting BLAST search results for E. coli requires caution,
because there is an especially high risk of finding matches to
contaminating cloning vector and host sequences in genomic
data for other organisms. This problem is illustrated by the
first entry in Table 2, for the E. coli beta-galactosidase protein
AAC74689, a common cloning vector component. The top
ranking match for this query at a filter value of zero is Arabi-
dopsis protein CAC43289. The BLAST alignment for this
match is excellent, with 99% identity over all 603 amino acids
of the query sequence, but application of a filter threshold set-
ting of 2% reveals another extremely good match in the data-
base, ZP_00698534 from E. coli's close relative Shigella
boydii. In the original BLAST analysis, the Shigella protein
received a bit score of 1,255, compared to 1,261 for the Arabi-
dopsis protein, even though both proteins have the same per-
cent identity and query coverage length. Clearly this
difference in bit score is insignificant, and difficult to detect
without adequate surveillance. Ranking the matches by
decreasing LPI score solves this problem; the Arabidopsis
match has an LPI score of 0.009, but the Shigella match has
an LPI score of 0.98. This example shows how a combination
of threshold range filtering and LPI score ranking can suc-
cessfully eliminate false positive artifacts due to cloning vec-
tor contamination.
Table 3
Effect of self-definition keywords on best match lineages for E. coli
Self-definition keywords
K12
83333
316407
562
Escherichia Escherichia
Shigella
Escherichia
Shigella
Salmonella
Enterobacteria 4,203 4,063 3,640 3,173
Other bacteria 34 96 346 632
Phage 1 14 55 80
Eukaryotes 0 6 12 18
Archaea0023
Total matches 4,243 4,179 4,055 3,906
LPI
max
0.993 0.984 0.950 0.918
LPI
max
matches 4,110 3,855 3,220 2,570
LPI
max
lineage Bacteria;
Proteobacteria;
Gamma-proteobacteria;
Enterobacteriales;
Enterobacteriaceae;
Escherichia
Bacteria;
Proteobacteria;
Gamma-proteobacteria;
Enterobacteriales;
Enterobacteriaceae;
Shigella
Bacteria;
Proteobacteria;
Gamma-proteobacteria;
Enterobacteriales;
Enterobacteriaceae;
Salmonella
Bacteria;
Proteobacteria;
Gamma-proteobacteria;
Enterobacteriales;
Enterobacteriaceae;
Yersinia
Filter threshold setting was 10%.
R16.8 Genome Biology 2007, Volume 8, Issue 2, Article R16 Podell and Gaasterland />Genome Biology 2007, 8:R16
The second and third queries in Table 2, for the enzymes
mannitol phosphate dehydrogenase and cytosine deaminase,
also appear to have matched inappropriate database
sequences when using a zero threshold setting. Using a filter
threshold of 20% or lower overcomes these apparent errors,
replacing them with nearly equal matches in a species closely
related to the original query organism. In contrast, the fifth
query of Table 2 (AAC75891) illustrates the danger of setting
threshold values that are too lenient. In this case, using a filter
threshold of 80%, a BLAST hit from a phylogenetically closer
organism (Salmonella) has been promoted even though it has
only 28% identity to the query, versus 85% in the original top
hit. This promotion is clearly unjustified.
For optimal DarkHorse performance, threshold values need
to be set at a level that is neither too high nor too low. The best
threshold setting for an individual query organism depends
on the abundance of closely related sequences in the database
used for BLAST searches. This value is difficult to measure
directly, but can be calibrated approximately by measuring
the maximum candidate set size returned using different
Table 4
Effect of self-definition keywords on LPI scores for individual protein examples from E. coli strain K12
Self-definition keywords
K12
83333
316407
562
Escherichia
Query ID Query annotation Query GC% Match species LPI e-value Match species LPI e-value
AAC74994 Cytoplasmic alpha-amylase 49 Escherichia coli CFT073 0.993 0 Shigella dysenteriae 0.984 0
AAC75738 Carbon source regulatory protein 49 Escherichia coli O157:H7 0.993 3e-26 Shigella flexneri 0.984 3e-25
AAC75802 Conserved hypothetical protein 43 Geobacter sulfurreducens 0.612 3e-138 Geobacter sulfurreducens 0.610 3e-138
AAC75097 UDP-galactopyranose mutase 35 Psychromonas ingrahamii 0.747 2e-149 Psychromonas ingrahamii 0.743 2e-149
AAC76015 Glycolate oxidase subunit, FAD-linked 56 Escherichia coli 53638 0.993 0 Pseudomonas syringae 0.745 0
Table 5
Effect of self-definition terms on best match lineages for A. thaliana
Self-definition keywords
Arabidopsis Arabidopsis
Oryza
Arabidopsis
Oryza
Brassica
Viridiplantae 19,229 12,078 11,658
Other Eukaryotes 583 3,122 3,191
Bacteria 162 812 850
Archaea 3 12 13
Viruses123
Total matches 19,978 16,026 15,715
LPI
max
0.907 0.671 0.670
LPI
max
matches 14,215 2,437 2,960
LPI
max
lineage Eukaryota;
Viridiplantae;
Streptophyta;
Liliopsida;
commelinids;
Poales;
Poaceae;
Ehrhartoideae;
Oryzeae;
Oryza
Eukaryota;
Viridiplantae;
Streptophyta;
rosids;
Brassicales;
Brassicaceae;
Brassica
Eukaryota;
Viridiplantae;
Streptophyta;
asterids;
Solanales;
Solanaceae;
Solanum
Filter threshold setting was 10%.
Genome Biology 2007, Volume 8, Issue 2, Article R16 Podell and Gaasterland R16.9
comment reviews reports refereed researchdeposited research interactions information
Genome Biology 2007, 8:R16
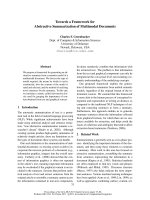
threshold settings on a genome-wide basis, as shown in Fig-
ure 2. For this data set, the original BLAST search included a
maximum possible number of 500 matches per query. Values
shown in the graph indicate the highest number of candidate
matches found for any single query in the test genome after
filtering at the indicated threshold setting.
For an organism like E. coli, with sequences available for
many closely related species, the maximum number of candi-
date set members appears to reach a plateau when using a fil-
ter threshold setting of 10% to 20%. After that point, further
broadening of the threshold compromises the effectiveness of
the filtering process. For query organisms from more sparsely
represented phylogenetic groups, such as the archaeon Ther-
moplasma acidophilum, there are very few examples of
closely related species in the database. In these cases, a lower
filter threshold cutoff value is appropriate. For some organ-
isms, it may make sense to limit the filter threshold setting to
zero, promoting only those matches whose scores are exactly
equivalent to the initial top hit.
Threshold filtering can help eliminate statistical anomalies of
BLAST scoring, but there are some types of database ambigu-
ities it cannot resolve. One such example is the sixth entry in
Table 2, a match between E. coli sequence AAC73796 and
database entry BAB33410, isolated from snow pea pods (P.
sativum). This match covers 100% of the E. coli query
sequence at 100% identity, but only 46% of the pea protein.
Sequences distantly related to the matched region exist in
several other strains of E. coli and Shigella, but were not rec-
ognized by threshold filtering because they fall below the
minimum BLAST match retention criteria. No related
sequences are found in any eukaryotes other than snow pea,
even at an e-value of 10.0. If this were a true case of horizontal
transfer, closeness of the match would imply a very recent
event, and phylogenetic distribution would suggest direction
of transfer as moving from E. coli to the seed pods of a eukary-
Table 6
Effect of filter threshold on best match lineages for T. acidophilum
Filter threshold setting
0% 2% 5% 10% 20% 40%
Picrophilus 604 658 760 852 919 976
Sulfolobus 106 104 81 76 50 40
Other Archaea 483 437 373 302 267 236
Bacteria 97 92 78 62 54 37
Eukaryotes 433356
Total matches 1,294 1,294 1,295 1,295 1,295 1,295
As in Table 1 for E. coli, a zero percent filter threshold setting retains only candidates with bit scores equal to the top non-self blast match. A setting
of 100% retains all matches as candidates for subsequent LPI calculations. Some columns have slightly lower total numbers due to matches with
uncultured organisms, which contain no lineage information but were not filtered out in this experiment.
Table 7
Effect of filter threshold setting on best match lineages for T. maritime
Filter threshold setting
0% 2% 5% 10% 20% 40%
Clostridia 627 695 799 917 1,064 1,170
Other Firmicutes 135 115 99 79 55 56
Non-Firmicutes
bacteria
458 422 364 300 229 170
Archaea 208 197 172 139 89 46
Eukaryotes 12117651
Total matches 1,440 1,440 1,441 1,441 1,442 1,443
Some columns have slightly lower total numbers due to matches with uncultured organisms, which contain no lineage information but were not
filtered out in this experiment.
R16.10 Genome Biology 2007, Volume 8, Issue 2, Article R16 Podell and Gaasterland />Genome Biology 2007, 8:R16
otic plant. But this scenario is biologically unlikely. A more
reasonable explanation is that the sequence identity is due to
an undetected artifact introduced during cloning of the pea
sequence. This sequence was obtained from a single isolated
cDNA clone, and reported in a lone, unverified literature
reference [38]. This type of error is difficult to avoid in uncu-
rated databases like GenBank nr.
Definition of database 'self' sequences
The definition of 'self' sequences for a query organism is con-
figured by a list of user-defined self-exclusion terms. These
terms, which can be either names or taxonomy ID numbers,
provide a simple way to adjust phylogenetic granularity of the
search, and to compensate for over-representation of closely
related sequences in the source database. Although the LPI
scoring method is naturally more sensitive to transfer events
between distantly related taxa than to closely related species,
adjusting breadth of the self-definition keywords for a test
organism can reveal potential horizontal transfer events that
are either very recent or progressively more distant in time. In
practice, this is accomplished by choosing a narrow initial
self-definition, then iteratively adding one or more species
with high LPI scores to the list of self-definition keywords in
the next round of analysis. Query sequences acquired since
the divergence of two related genomes can be identified by
comparing LPI scores and associated lineages plus or minus
one of the relatives as a self-exclusion term.
As an example of this process, the self definition for E. coli
strain K12 was first defined narrowly by a set of strain-specific
names and NCBI taxonomy ID numbers (K12, 83333,
316407, 562). This self-definition includes strain K12, as well
as matches where the E. coli strain is unspecified, but still
permits matches to clearly identified genomic sequences
from alternative strains, for example, O157:H7. A second self-
definition list was created using genus name Escherichia
alone, which eliminates all species and strains from this
genus. The list was then iteratively broadened by adding the
names Shigella and Salmonella. Table 3 illustrates how this
process changes the lineages of best matches chosen by
Effect of filter threshold setting on maximum number of candidate set members per queryFigure 2
Effect of filter threshold setting on maximum number of candidate set members per query.
0
100
200
300
400
500
0% 20% 40% 60% 80% 100%
Filter threshold setting
Maximum candidate set size
E. coli
T. acidophilum
Genome Biology 2007, Volume 8, Issue 2, Article R16 Podell and Gaasterland R16.11
comment reviews reports refereed researchdeposited research interactions information
Genome Biology 2007, 8:R16
DarkHorse. As the breadth of self-definition terms is
expanded, the total number of matches declines, because
fewer database proteins remain that meet minimum BLAST
requirements. As total number of Enterobacterial matches
declines, matches to other classes of bacteria increase
because they are the best remaining alternative. The maxi-
mum LPI value (LPI
max
), which is assigned to the lineage with
the greatest number of matches, becomes progressively lower
as the self-definition is expanded. The total number of
matches having this LPI
max
value also declines, and the line-
age associated with the LPI
max
becomes phylogenetically
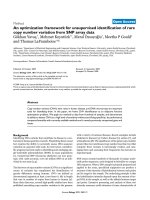
more distant from the original test genome. The histograms
in Figure 3, grouped into bins of 0.02 units, show how the
overall distribution of LPI scores changes from high to low as
the number of closely related database taxa are depleted by
broader self-definition terms. In this respect, using a coarser
set of self-exclusion terms for an abundantly represented
organism mimics the distribution of organisms that are more
sparsely represented in the database.
Table 4 illustrates how changing self-definition keywords
affects predictions of horizontal transfer for some individual
protein examples. The first two rows in Table 4 contain
sequences that are highly conserved among all strains of E.
coli, as well as many closely related species. Matches to pro-
tein AAC75738 have lower e-values than matches to
AAC74994 simply because AAC75738 is a much shorter pro-
tein (61 versus 495 amino acids). In these two rows, self-defi-
nition keywords do not affect LPI scores, which remain at
maximum for both keyword sets.
LPI scores are also unchanged by self-definition keywords for
the query sequences shown in rows 3 and 4, but for a different
reason. Both of these sequences appear likely to have been
recently acquired by E. coli strain K12, since its divergence
from other E. coli strains. The closest database alignments to
protein AAC75802 are with two species of delta-Proteobacte-
ria, Geobacter sulfurreducens and Desulfuromonas
acetoxiadans (not shown). This protein does not align well
with any other strain of E. coli, nor with any other
Enterobacterial genomes. Gene loss from such a large
number of species seems unlikely as an alternative explana-
tion to horizontal transfer.
Protein AAC75097 also appears to have been recently
acquired by strain K12. Its origin is unclear; it aligns closely
not only with a protein from Psychromonas ingrahamii,
found in polar ice, but also with multiple examples among
gamma-proteobacteria (Actinobacillus succinogenes and
Mannheimia succiniciproducens), as well as epsilon-proteo-
bacteria (Campylobacter jejuni) and eubacteria (several
Lactobacillus and Streptococcus species). These organisms
or their relatives could all potentially be found in human or
bovine gut microflora, providing ample opportunity for gene
exchange with both E. coli and each other. Differences in
nucleotide composition between the proteins in rows 3 and 4
and the consensus for E. coli strain K12 (approximately 50%
GC) also support recent lateral acquisition. Genomes from
eubacteria in the Bacillus and Lactobacillus groups typically
have a mean GC content around 35%.
The fifth row in Table 4 illustrates an example of likely hori-
zontal gene transfer that occurred less recently. Using the
narrowest set of self-definition keywords, protein AAC76015
has an LPI score of 0.993, equal to the LPI
max
, but the score
drops substantially when the self-definition is expanded to
include all species in the genus Escherichia. Closest align-
ments to this protein are found in multiple species of gamma-
proteobacteria from the Pseudomonas lineage, but not in any
other Enterobacteria besides E. coli strains K12, 536, UTI89,
and F11. The atypically high GC percentage of this E. coli
sequence is also consistent with transfer from members of
genus Pseudomonas, whose genomes typically have mean GC
contents of 60% or higher.
Table 5 illustrates a similar keyword expansion experiment
performed with Arabidopsis thaliana. Adding Oryza to the
self-definition list increases the number of bacterial matches
from 162 to 812. Of these 812 matches, 336 are to cyanobac-
Effect of expanding E. coli self definition terms on LPI score distribution histogramsFigure 3
Effect of expanding E. coli self definition terms on LPI score distribution
histograms. Filter threshold setting was 10%. (a) Self = Escherichia (b) Self =
Escherichia + Shigella + Salmonella.
(a)
0
1,000
2,000
3,000
4,000
5,000
0.00 0.20 0.40 0.60 0.80 1.00
LPI scores (binned)
Number of sequences
Shigellla
Other enterobacteria
Other gammaproteobacteria
Other proteobacteria
Other bacteria
Viruses and eukaryotes
Self = Escherichia
(b)
0
1,000
2,000
3,000
4,000
5,000
0.00 0.20 0.40 0.60 0.80 1.00
LPI scores (binned)
Number of sequences
Yersinia
Viruses and eukaryotes
Other enterobacteria
Other proteobacteria
Other bacteria
Other gammaproteobacteria
Self = Escherichia + Shigella
+ Salmonella
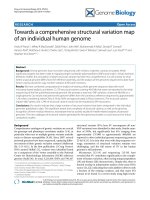
R16.12 Genome Biology 2007, Volume 8, Issue 2, Article R16 Podell and Gaasterland />Genome Biology 2007, 8:R16
terial species, perhaps reflecting historical migration of chlo-
roplast sequences derived from bacterial endosymbionts to
the plant nucleus prior to the divergence of Arabidopsis and
Oryza. The histograms in Figure 4 show how expanding the
self definition not only lowers the top LPI scores, but also
clarifies the separation of matches into three distinct groups,
representing viridiplantae (scores 0.5 to 0.7), metazoan, fun-
gal, and apicomplexan eukaryotes (scores 0.3 to 0.4), and
bacteria (scores below 0.03).
One limitation to the technique of expanding self-definition
terms is that it also reduces the total number of non-self
BLAST matches. More than 90% of the original E. coli query
sequences still have database matches above the BLAST ini-
tial screening criteria after excluding the three closest genera,
but adding just a single genus to the Arabidopsis self-defini-
tion eliminated 20% of the original matches. For phylogenetic
groups with less extensive database representation, exclusion
of too many related groups may reduce the number of
matches to a point where it is too low to reasonably represent
the test genome.
LPI score significance
The DarkHorse algorithm does not provide explicit criteria
for classifying sequences as horizontally transferred or not;
rather it ranks all candidates within a genome relative to each
other. Selecting a single absolute value as a universal cutoff
between positive and negative candidates for horizontal
transfer neither makes biological sense, nor can it be sup-
ported computationally in the absence of unambiguous,
known, and generally accepted positive and negative exam-
ples. Score distributions vary widely according to the evolu-
tionary history of a test organism, the definition of 'self'
chosen, and the number of closely related sequences in the
database that lie outside that definition of self for a particular
query.
Despite the difficulty of defining exact classification bounda-
ries, some solid general principles can be applied to interpret-
ing LPI score distributions, as illustrated by histograms of
binned data in Figures 3 to 7. Query protein sequences with
the highest LPI scores (LPI
max
) can be eliminated from con-
sideration as horizontal transfer candidates with a high
degree of confidence, because they are matched with proteins
from lineages most closely related to the query organism. By
definition, LPI scores must fall between zero and one. Within
these limits, LPI
max
values cover a fairly broad range, with
lower scores characteristic of organisms with few close rela-
tives in the database, or with self-definition settings that have
intentionally filtered out the closest relative sequences. Query
protein sequences with intermediate LPI scores may or may
not have been horizontally transferred, and will require
analysis by independent methods to classify definitively. The
number of query proteins with intermediate scores typically
decreases as more closely related genomes are added to the
underlying database. Scores at the lowest end of the LPI score
distribution represent the best candidates for horizontal
transfer, because their closest database matches belong to lin-
eages that are most distantly related to the query organism. In
Effect of expanding A. thaliana self definition terms on LPI score distribution histogramsFigure 4
Effect of expanding A. thaliana self definition terms on LPI score
distribution histograms. Filter threshold setting was 10%. (a) Self =
Arabidopsis. (b) Self = Arabidopsis + Oryza.
(a)
Self = Arabidopsis
0
4,000
8,000
12,000
16,000
20,000
0.00 0.20 0.40 0.60 0.80 1.00
LPI scores (binned)
Number of sequences
Other viridiplantae
Bacteria
Oryza
Other eukaryotes
(b)
Self = Arabidopsis + Oryza
0
4,000
8,000
12,000
0.00 0.20 0.40 0.60 0.80 1.00
LPI scores (binned)
Number of sequences
Other viridiplantae
Bacteria
Other eukaryotes
Brassica
LPI score distribution histogram for T. acidophilumFigure 5
LPI score distribution histogram for T. acidophilum. Filter threshold setting
was zero.
0
200
400
600
800
1,000
0.00 0.20 0.40 0.60 0.80 1.00
LPI scores (binned)
Number of sequences
Ferroplasma
Picrophilu
s
Other euarchaeota
sulfolobus
Bacteria
Other crenarchaeota
Genome Biology 2007, Volume 8, Issue 2, Article R16 Podell and Gaasterland R16.13
comment reviews reports refereed researchdeposited research interactions information
Genome Biology 2007, 8:R16
the most extreme cases, if the closest match falls in a different
kingdom, these sequences can have scores of 0.1 or lower.
Bacterial and Archaeal examples
Two microbial organisms previously demonstrated by multi-
ple bioinformatics methods to have high rates of horizontal
gene transfer were re-analyzed for comparison using the
DarkHorse algorithm. Euryarchaeotal species Thermo-
plasma acidophilum has been suggested to have experienced
lateral gene exchange specifically with Sulfolobus
solfataricus, a distantly related crenarchaeote that lives in the
same ecological niche [39]. The hyperthermophilic bacterium
Thermotoga maritima is believed to have undergone partic-
ularly high rates of horizontal gene exchange with archaeal
species sharing its extreme habitat [40-42]. Each of these
genomes was analyzed using its genus name as a self-exclu-
sion term, and filter threshold cutoff values ranging from 0%
to 40%.
The 1,494 predicted protein sequences of T. acidophilum had
numerous best matches to distantly related organisms,
including both Sulfolobus, as expected, and a variety of bacte-
rial species (Table 6, Figure 5; raw data in Additional data file
2). Using a filter threshold of zero, the LPI score for the Sul-
folobus lineage was 0.42, substantially below the Picrophilus
and Ferroplasma lineages, with LPI scores of 0.76 to 0.79.
The number of query proteins with best matches to Sulfolo-
bus proteins was 106, consistent with a previous study that
found 93 laterally transferred proteins agreed upon by three
different prediction methods, with an additional 90 agreed
upon by two out of the three methods [34]. In addition, Dark-
Horse analysis identified 97 query sequences most closely
matched to bacterial proteins that were not examined in pre-
vious studies. These matches included species like Thermo-
toga maritima, which may themselves have acquired
archaeal sequences from a Thermoplasma relative. This
multi-level data complexity undoubtedly contributes to the
inconsistency of horizontal transfer predictions from differ-
Table 7 and Figure 6 summarize LPI score distributions for
Thermotoga maritima (raw data provided in Additional data
file 3). Database matches scoring above the minimum BLAST
criteria were found for 1,440 (78%) of 1,846 predicted
proteins in the Thermotoga genome. With a cutoff filter value
of 0, the majority of matches, 617, were to bacteria of the Fir-
micutes/Clostridia lineage, generating LPI scores of 0.54 to
0.55 for these lineages. An LPI
max
value of 0.55 is much lower
than that observed for many other microbial genomes,
reflecting the absence of a truly close relative in the source
database. The most abundant genus in the Clostridia group
was Thermoanaerobacter, but this genus had only 265
matches. Other bacterial species from the Firmicutes lineage
had LPI scores of 0.46 to 0.50, and more distant bacterial lin-
eages had LPI scores between 0.33 and 0.41. At the lowest end
of the score distribution were 208 matches to archaeal
sequences, with LPI values of 0.1 or less. These archaeal
matches represented 11.3% of the Thermotoga genome, con-
sistent with previous reports suggesting that between 11% and
24% of proteins in this species have been laterally acquired
[1,41]. The wide variability in literature predictions for num-
bers of horizontally transferred genes reflects the difficulty of
assigning definitive classifications by any single bioinfor-
matic method. However, LPI score distributions have cap-
tured and quantified the scarcity of orthologous sequences
from closely related species in the source database, an impor-
tant factor contributing to this discrepancy.
Eukaryotic examples
The parasitic amoeba Entamoeba histolytica is believed to
have lost its mitochondria and many enzymes associated with
aerobic metabolism as an adaptation to its parasitic lifestyle
and anaerobic habitat in the human gut. At the same time,
this organism appears to have gained a set of enzymes not
found in other eukaryotes, supporting anaerobic fermenta-
tion pathways. These enzymes may have been obtained by lat-
eral gene transfer from phagocytized bacterial prey. In
support of this hypothesis, a previous study has identified 96
LPI score distribution histogram for T. maritimaFigure 6
LPI score distribution histogram for T. maritima. Filter threshold setting
was zero.
0
200
400
600
800
1,000
0.00 0.20 0.40 0.60 0.80 1.00
LPI scores (binned)
Number of sequences
Other bacteria
Archaea
Clostridia
Other firmicutes
Eukaryota
LPI score distribution histogram for E. histolyticaFigure 7
LPI score distribution histogram for E. histolytica. Filter threshold setting
was zero.
0
400
800
1,200
1,600
0.00 0.20 0.40 0.60 0.80 1.00
LPI scores (binned)
Number of equences
Other
eukaryotes
Dictyostelium
Archaea
Bacteria
R16.14 Genome Biology 2007, Volume 8, Issue 2, Article R16 Podell and Gaasterland />Genome Biology 2007, 8:R16
genes considered most likely to have been laterally acquired,
using a combination of automated and manual phylogenetic
methods [43].
To compare DarkHorse predictions with those obtained by
other methods, the E. histolytica genome was analyzed using
the genus name as a self-definition, and filter threshold set-
tings of 0% to 40%. Out of 9,775 predicted protein sequences,
only 3,573 (37%) had matches above the minimum BLAST
criteria, reflecting the scarcity of database sequence relatives.
The maximum number of best matches to a single query rose
abruptly from 33 to 497 when raising the threshold filter set-
ting from 0% to 2%. These results suggest that database cov-
erage for this organism is so sparse that filter settings higher
than zero, shown in Table 8, are probably too lenient.
The LPI score distribution for E. histolytica is divided into
several distinct phylogenetic clusters (Figure 7; raw data in
Additional data file 4). The low LPI
max
value of 0.56, associ-
ated with 694 matches to genus Dictyostelium, confirms the
scarcity of related species in the database. Best matches with
LPI scores between 0.3 and 0.5 were associated with a wide
diversity of other eukaryotic organisms, including plants, ani-
mals, and fungi as well as protozoa. The bacterial cluster of
best matches had LPI scores between 0.04 and 0.07, and
archaeal best matches had scores below 0.02. Previous work
did not distinguish between archaeal and bacterial matches in
E. histolytica, but grouped them all together among the 96
predicted lateral transfer candidates. Finding the archaeal
sequence matches is particularly interesting, because they
represent potential evidence supporting the theory of
archaeal contributions to virulence in bacterial human path-
ogens [10].
Using a zero filter threshold cutoff, DarkHorse found non-
eukaryotic best matches for 86 of the 96 E. histolytica genes
previously identified as lateral transfer candidates. Of the ten
differences, four were due to revisions in E. histolytica gene
models - the older predicted Entamoeba sequences are no
longer present in the current GenBank version of the genome.
One disagreement occurred because the bacterial match pro-
posed by Loftus et al. did not pass the initial DarkHorse
BLAST pre-screening criteria for orthology, with an align-
ment length covering less than 60% of the query sequence
[43]. One of the remaining five differences was found by
DarkHorse to have a best match in Mastigamoeba
balamuthi, and the remaining four to proteins in Dictyostel-
ium discoideum. These are both amoeboid species represent-
ing close database relatives of E. histolytica. If these five E.
histolytica sequences were laterally acquired, it must have
been prior to evolutionary divergence from other eukaryotic
ameboid species. It is possible that the Dictyostelium and
Mastigamoeba sequence matches missed by previous analy-
sis were not yet available at the time the work was done,
therefore representing false positives. If so, this highlights the
importance of re-analyzing phylogenetic data as new
sequences for relatives of the query organism become
available.
The most abundant bacterial and archaeal matches in the E.
histolytica genome were to species known to inhabit the
human digestive tract, including oral pathogen Tannerella
forsythensis (45 matches), gut symbiont Bacteroides
thetaiotaomicron (21 matches), and archaea from the genus
Methanosarcina (40 matches). All 45 T. forsythensis
matches point to a single bacterial cell surface-associated pro-
tein, BspA, previously shown to mediate dose-dependent
binding to the human extracellular matrix components
fibronectin and fibrinogen [44]. Sixteen best matches in
Methanosarcina point to archaeal relatives of this same pro-
tein. Interestingly, there were no DarkHorse best matches to
T. forsythensis or BspA in the genome of Dictyostelium dis-
coideum, and only five matches to B. thetaiotaomicron and
three to Methanosarcina.
The true biological relationships involved in E. histolytica
gene evolution are quite complex, probably including multi-
ple horizontal transfer events between eukaryotes, archaea,
and bacteria that may themselves contain previously acquired
archaeal sequences. Using a filter threshold setting of zero,
DarkHorse identified an additional 60 archaeal and 350 bac-
terial best matches that were not described in the original E.
Table 8
Effect of filter threshold setting on best match lineages for E. histolytica
Filter threshold setting
0% 2% 5% 10% 20% 40%
Dictyostelium 694 831 1,096 1,485 1,901 2,083
Other Eukaryotes 2,353 2,236 2,011 1,682 1,347 1,267
Bacteria 433 431 413 377 308 213
Archaea 726150352211
Total matches 3,552 3,559 3,570 3,579 3,578 3,574
Some columns have slightly lower total numbers due to matches with uncultured organisms, which contain no lineage information but were not
filtered out in this experiment.
Genome Biology 2007, Volume 8, Issue 2, Article R16 Podell and Gaasterland R16.15
comment reviews reports refereed researchdeposited research interactions information
Genome Biology 2007, 8:R16
histolytica genome paper. The most likely reason for this dis-
crepancy is sub-optimal sensitivity of Pyphy [33], the auto-
mated phylogenetic tree building software used by Loftus et
al., when dealing with complex data sets [43]. The Pyphy tree-
building parameters were originally designed to find simple
paralogous sequence relationships between closely related
clades. Lower than expected Pyphy sensitivity has been
described by other authors attempting to use it for horizontal
gene transfer analysis across wide phylogenetic distances
[34].
Discussion
The algorithm presented here combines sequence alignment,
database mining, statistical, and linguistic analysis tools in a
single unified application. It compensates for differences in
protein conservation by using BLAST scores in a relative,
rather than an absolute context, with uniquely determined
criteria for each genomic protein being tested. BLAST scores
are used to define a set of candidate matches for each test pro-
tein, which are then ranked using a second, independent
method, based on lineage frequency of matches over the
entire genome. The power of the algorithm resides in its abil-
ity to integrate sequence alignments for individual proteins
with phylogenetic statistics for an entire genome into a single
quantitative metric, the LPI score, in a computationally effi-
cient manner.
Sensitivity can be adjusted by restricting or broadening a fil-
ter threshold setting for candidate matches to compensate for
differences in database representation of closely related
organisms or for taxon-specific variability in mutation rates,
which can mask horizontal transfer events or cause false pos-
itives. The method can be tuned to detect broader or narrower
phylogenetic distance, as well as earlier versus more recent
historical events, by expanding or contracting initial terms
used for definition of 'self'. This flexibility facilitates adapta-
tion of the program to a variety of different research goals,
asking different kinds of questions.
The DarkHorse algorithm incorporates consensus knowledge
of lineage relationships previously established from other,
independent sources. The price for incorporating this infor-
mation is a crucial dependence on the availability, quality,
and timely updates of underlying sequence and taxonomy
databases. All phylogenetic methods share this same depend-
ence, although it is often unrecognized. One advantage of the
DarkHorse method is that it combines the statistical power of
thousands of database comparisons with a weighting scheme
that maximizes the contribution of the broadest, most well-
established classifications, and minimizes potential artifacts
arising from fine-grained details that may be controversial or
incorrect. This strategy provides a robust calculation of global
lineage probabilities over an organism's entire genome, even
in the presence of minor database errors for individual
sequences or species. It can also be useful in identifying data-
base mistakes that need to be corrected, as shown by the vec-
tor contamination examples in Table 2.
Some phylogenetic groups that undoubtedly participate in
horizontal transfer, especially bacteriophages and other
viruses, are not yet associated with sufficient taxonomy infor-
mation to allow lineage analysis. False positive predictions of
horizontal transfer may occur in cases of insufficient database
coverage, where related species that contain orthologous pro-
teins exist in real life, but are not included in the database at
the time of analysis. Loss of individual genes in closely related
species is also a potential problem, although mitigated by the
thoroughness of the DarkHorse search algorithm, which
incorporates data from all entries for all taxa in the database
for every protein query.
By design, the LPI ranking system is less sensitive to transfer
between closely related organisms than more distant ones,
and does not attempt to establish directionality of lateral
transfer events. Ranking of horizontal transfer candidates in
a genome is relative; no absolute cutoff thresholds for classi-
fication can be computationally justified in the absence of
unambiguous, known, and generally accepted positive and
negative examples. For these reasons, subsequent validation
of horizontal transfer candidates by alternative methods is
essential to ensure accuracy of final determinations.
The biology of lateral transfer between genomes is emerging
as a highly complex process, with little or no opportunity to
perform experimental validation of bioinformatic predic-
tions. Addressing this complexity effectively requires the
power of combining multiple analytical approaches. The tool-
box of every researcher needs to include reliable methods for
constructing phylogenetic trees at widely varying distances,
identifying and comparing genomic signatures, determining
gene location synteny between closely related species, and
defining the environmental conditions and lifestyle
opportunities that might allow lateral transfer to occur
between individual organisms.
The DarkHorse algorithm makes some unique contributions
to the researcher's toolbox that are not provided by other
techniques. LPI score distributions capture an important,
potentially confounding piece of information that is neither
collected nor recognized by other analytical methods, namely
quantifying the density of current database coverage for
potential relative organisms as a source of protein orthologs.
The exceptionally rapid processing, screening and ranking of
very large phylogenetic data sets in an automated manner
makes it practical to analyze eukaryotic, as well as microbial
genomes, and to perform repeated analyses as external data-
bases are updated. Output from the program can then be used
to select and prioritize candidates for follow-up with more
detailed, sophisticated methods that would be too time con-
suming to apply to whole genomes on an ongoing, repeated
basis. Finally, the DarkHorse program provides an exhaustive
R16.16 Genome Biology 2007, Volume 8, Issue 2, Article R16 Podell and Gaasterland />Genome Biology 2007, 8:R16
search function that can be used to identify orthologs from
other species that may have been omitted or unknown at the
time of previous analyses. This application permits quality
assurance testing to be performed retrospectively on previous
studies using any and all other predictive methods to ensure
that their conclusions still remain valid after the expansion of
our knowledge by the addition of new sequence data.
Materials and methods
Genomes and databases
Predicted protein sequences for test genomes were down-
loaded from the NCBI GenBank genome website [45], with
the exception of D. discoideum, which was downloaded from
dictyBase [46] and A. thaliana, which was downloaded from
the TIGR Arabidopsis thaliana Database [47]. GenBank pro-
tein sequences and their associated species information (the
nr and taxdb databases) were obtained from the NCBI BLAST
database [48]. NCBI taxonomy database tables were down-
loaded from the NCBI taxonomy database [49].
Software
BLAST searches were performed using either the DeCypher
Tera-BLAST™ (TimeLogic, Inc. Carlsbad, California, USA) or
NCBI BLAST program. Species names associated with BLAST
matches were retrieved using the fastacmd module of the
NCBI BLAST program. NCBI taxonomy data tables were
entered into a local installation of the MySQL relational data-
base program using a custom perl script. Lineages were
retrieved for individual species using a recursive perl script
that traversed the taxonomy tree through the database to its
root level, producing output similar to lineage information
available through the NCBI taxonomy website. Software to
perform lineage probability index (LPI) calculations has been
implemented as a perl-scripted pipeline for the UNIX operat-
ing system, with links to local hardware-accelerated BLAST
search software and local MySQL databases. A more general-
ized integrated software interface is under development.
Computing resources
The rate-limiting step for the current procedure is a BLAST
search of all predicted proteins from a test genome against the
GenBank nr protein sequence database, collecting as many as
500 hits per query sequence. This step was performed using a
DeCypher hardware-accelerated Tera-BLAST™ system, but
could also be done using a multiprocessor cluster, or any
other hardware configuration capable of acceptable BLAST
performance with large data sets. With the DeCypher system,
typical BLAST search times for a test set of 5,000 predicted
proteins against the GenBank nr database (currently 3.5 mil-
lion sequences) were around 30 minutes. The remainder of
the analysis can typically be completed in 10 to 60 minutes,
depending on genome size, using a single CPU on a Sun V440
Unix workstation (1.3 GHz, 16 GB RAM). This stage requires
no special hardware; most of the time is spent on SQL query
retrieval from the MySQL relational database.
Calculation of lineage probabilities
The main steps of the overall algorithm are summarized in
Figure 1, and described in the Results sections called 'Algo-
rithm overview' and 'Selection and ranking of candidate
match sets'. The steps used to calculate normalized, weighted,
lineage probabilities are the same for both preliminary guide
probabilities and final LPI scores. These steps are described
in detail below, using the contents of Table 9 as an example.
Step 1
Determine the average hierarchical position of each lineage
term. The numbers start at one, ordered from left to right, so
that the most general term has the lowest number, and the
most specific term has the highest number. In the Table 9
examples, the terms 'Bacteria', 'Eukaryota' and 'Viruses' are
assigned to position one, 'Actinobacteria', 'Cyanobacteria',
'Dictyosteliida', 'Myxogastromycetidae' and 'Caudovirales'
are assigned to position two, and so forth.
Step 2
Count the total number of entries for each hierarchical posi-
tion in the whole set. Positions 1 to 3 in this example each con-
tain six entries, because all six sequences on the list have at
least three terms. Position 4 contains only three entries (from
sequences number 2, 3 and 5), and position 5 contains only
one entry ('Nostoc', from sequence 2).
Step 3
Determine the frequency (number of occurrences) for each
individual term in the whole set. In this example, the term
'Bacteria' has a frequency of 3, 'Eukaryota' and 'Cyanobacte-
Table 9
Examples of NCBI taxonomy lineages
Species Number of terms Lineage
Symbiobacterium thermophilum 3 Bacteria;Actinobacteria;Symbiobacterium
Nostoc punctiforme 5 Bacteria;Cyanobacteria;Nostocales;Nostocaceae;Nostoc
Trichodesmium erythraeum 4 Bacteria;Cyanobacteria;Oscillatoriales;Trichodesmium
Dictyostelium discoideum 3 Eukaryota;Dictyosteliida;Dictyostelium
Physarum polycephalum 4 Eukaryota;Myxogastromycetidae;Physariida;Physarum
Enterobacteria phage P1 3 Viruses;Caudovirales;Myoviridae
Genome Biology 2007, Volume 8, Issue 2, Article R16 Podell and Gaasterland R16.17
comment reviews reports refereed researchdeposited research interactions information
Genome Biology 2007, 8:R16
ria' each has a frequency of 2, and all of the other terms have
a frequency of 1.
Step 4
Calculate raw probability by dividing term frequency by the
total number of entries for the term's hierarchical position.
The maximum possible probability for each lineage term is,
therefore, 1.0. In this example, the raw probability for the
term 'Bacteria' is 3/6 (0.5). 'Eukaryota' and 'Cyanobacteria'
both have a raw probability of 2/6 (0.33), and 'Viruses' has a
raw probability of 1/6 (0.17). However, the term 'Nosto-
caceae' has a raw probability of 1/3 (0.33), because there are
only three possible terms at position 4.
Step 5
Divide each term's raw probability by its hierarchical position
to give a weighted probability value. This gives the highest
weight to the most general terms. In this example, the term
'Eukaryota' receives a weighted probability of 0.33/1 (0.33),
but the weighted probability of 'Cyanobacteria' is only 0.33/2
(0.16), because it is in the second hierarchical position.
Step 6
For each unique lineage, add together the weighted probabil-
ities of all component terms to calculate a composite proba-
bility. The composite probabilities of each of the example
lineages are as follows:
0.50 + 0.08 + 0.06 = 0.64
0.50 + 0.16 + 0.06 + 0.08 + 0.20 = 1.00
0.50 + 0.16 + 0.06 + 0.08 = 0.80
0.33 + 0.08 + 0.06 = 0.47
0.33 + 0.08 + 0.06 + 0.08 = 0.55
0.22 + 0.08 + 0.06 = 0.36
Step 7
To account for lineages that have different numbers of terms,
divide each composite probability by a length normalization
factor, equal to the sum of reciprocal values for the number of
composite terms it contains. As an example, for lineages with
three terms, the length normalization factor is 1/1 + 1/2 + 1/3
= 1.83, so the final LPI score for lineage number 1 will be
0.64/1.83 = 0.35. For lineages with five terms, the length
normalization factor is 1/1 + 1/2 + 1/3 + 1/4 + 1/5 = 2.28, so
the final LPI score for lineage number 2 is 1.00/2.28 = 0.44.
For a small minority of data points, species and/or lineage
information may be absent from the database. These protein
matches are excluded from lineage probability calculations,
since they are not informative. In practice, these sequences
will often be annotated as 'uncultured bacterium' or 'cloning
vector'. These entries are flagged and saved to a log file, allow-
ing the user to decide whether the taxonomy database needs
to be updated to a newer version, or the entries are insignifi-
cant and can be added to the automatic exclusion list. Final
output is formatted as a tab-delimited file containing the fol-
lowing information: query id, total number of BLAST hits,
number of non-self BLAST hits, number of candidate
matches, initial tophit id, corrected best hit id, LPI score,
percent identity of the BLAST match, query sequence length,
alignment length, alignment coverage, e-value, bit score, tax-
onomy id, species, lineage, query annotation, and best match
annotation.
User-adjustable parameters
Initial BLAST screening parameters against the sequence
source database were chosen broadly, using an e-value cutoff
of 1e-05 or better, with at least 60% of query length covered
by the BLAST alignment. These parameters may be adjusted
if desired by the user; they serve merely as a pre-filter to
remove matches of obvious low quality. The maximum
number of saved alignments per query was 500 sequences for
the analyses presented here, but this number may need to be
increased for very large genomes.
Additional data files
The following additional data are available with the online
version of this paper. Additional data file 1 contains tab-
delimited raw output from DarkHorse analysis of E. coli
strain K12, with a filter threshold setting of 10% and self def-
inition set as 'Escherichia'. Additional data file 2 contains tab-
delimited raw output for Thermoplasma acidophilum, with a
filter threshold setting of zero and self definition set as 'Ther-
moplasma'. Additional data file 3 contains tab-delimited raw
output for Thermotoga maritima, with a filter threshold set-
ting of zero and self definition set as 'Thermotoga'. Additional
data file 4 contains tab-delimited raw output for Entamoeba
histolytica, with a filter threshold setting of zero and self def-
inition set as 'Entamoeba'.
Additional data file 1Tab-delimited raw output from DarkHorse analysis of E. coli strain K12The filter threshold setting was 10% and self definition was set as 'Escherichia'.Click here for fileAdditional data file 2Tab-delimited raw output for Thermoplasma acidophilumThe filter threshold setting was zero and self definition was set as 'Thermoplasma'.Click here for fileAdditional data file 3Tab-delimited raw output for Thermotoga maritimaThe filter threshold setting was zero and self definition was set as 'Thermotoga'.Click here for fileAdditional data file 4Tab-delimited raw output for Entamoeba histolyticaThe filter threshold setting was zero and self definition was set as 'Entamoeba'.Click here for file
Acknowledgements
This study was funded by a grant to the Scripps Genome Center from the
Rancho Santa Fe Foundation, created by Louis Simpson, as well as National
Science Foundation grant number EF-0412090. The authors would like to
thank Nicola Vitulo for assistance in implementing a local version of the
NCBI taxonomy database, and Eric Allen, Russell Doolittle, and Lee Edsall
for critical reading of the manuscript and helpful comments.
References
1. Koonin EV, Makarova KS, Aravind L: Horizontal gene transfer in
prokaryotes: quantification and classification. Annu Rev
Microbiol 2001, 55:709-742.
2. Lawrence JG, Ochman H: Reconciling the many faces of lateral
gene transfer. Trends Microbiol 2002, 10:1-4.
3. Andersson JO: Lateral gene transfer in eukaryotes. Cell Mol Life
Sci 2005, 62:1182-1197.
4. Gogarten JP, Townsend JP: Horizontal gene transfer, genome
innovation and evolution. Nat Rev Microbiol 2005, 3:679-687.
R16.18 Genome Biology 2007, Volume 8, Issue 2, Article R16 Podell and Gaasterland />Genome Biology 2007, 8:R16
5. Bapteste E, Susko E, Leigh J, MacLeod D, Charlebois RL, Doolittle
WF: Do orthologous gene phylogenies really support tree-
thinking? BMC Evol Biol 2005, 5:33.
6. Embley TM, Martin W: Eukaryotic evolution, changes and
challenges. Nature 2006, 440:623-630.
7. Ochman H, Lerat E, Daubin V: Examining bacterial species
under the specter of gene transfer and exchange. Proc Natl
Acad Sci USA 2005, 102(Suppl 1):6595-6599.
8. Gevers D, Cohan FM, Lawrence JG, Spratt BG, Coenye T, Feil EJ,
Stackebrandt E, Van de Peer Y, Vandamme P, Thompson FL, Swings J:
Opinion: re-evaluating prokaryotic species. Nat Rev Microbiol
2005, 3:733-739.
9. Ge F, Wang LS, Kim J: The cobweb of life revealed by genome-
scale estimates of horizontal gene transfer. PLoS Biol 2005,
3:e316.
10. Gophna U, Charlebois RL, Doolittle WF: Have archaeal genes
contributed to bacterial virulence? Trends Microbiol 2004,
12:213-219.
11. Faguy DM: Lateral gene transfer (LGT) between Archaea and
Escherichia coli is a contributor to the emergence of novel
infectious disease. BMC Infect Dis 2003, 3:13.
12. Ragan MA, Harlow TJ, Beiko RG: Do different surrogate meth-
ods detect lateral genetic transfer events of different relative
ages? Trends Microbiol 2006, 14:4-8.
13. Sharp PM, Li WH: The codon Adaptation Index - a measure of
directional synonymous codon usage bias, and its potential
applications. Nucleic Acids Res 1987, 15:1281-1295.
14. Lawrence JG, Ochman H: Amelioration of bacterial genomes:
rates of change and exchange. J Mol Evol 1997, 44:
383-397.
15. Garcia-Vallve S, Guzman E, Montero MA, Romeu A: HGT-DB: a
database of putative horizontally transferred genes in
prokaryotic complete genomes. Nucleic Acids Res 2003,
31:187-189.
16. Dalevi D, Dubhashi D, Hermansson M: Bayesian classifiers for
detecting HGT using fixed and variable order Markov mod-
els of genomic signatures. Bioinformatics 2006, 22:517-522.
17. Waack S, Keller O, Asper R, Brodag T, Damm C, Fricke WF, Surovcik
K, Meinicke P, Merkl R: Score-based prediction of genomic
islands in prokaryotic genomes using hidden Markov models.
BMC Bioinformatics 2006, 7:142.
18. Saunders NJ, Boonmee P, Peden JF, Jarvis SA: Inter-species hori-
zontal transfer resulting in core-genome and niche-adaptive
variation within Helicobacter pylori. BMC Genomics 2005, 6:9.
19. Tsirigos A, Rigoutsos I: A sensitive, support-vector-machine
method for the detection of horizontal gene transfers in
viral, archaeal and bacterial genomes. Nucleic Acids Res 2005,
33:3699-3707.
20. Koski LB, Morton RA, Golding GB: Codon bias and base compo-
sition are poor indicators of horizontally transferred genes.
Mol Biol Evol 2001, 18:404-412.
21. Wang B: Limitations of compositional approach to identifying
horizontally transferred genes. J Mol Evol 2001, 53:244-250.
22. Gophna U, Charlebois RL, Doolittle WF: Ancient lateral gene
transfer in the evolution of Bdellovibrio bacteriovorus. Trends
Microbiol 2006, 14:64-69.
23. Ortutay C, Gaspari Z, Toth G, Jager E, Vida G, Orosz L, Vellai T: Spe-
ciation in Chlamydia : genomewide phylogenetic analyses
identified a reliable set of acquired genes. J Mol Evol 2003,
57:672-680.
24. Guindon S, Perriere G: Intragenomic base content variation is
a potential source of biases when searching for horizontally
transferred genes. Mol Biol Evol 2001, 18:1838-1840.
25. Tsirigos A, Rigoutsos I: A new computational method for the
detection of horizontal gene transfer events.
Nucleic Acids Res
2005, 33:922-933.
26. Martin W: Gene transfer from organelles to the nucleus: fre-
quent and in big chunks. Proc Natl Acad Sci USA 2003,
100:8612-8614.
27. Santos SR, Ochman H: Identification and phylogenetic sorting
of bacterial lineages with universally conserved genes and
proteins. Environ Microbiol 2004, 6:754-759.
28. Clarke GD, Beiko RG, Ragan MA, Charlebois RL: Inferring genome
trees by using a filter to eliminate phylogenetically discord-
ant sequences and a distance matrix based on mean normal-
ized BLASTP scores. J Bacteriol 2002, 184:2072-2080.
29. Lyubetsky VA, V'Yugin VV: Methods of horizontal gene transfer
determination using phylogenetic data. In Silico Biol 2003,
3:17-31.
30. MacLeod D, Charlebois RL, Doolittle F, Bapteste E: Deduction of
probable events of lateral gene transfer through comparison
of phylogenetic trees by recursive consolidation and
rearrangement. BMC Evol Biol 2005, 5:27.
31. Zhaxybayeva O, Gogarten JP: An improved probability mapping
approach to assess genome mosaicism. BMC Genomics 2003,
4:37.
32. Daubin V, Ochman H: Quartet mapping and the extent of lat-
eral transfer in bacterial genomes. Mol Biol Evol 2004, 21:86-89.
33. Sicheritz-Ponten T, Andersson SG: A phylogenomic approach to
microbial evolution. Nucleic Acids Res 2001, 29:545-552.
34. Frickey T, Lupas AN: PhyloGenie: automated phylome genera-
tion and analysis. Nucleic Acids Res 2004, 32:5231-5238.
35. Huang J, Mullapudi N, Sicheritz-Ponten T, Kissinger JC: A first
glimpse into the pattern and scale of gene transfer in Api-
complexa. Int J Parasitol 2004,
34:265-274.
36. Koski LB, Golding GB: The closest BLAST hit is often not the
nearest neighbor. J Mol Evol 2001, 52:540-542.
37. Eisen JA: Horizontal gene transfer among microbial genomes:
new insights from complete genome analysis. Curr Opin Genet
Dev 2000, 10:606-611.
38. Pariasca JAT, Sunaga A, Miyazaki T, Hisaka H, Sonoda M, Nakagawa
H, Sato T: Cloning of cDNAs encoding senescence-associated
genes, ACC synthase and ACC oxidase from stored snow
pea pods (Pisum sativum L. var saccharatum) and their
expression during pod storage. Postharvest Biol Technol 2001,
22:191-290.
39. Ruepp A, Graml W, Santos-Martinez ML, Koretke KK, Volker C,
Mewes HW, Frishman D, Stocker S, Lupas AN, Baumeister W: The
genome sequence of the thermoacidophilic scavenger Ther-
moplasma acidophilum. Nature 2000, 407:508-513.
40. Mongodin EF, Hance IR, Deboy RT, Gill SR, Daugherty S, Huber R,
Fraser CM, Stetter K, Nelson KE: Gene transfer and genome
plasticity in Thermotoga maritima, a model hyperther-
mophilic species. J Bacteriol 2005, 187:4935-4944.
41. Nelson KE, Clayton RA, Gill SR, Gwinn ML, Dodson RJ, Haft DH,
Hickey EK, Peterson JD, Nelson WC, Ketchum KA, et al.: Evidence
for lateral gene transfer between Archaea and bacteria from
genome sequence of Thermotoga maritima. Nature 1999,
399:323-329.
42. Nesbo CL, L'Haridon S, Stetter KO, Doolittle WF: Phylogenetic
analyses of two 'archaeal' genes in thermotoga maritima
reveal multiple transfers between archaea and bacteria. Mol
Biol Evol 2001, 18:362-375.
43. Loftus B, Anderson I, Davies R, Alsmark UC, Samuelson J, Amedeo P,
Roncaglia P, Berriman M, Hirt RP, Mann BJ, et al.: The genome of
the protist parasite Entamoeba histolytica. Nature 2005,
433:865-868.
44. Sharma A, Sojar HT, Glurich I, Honma K, Kuramitsu HK, Genco RJ:
Cloning, expression, and sequencing of a cell surface antigen
containing a leucine-rich repeat motif from Bacteroides for-
sythus ATCC 43037. Infect Immun 1998, 66:5703-5710.
45. NCBI GenBank Genomes [ />genomes/]
46. dictyBase [ />blast_databases.pl]
47. The TIGR Arabidopsis thaliana Database [ />tdb/e2k1/ath1/]
48. NCBI BLAST Database [ />49. NCBI Taxonomy Database [ />