Báo cáo sinh học: "Genetic evaluation of horses based on ranks in competitions" potx
Bạn đang xem bản rút gọn của tài liệu. Xem và tải ngay bản đầy đủ của tài liệu tại đây (914.54 KB, 15 trang )
Original
article
Genetic
evaluation
of
horses
based
on
ranks
in
competitions
A
Tavernier
Institut
National
de la
Recherche
Agronomique,
Station
de
Génétique
Quantitative
et
Appliquée,
Centre
de
Recherches
de
Jouy-en-Josas,
7835!
Jouy-en-Josas
Cedex,
France
(Received
14
October
1988;
accepted
9
January
1991)
Summary -
A
method
is
presented
for
analysing
horse
performance
recorded
as
a
series
of
ranks
obtained
in
races
or
competitions.
The
model
is
based
on
the
assumption
of
the
existence
of
an
underlying
normal
variable.
Then
the
rank
of
an
animal
is
merely
the
phenotypic
expression
of
the
value
of
this
underlying
variable
relative
to
that
of
the
other
horses
entering
the
same
competition.
The
breeding
values
of
the
animals
are
estimated
as
the
mode
of
the
a
posteriori
density
of
the
data
in
a
Bayesian
context.
Calculation
of
this
mode
entails
solving
a
non-linear
system
by
iteration.
An
example
involving
the
results
of
races
of
2 .yr-old
French
trotters
in
1986
is
given.
Practical
computing
methods
are
presented
and
discussed.
horse
/
ranking
/
order
statistics
/
Bayesian
methods
Résumé -
Évaluation
génétique
des
chevaux
à
partir
de
leurs
classements
en
compéti-
tion.
Cet
article
présente
une
méthode
d’analyse
de
performances
enregistrées
sous
la
forme
de
classements
obtenus
dans
des
confrontations
restreintes
et
variables
(courses
ou
concours).
Le
modèle
postule
d’existence
d’une
variable
normale
sous-jacente.
Le
classe-
ment
d’un
cheval
est
alors
simplement
d’expression
phénotypique
de
la
valeur de
cette
va-
riable
sous-jacente
relativement
à
celles
des
autres
animaux
participant
à
la
même
épreuve.
Les
valeurs
génétiques
des
animaux
sont
estimées
à
partir
du
mode
de
la
densité
a
poste-
riori
des
données
dans
un
contexte
bayésien.
Le
calcul
de
ce
mode
amène
ic
la
résolution
d’un
système
non
linéaire
par
itérations.
Un
exemple
d’application
est
réalisé
sur
les
résul-
tats
des
courses
des
chevaux
Trotteurs
Français
de
2 ans
en
1986.
Des
méthodes
de
calculs
pratiques
sont
proposées
et
discutées.
cheval
/
classement
/
statistiques
d’ordre
/
méthodes
bayésiennes
INTRODUCTION
Choosing
a
good
selection
criterion
is
one
of the
major
problems
in
genetic
evaluation
of
horses.
The
breeding
objective
is
the
ability
to
succeed
in
riding
competitions
(jumping,
dressage,
3-day-event)
or
in
races
(trot
and
gallop).
But
how
should
success
be
measured?
The
"career"
of
a
horse
is
made
up
of
a
series
of
ranks
obtained
in
races
or
competitions.
A
"physical"
measure
of
performance
is
not
always
available.
Such
a
measure
might
be
racing
time
for
races
or
number
of faults
for
riding
competitions.
These
data
are
not
always
collected
and,
furthermore,
they
may
give
a
poor
indication
of
the
real
level
of
the
performance:
a
racing
horse
must
be
fast
but
it
must,
above
all,
adapt
to
particular
conditions
prevailing
in
each
event.
This
may
explain
the
relatively
low
heritability
of
time
performance
of
thoroughbreds
(Hintz,
1980;
Langlois,
1980a).
In
the
case
of
riding
horses,
it
is
difficult
to
assess
the
technical
level
of
a
jumping
event.
It
depends
not
only
on
the
height
of
the
obstacles
but,
to
a
greater
extent,
on
the
difficulties
encountered
when
approaching
the
obstacles
and
on
the
distance
between
obstacles.
None
of
these
variables
can
be
easily
quantified.
Therefore,
information
provided
by
the
ranking
of
horses
in
each
event
deserves
attention.
Ranking
allows
horses
entering
the
same
event
to
be
compared
to
the
others.
However,
the
level
of
the
event
has
to
be
determined
too.
The
most
frequently
used
criterion
related
to
ranking
is
transformed
earnings.
Each
horse
that
is
&dquo;placed&dquo;
in
an
event,
ie,
ranked
among
the
first
ones,
receives
a
certain
amount
of
money.
Prize-money
in
a
race
is
allocated
in
an
exponential
way:
for
instance,
the
second
horse
earns
half
the
amount
given
to
the
first,
the
third
half
of
that
given
to
the
second
and
so
on
If
the
rate
of
decrease
is
not
50%,
it
often
equals
a
fixed
percentage,
for
instance
75%
in
horse
shows.
The
earnings
of
a
horse
in
a
race
can
then
be
expressed
as
G
=
ax( k-
l
) D
with
a
being
the
proportion
of
the
total
endowment
given
to
the
winner
(constant),
x
being
the
rate
of
decrease
of
earning
with
rank
(constant),
k
the
rank
of
the
horse
in
the
race
and
D
the
total
endowment
of the
race.
The
constants
a
and
x
must
satisfy
(axK-1-!+(1-a)
=
0)
with K
the
total
number
of
horses
&dquo;placed&dquo;.
So,
a
logarithmic
transformation
gives
Log(G)
=
Log(a)
+
Log(D)
+
(k -
1)
Log(x).
This
is
a
linear
function
of
the
rank
of
the
horse.
To
use
it
as
a
function
of
the
ability
of
the
horse,
Log(D)
should
be
assumed
to
be
a
linear
function
of
the
level
of
the
race.
The
total
amount
of
money
given
in
a
race
or
a
competition
should
depend
on
the
technical
difficulty
or
the
level
of
the
competitors.
Hence,
with
adequate
competition
programmes
(Langlois,
1983),
the
logarithm
of
earnings
of
a
horse
may
be
a
good
scale
for
measuring
horse
performance
and
it
has
been
widely
used
(Langlois,
1980b,
1989;
Meinardus
and
Bruns,
1987;
Tavernier,
1988,
1989;
Arnason
et
al,
1989;
Klemetsdal,
1989;
Minkema,
1989).
However,
this
criterion
strongly
depends
on
the
way
money
is
distributed.
The
choice
of
the
amount
of
money
given
in
jumping
competitions
does
not
follow
strict
technical
rules
in
France
and
does
not
directly
depend
on
the
scale
of
technical
difficulties
but
on
the
choice
of
the
organizing
committee.
Therefore,
it
appears
that
ranks
should
be
taken
into
account
without
reference
to
earnings.
The
purpose
of
this
article
is
to
present
a
method
for
estimating
the
breeding
value
of
an
animal
using
a
series
of
ranks
obtained
in
events
where
it
competed
against
a
sample
of
the
population.
In
order
to
interpret
these
data,
the
notion
of
underlying
variable
will
be
used
as
in
Gianola
and
Foulley
(1983)
for
estimation
of
breeding
value
with
categorical
data,
and
in
Henery
(1981)
for
constructing
the
likelihood
of
outcomes
of
a
race.
The
horse’s
&dquo;real&dquo;
performance,
which
cannot
be
measured,
is
viewed
as
a
normal
variable;
this
is
a
reasonable
assumption
for
traits
with
polygenic
determination.
Only
the
location
or
ranking
of
this
performance
relative
to
those
of
the
other
horses
entering
the
same
event
is
observed.
Although
this
model
is
applied
to
horses,
it
can
be
extended
to
any
situation
where
a
rank
is
recorded
instead
of
a
performance.
Practical
computational
aspects
as
well
as
an
application
to
trotters
are
presented.
METHOD
Data
The
data
(Y)
consist
of
the
ranks
of
all
the
animals
in
all
the
events.
The
total
number
of
observations
is
therefore
equal
to
the
sum
of
the
number
of
animals
per
event.
It
is
assumed
that
the
ranks
are
related
to
an
underlying
unobserved
continuous
variable.
The
rank
depends
on
the
realized
value
of
this
underlying
unobserved
variable
(&dquo;real&dquo;
animal
performance)
relative
to
that
of
the
other
animals
entering
the
same
event.
The
genetic
model
is
the
same
as
for
usual
traits
with
polygenic
determinism.
The
underlying
performance
y
jk
follows
a
normal
distribution
with
residual
standard
deviation
(F
e
and
expected
value
!,2!.
The
model
is:
where:
- y2!! _
&dquo;real&dquo;
performance
of
horse j
under
environmental
conditions
i
in
the
kth
race
of
j;
-
bi
= environmental
effect
i (eg
age,
sex,
rider );
-
uj
= additive
breeding
value
of
horse
j;
-
pj
= environmental
effect
common
to
the
different
performances
of
horse
j,
as
it
may
participate
in
several
events;
-
eij
k
=
residual
effect
in
kth
race.
The
vector
of
parameters
to
be
estimated
is
0
=
(b’,
u’,
p’)
where
b
=
{b
i
},
u
=
(uj )
and
p
=
{
Pj}.
Inference
is
based
on
Bayes
theorem.
Since
the
marginal
density
of
Y
does
not
vary
with
0:
where
pee)
is
the
prior
density
of
0,
g(Y/6)
is
the
likelihood
function
and
f (9/Y)
is
the
posterior
density
of
the
parameters.
Prior
density
The
vectors
b,
u,
p
and
e
are
assumed
to
be
mutually
independent
and
to
follow
the
normal
distributions:
N(13,
V),
N(O,
G),
N(O,
H),
N(O,
R),
respectively.
Prior
information
about
b
is
assumed
to
be
vague,
which
implies
that
the
diagonals
of
V
tend
to
+
00
.
Then,
the
prior
density
of
b
is
uniform
and
the
posterior
density
of
e
does
not
depend
on
!3 !
G
=
Ao,’
where
A
is
the
relationship
matrix and
0
-;
is
the
additive
genetic
variance.
H
is
a
diagonal
matrix
with
diagonal
elements
equal
to
the
variance
of
p
(u p 2).
The
variances
0
-;
and
a
P2
are
assumed
to
be
known,
0
-;
is
chosen
to
be
equal
to
1,
and
R
is
an
identity
matrix.
Then:
Likelihood
function
Given
ai,
the
performances
y2!!
are
conditionally
independent.
Let
y(
l
),
!(2), ,
Yen)
be
the
ordered
underlying
performances
of
the
n
horses
which
competed
in
an
event
(for
notation,
see
for
example
David,
1981,
p
4).
Then,
the
likelihood
of
obtaining
the
observed
ranking
in
that
event
can
be
written
as
(Henery,
1981;
Dansie,
1986):
where:
- y
is
the
standard
normal
density.
-
J1(t)
is
the
location
parameter
of
the
horse
ranked
&dquo;t&dquo;
in
that
event.
This
probability
can
be
interpreted
in
the
following
way:
the
performance
of
the
last
animal
may
vary
between
-oo
and
+
00
,
the
performance
of
the
next
to
last
varies
from
that
of
the
last
to
+oo
and
so
on.
Thus,
the
performance
of
a
horse
varies
from
that
of
the
horse
ranked
just
behind
it
to
+
00
,
hence
leading
to
the
bounds
of
each
integral
in
Pk.
Each
integration
variable
(t)
follows
a
normal
distribution
with
mean
J1(
t)
and
standard
deviation
ue
=
1.
Given
1L
(t
),
these
distributions
are
independent
for
all
animals
in
the
same
competition.
This
probability
may
be
expressed
in
terms
of
a
multivariate
normal
integral
with
thresholds
independent
of
integration
variables
(Godwin,
1949;
David,
1981):
where
the
distribution
of
(xl, , !t, , !n-1 )
is
normal
with
mean
(
/1
(1)
-
!(2!, ,
,!(t) -
/1(t+1) ,
,/1(n-1) -
/t(
n
))
and
variance
V
=
{vml
}
with
Vmm
=
2,
Vm,m-1
=
vm,
m+1
=
-1
and
all
other
Vml
=
0.
Then:
Results
of
races
are
likely
to
be
correlated.
However,
if
the
model
is
appropriate,
this
correlation
would
depend
only
on
genetic
or
environmental
effects
ie
given
the
J.L
ij’
S,
the
races
are
independent.
The
likelihood
function
is
equal
to
the
product
of
the
probabilities
of
each
event:
where
m
is
the
total
number
of
races.
Estimation
of
parameters
The
posterior
density
of
the
parameters
is:
The
best
selection
criterion
is
known
to
be
the
mean
of
the
posterior
distribution
(Fernando
and
Gianola,
1984;
Gof&net
and
Elsen,
1984).
As
expressing
it
analyti-
cally
is
not
possible
for
the
model
used
here,
we
will
take
as
estimator
of
0
the
mode
of
the
posterior
distribution,
which
can
be
viewed
as
an
approximation
to
the
optimum
selection
criterion.
Finding
this
mode
is
computationaly
equivalent
to
the
maximisation
of
a
joint
probability
mass
density
function
as
calculated
by
Harville
and
Mee
(1984)
for
categorical
data
(Foulley,
1987).
It
is
more
convenient
to
use
the
logarithm
of
the
posterior
density:
/C=1
where
m
is
the
number
of
events.
The
system
which
satisfies
the
first-order
condition
is
not
linear
and
must
be
solved
iteratively,
for
example
using
a
Newton-Raphson
type
algorithm.
This
algorithm
iterates
with:
where
9
is
the
solution
for
0
at
the
qth
round
of
iteration
and
AM
= 9!q!-e!q 1!.
Iterations
are
stopped
when
a
convergence
criterion,
a
function
of
0,
is
less
than
an
arbitrarily
small
number.
The
first
and
second
derivatives
of
L(O)
with
respect
to
b,
u,
p
are
reported
in
Appendix
1.
The
system
can
be
written
in
the
following
way:
m
where
A,
B, C,
D
are
sub-matrices
of
minus
the
second
derivatives
of
L
Log(P
k)
k=l
m
with
respect
to
0
and
w,
z
are
the
vectors
of
first
derivatives
of
E
Log(P,!)
with
k=l
respect
to
0,
excluding
variance
matrices.
The
numerical
solution
of
system
(I)
raises
the
problem
of
the
calculation
of
the
corresponding
integrals.
Multivariate
normal
integrals
may
be
calculated
with
numerical
methods
such
as’that
of
Dutt
(1973),
described
and
programmed
by
Ducrocq
and
Colleau
(1986).
A
second
method
consists
of
using
a
Taylor’s
series
expansion
about
zero
which
seems
to
give
good
results
(Henery,
1981;
Dansie,
1986;
Pettitt,
1982).
This
requires
that
animals
participating
in
a
given
event
have
relatively
close
means
It
ij
,
which
is
a
reasonable
assumption
in
the
present
context
of
horse
competitions.
This
expansion
involves
moments
of
normal
order
statistics,
as
explained
in
Appendix
2.
Example
In
order
to
illustrate
these
computations,
a
simple
example
was
constructed.
This
example
involves
5
unrelated
horses.
There
are
no
fixed
effects,
hence a
=
(u
+
p)
is
estimated.
The
variance-covariance
matrix
of p
is
diagonal
with
each
term
being
9/11.
Two
races
with
4
runners
are
considered.
The
first
gave
the
following
ranking:
No
1,
No
2,
No
3,
No
4
and
the
second:
No
3,
No
2,
No
5,
No
4.
The
starting
value
for
all
A
’s
was
0.
The
system
to
be
solved
at
the
first
iteration
of
the
Newton-Raphson
algorithms
as
well
as
the
corresponding
solution
are
the
following:
The
algorithm
converged
at
the
5th
iteration:
(A’ A )°.
5
=
6
x
10-
17
.
The
correspon-
ding
values
as
well
as
the
solutions
and
the
coefficient
of
determination
(CD)
with
CD
=
(1 —
ciilo, u 2)
where
c
2i
is
the
diagonal
element
of
the
inverse
of
the
matrix
of
second
derivatives
of
the
logarithm
of
posterior
density
are:
- - - - - - . -
- - - -
- - -
-
solution:
[
Al
p2
P3
!4
P5]
=
[0.621
0.237
0.271 - 0.902 -
0.226]
accuracy:
[0.242
0.434
0.404
0.348
0.293]
It
should
be
noted
that
the
value
of
the
first
derivative
for
a
horse
in
a
given
race
is
equal
to
the
expectation
of
the
normal
order
statistic
(normal
score)
corresponding
to
its
rank.
Similarly,
second
derivatives
for
a
given
race
are
functions
of
the
variance
of,
and
covariances
between,
normal
order
statistics.
This
is
the
logical
consequence
of
the
choice
of
0
for
JL
as
starting
value:
all
distributions
of
performances
are
the
same
with
a
mean
of
0
and
all
integrals
correspond
to
expectations
of
normal
order
statistics.
The
accumulated
values
for
all
races
are
the
sum
of
these.
At
convergence,
these
values
have
changed
and
the
final
solution
differs
from
the
estimates
obtained
from
the
expectation
of
normal
order
statistics.
The
interpreta-
tion
of
a
rank
depends
not
only
on
the
number
of
competitors,
which
is
taken
into
account
through
the
normal
order
statistics,
but
also
on
the
level
of
the
competi-
tion.
At
convergence,
the
first
derivative
of
the
log
of
a
posteriori
density
is
set
to
0.
So,
estimates
of
horses
are
equal
to
the
first
derivatives
of
the
log
of
likelihood
function
divided
by
the
variance
term.
These
derivatives
are
different
for
the
same
rank
in
different
races.
They
depend
on
the
level
of
the
race
estimated
a
posteriori
by
the
estimates
of
the
horses
participating
this
particular
race,
taking
into
account
all
races.
In
the
example,
for
the
winners
of
the
2
races,
the
first
derivatives
of
the
likelihood
function
were
much
lower
than
the
expected
values
of
order
statistics.
This
is
because
the
competitors
of
these
races
have
much
lower
estimates
than
the
winners:
0.237,
0.271,
-0.902
for
horses
No
2,
No
3
and
No
4
against
0.621
for
horse
No
1
winner
of
the
first
race
and
0.237, 0.226,
-0.902
for
horses
No
2,
No
5
and
No
4
against
0.271
for
horse
No
3
winner
of
the
second
race.
Therefore,
the
first
race
for
No
1
and
the
second
race
for
No
3
was
easier
than
if
they
had
competed
against
3
horses
of
equal
ability
to
themselves,
ie
with
the
same
ui,
as
implied
with
the
normal
order
statistics.
The
values
of
the
first
derivatives
were
0.7589
and
0.8475,
respectively,
compared
to
1.0294
for
the
expectation
of
the
normal
order
statistics
of
the
first
out
of
4.
In
the
same
way,
in
the
first
race,
horse
No
3
(0.27)
was
beaten
by
a
horse
of
lesser
ability
(No
2
(0.24)),
and,
therefore
was
more
penalized
than
if
it
had
been
defeated
by
a
horse
of
equal
ability.
The
first
derivative
was
-0.5165,
compared
to
-0.2970
for
the
expectation
of
the
normal
order
statistics
of
the
third
out
of
4.
APPLICATION
Data
This
method
was
used
to
analyse
performances
of
2-yr-old
French
Trotters
racing
in
1986.
These
horses
entered
a
series
of
races
reserved
to
their
age
class
and
all
horses
in
these
races
were
recorded
in
the
file.
Ten
races
(38
horses)
were
discarded
because
they
involved
only
horses that
did
not
compete
more
than
once,
and
which,
therefore,
were
totally
disconnected
from
the
rest
of
the
file.
We
had
to
limit
the
analysis
to
&dquo;placed&dquo;
horses
in
each
race,
ie,
horses
ranked
among
the
best
4
or
5,
because
the
ranking
of
other
participants
were
not
available.
This
does
not
prevent
us
from
testing
and
comparing
our
method
to
usual
earning
criteria
assuming
that
these
races
involved
only
4
or
5
horses.
Indeed,
this
is
neccessary
for
a
fair
comparison
since
earnings
also
involve
only
&dquo;placed&dquo;
horses.
With
our
approach,
&dquo;non
placed&dquo;
horses
could,
of
course,
be
treated
as
the
others
provided
that
they
are
filed.
The
data
set
was
made
up
of
251
races
(211
with
4
horses
ranked
and
40
with
5
horses
ranked),
involving
490
different
horses.
The
total
number
of
performances
was
1044
places,
ie
2.1
per
horse
on
average,
with
a
maximum
of
9
and
a
minimum
of
1. A
horse
competed
against
3.3
horses
on
average.
The
model
used
was:
where:
-
y!! _
&dquo;real&dquo;
performance
of
horse j
in
the
kth
race
of
j;
-
uj
= additive
breeding
value
of
horse
j;
-
p! =
environmental
effect
common
to
the
different
performances
of
horse
j;
-
e
jk
= residual
effect
in
kth
race
about
&dquo;expected&dquo;
performance
lLj
.
No
fixed
effect
was
considered
because
particular
conditions
of
each
race
(dis-
tance,
type
of
ground,
season )
are
the
same
for
all
horses
in
the
race
and
so
have
no
effect
on
the
result
and
because
trainer
and
driver
effects
cannot
be
used
on
a
small
data
set
(only
one
horse
for
the
majority
of
trainers
or
drivers).
The
expectations
and
variance-covariance
matrices
are:
where h
2
=
0
,2/
U2
is
the
heritability
and
r
=
(
U2
+
a;)/a;
is
the
repeatability
of
the
trait.
Values
of
h2
=
0.25
and
r
=
0.45
were
chosen
as
they
correspond
to
usual
estimates
of these
parameters
obtained
from
competitions.
RESULTS
The
elements
of
system
(I)
were
recalculated
at
each
Newton-Raphson
iteration
with
Dutt’s
!1973)
method
for
integrals.
Convergence
was
reached
after
5
iterations
(with
(ð.’ ð.) .
5
/490
=
2
x
10-
15).
The
accuracies
of
these
solutions
were
measured
by
coefficient
of
determination
(CD).
If
c
ii
is
a
diagonal
element
of
the
matrix
of
second
derivatives,
CD
=
(1 -
c
ii/
ou
).
Breeding
value
estimates
had
a
mean
of
0,
a
standard
deviation
of
0.30,
with
a
maximum
of
0.94
and
a
minimum
of
-0.82.
The
mean
accuracy
was
0.23,
with
a
standard
deviation
of
0.08,
a
maximum
of
0.43
and
a
minimum
of
0.12.
These
values
were
compared
to
criteria
usually
employed
in
trotters
(Thery,
1981;
Langlois,
1984).
The
correlations
with
yearly
earning
criteria
were
high:
0.73
with
Log(yearly
earning),
0.88
with
Log(yearly
earning
per
&dquo;place&dquo;),
0.79
with
Log(yearly
earning
per
start).
The
correlation
with
a
selection
index
using
as
performance
the
mean
of
the
logarithm
of
earnings
in
each
race
(with
parameter
values
h2
=
0.25
and
r =
0.45)
was
0.94.
Correlations
with
criteria
related
to
racing
time
were
lower,
as
were
correlations
between
earnings
and
racing
time.
The
correlation
was
-0.43
between
our
estimate
and
the
best
time
per
kilometer
and
- 0.47
between
our
criterion
and
a
selection
index
using
as
performance
the
average
racing
time
(with
parameter
values
h2
=
0.25
and
r
=
0.45).
These
figures
also
suggest
that
the
best
racing
time
is
not
a
good
measure
of
success
in
a
race
for
2-yr-old
horses.
This
application
suggests
some
peculiarities
of
our
method.
The
first
one
relates
to
the
spread
of
accuracy
values.
These
depend
not
only
on
the
number
of
&dquo;places&dquo;
but
also
on
the
&dquo;place&dquo;
of
the
horse
in
the
race.
Accuracies
ranged
from
0.25
to
0.33
and
from
0.20
to
0.28
for
horses
having
3
and
2
&dquo;places&dquo;,
respectively.
The
minimal
accuracy
corresponding
to
a
single
&dquo;place&dquo;
(0.12)
was
smaller
than
the
heritability
(0.25).
This
is
the
result
of
the
loss
of
information
because
ranks
are
used
instead
of
continuous
performances.
The
average
&dquo;loss&dquo;
of
accuracy
ranged
from
0.10
points
for
horses
ranked
once
to
0.05
for
those
ranked
more
than
7
times.
The
second
point
of
interest
is
the
relative
importance
of
the
number
of
horses
per
event
and
the
level
of
the
horses
participating
in
the
event.
At
convergence,
the
first
derivative
of
the
logarithm
of
posterior
density
is
equal
to
0,
so
estimates
are
equal
to
the
part
of
the
first
derivative
without
variance
terms
divided
by
these
variance
terms
(see
Appendix
I).
When
all
horses
participating
in
an
event
are
of
the
same
level
(ie,
have
the
same
real
racing
ability)
this
derivative
is
equal
to
expectations
of
normal
statistics.
These
expectations
depend
only
on
the
number
of
animals
per
event.
In
our
method
the
first
derivative
also
depends
on
the
real
racing
abilities
of
the
competitors.
So
the
same
rank
in
different
events
does
not
give
the
same
derivative.
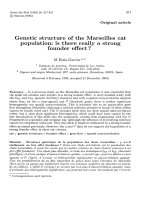
Figure
1
shows
the
distribution
of
the
derivatives
in
all
the
races
with
5
horses
&dquo;placed&dquo;
for
the
different
ranks.
For
a
given
rank,
these
derivatives
are
different
in
each
race
and
so,
being
first
in
a
race
sometimes
gives
a
lower
estimate
than
being
second
in
a
race
of
a
higher
level.
Our
method
can
be
used
as
a
tool
to
improve
the
correspondence
between
the
level
of
the
race
and
the
prize
money
to
be
distributed.
The
average
competitive
&dquo;level&dquo;
of
the
race
can
be
approximated
as
the
mean
of
the
estimates
of
real
producing
ability
(
Jij
)
of
each
horse.
In
practice,
the
correlation
between
such
a
measure
and
the
logarithm
of
total
endowment
of
the
race
was
0.30
for
races
with
4
horses
&dquo;place&dquo;,
and
0.65
for
races
with
5
&dquo;placed&dquo;.
Races
with
5
horses
&dquo;placed&dquo;
have
the
greatest
prize-money,
and
endowment
seemed
to be
a
good
indicator
of
the
value
of
participating
horses.
It
is
also
possible
to
calculate
a
posteriori
the
probabilities
of
obtaining
the
observed
ranking
in
each
race -
or
even
of
fictitious
races -
using
the
estimates
for
each
horse.
These
probabilities
were
directly
calculated
from
the
formula
for
Pk
and
do
not
take
into
account
the
accuracy
of
the
estimates.
The
average
probability
of
obtaining
the
observed
ranks
was
11%
and
3%
in
races
with
4
and
5
horses,
respectively.
If
all
horses
had
the
same
real
producing
ability,
this
probability
would
be
4%
in
races
with
4
horses
(24
possibilities)
and
0.8%
in
races
with
5
horses
(120
possibilities).
DISCUSSION
In
the
light
of
the
results
obtained
with
2-yr-old
trotters,
the
proposed
method
seemed
satisfactory:
the
estimated
values
are
consistent
with
other
criteria.
In
practice,
solving
a
much
larger
system
of
equations
presents
difficulties.
Two
numerical
problems
arise,
namely
the
calculation
of
the
integrals
P!
and
their
derivatives
and
the
dimensions
of
the
whole
system.
Two
methods
for
computing
the
necessary
integrals
have
been
suggested,
the
first
being
a
numerical
calculation
of multivariate
normal
integrals
and
the
second
an
approximation
by
Taylor’s
series.
Beyond
certain
dimensions,
it
takes
a
very
long
time
to
compute
multiple
integrals
of
the
normal
distribution.
For
each
iteration
of
Newton-Raphson
and
for
each
race
of
n
horses,
it
is
necessary
to
calculate
one
integral
of
order
(n -
1),
n
integrals
of
order
(n -
2)
and
[n(n
+
1)/2!
integrals
of
order
(n -
3).
Therefore,
the
time
needed
to
accomplish
this
becomes
prohibitive
for
a
number
of
horses
per
race
>
5
or
6.
On
the
other
hand,
our
purpose
is
to
be
able
to
apply
this
technique
to
all
types
of
horse
competitions
(for
example
show
jumping)
that
sometimes
involve
more
than
100
participants.
Then,
it
is
necessary
to
turn
to
approximations
like
those
proposed
by Henery
(1981)
using
Taylor’s
series.
The
accuracy
of
these
approximations
is
difficult
to
test.
In
particular,
approximate
formulae
for
the
moments
of
order
statistics
superior
to
2
(Pearson
and
Hartley,
1972;
David
and
Johnson,
1954)
need to
be
tested
and
compared
to
integral
calculations
of
high
order.
Such
an
approximation
reduces
calculation
times
considerably.
The
moments
of
order
statistics
not
given
in
tables
can
be
calculated
once
and
for
all.
Then,
each
derivative
only
consists
of
a
linear
combination
of
the
producing
abilities
of
the
horses
of
the
race.
The
overall
dimension
of
the
system
constitutes
a
second
problem.
Using
an
animal
model
with
repeated
records,
this
dimension
is
equal
to
the
number
of
horses
to
be
evaluated
plus
the
number
of
performing
horses
and
fixed
effects.
At
the
present
time,
in
France,
100 000
horses
are
evaluated
in
jumping
with
an
animal
model
(BLUP
method)
based
on
yearly
earnings
and
70 000
are
evaluated
in
trotting-races
(Tavernier,
198(,)b,
1990).
For
each
Newton-Raphson
iteration
of
the
proposed
method,
an
iterative
solution
such
as
Gauss-Seidel
will
be
needed.
This
method
has
been
developed
to
include
all
horses
in
every
race
including
&dquo;non-placed&dquo;
horses.
However,
they
will
have
to
be
treated
in
a
slightly
different
manner:
the
purpose
is
to
consider
the
horses
&dquo;placed&dquo;
as
better
than
the
&dquo;non-
placed&dquo;,
but
detailed
ranking
of
&dquo;non-placed&dquo;
horses
is
of
little
interest.
The
competitor
which
no
longer
has
a
chance
of
finishing
&dquo;placed&dquo;
is
not
going
to
try
to
improve
its
rank
and,
therefore,
its
rank
relative
to
the
other
&dquo;non-placed&dquo;
horses
does
not
accurately
reflect
its
real
ability.
Therefore
the
&dquo;non-placed&dquo;
should
be
treated
as
having
a
performance
below
that
of
the
last
&dquo;placed&dquo;.
Then,
the
likelihood
of
the
outcome
of
a
race
can
be
written
as:
where
there
are
n’
horses
in
the
race
and
n
horses
&dquo;placed&dquo;.
This
integral
can
be
used
in
this
form
or
equivalently
as
the
sum
of
all
the
integrals
over
all
possible
rank
combinations
between
&dquo;non-placed&dquo;
horses,
which
allows
a
simplified
application
of
the
calculation
by
Taylor’s
approximation.
Another
difficulty
is
the
estimation
of
the
genetic
parameters.
The
estimation
of
variance
components
could
probably
be
made
using
a
marginal
maximum
likelihood
approach
which
requires
the
inversion
of
the
matrix
of
second
derivatives,
as
discussed
by
Gianola
et al
(1986)
and
applied
by
Foulley
et
al
(1987a,
b).
In
practice,
this
method
can
be
applied
only
on
a
reduced
data
file
or
with
a
&dquo;sire&dquo;
model.
The
heritability
of
a
single
performance
is
lower
than
that
of
yearly
earning
criteria.
Yearly
criteria
are
compound
functions
of
the
number
of
events
and
of
success
in
each
event.
For
instance,
for
single
performance,
Meinardus
and
Bruns
(1987)
reported h
2
=
0.18
and
r
=
0.48
for
the
logarithm
of
earnings
in
jumping
shows,
Klemetsdal
(1989)
reported
h2
=
0.18
and
r
=
0.65
for
time
in
trotting-races,
Thery
(1981)
found
h2
=
0.23
and
r
=
0.52
for
the
same
criterion
and
hz
=
0.07
and
r
=
0.13
for
the
logarithm
of
earnings.
However,
the
number
of
elementary
performances
during
the
lifetime
of
a
horse
is
sufficient
to
expect
good
accuracies
of
estimations.
Taking
the
previous
examples
and
a
number
of
yearly
starts
equal
to
12
(the
average
number
of
yearly
starts
for
an
adult
horse
is
12
in
trotting-races
and
14
in
riding
competitions),
the
accuracies
of
breeding
value
estimation
ranged
from
0.27
to
0.41
after
one
year
of
performance.
With
a
loss
of
0.10
point
due
to
the
use
of
ranks,
accuracies
of
evaluations
based
on
ranks
would
range
from
0.17
to
0.31,
which
is
reasonable.
This
model
requires
a
sufficiently
large
amount
of
comparisons
between
horses
to
allow
a
proper
classification.
The
presence
of
isolated
events
which
do
not
overlap
with
others
hinders
any
relative
estimation.
The
method
does
not
avoid
the
necessity
of
good
connections
between
races,
which
is
the
only
guarantee
of
a
reliable
result.
CONCLUSION
This
article
describes
a
method
of
evaluation
of
the
breeding
value
of
an
animal
from
its
rank
relative
to
those
of
other
competitors
in
a
given
event,
without
using
a
direct
measure
of
performance.
It
is
interesting
that
the
method
suggests
a
solution
based
on
a
conventional
genetic
model.
It
can
be
applied
to
an
&dquo;individual
animal&dquo;
model
as
well
as
to
a
&dquo;sire&dquo;
model.
It
takes
into
account
the
level
of
the
competition
which
is
the
main
factor
influencing
a
rank’s
value,
together
with
the
number
of
participants
in
the
event.
Although
use
of
ranks
may
seem
to
lead
to
a
loss
of
information
compared
to
a
physical
measure,
it
is
sometimes
more
reliable.
In
the
case
of
horse
races,
ranking
is
absolutely
necessary
as
a
real
physical
measure
is
not
identifiable.
It
may
also
be
useful
in
the
case
of
a
distorted
scale
of
measure
or
when
the
usual
physical
measure
is
nothing
but
the
transcription
of
a
rank.
REFERENCES
Arnason
T,
Bendroth
M,
Phillipsson
J,
Henriksson
K,
Darenius
A
(1989)
Genetic
evaluation
of
Swedish
trotters.
In:
State
of
Breeding
Evaluation
in
Trotters.
EAAP
Publ
No
42,
Pudoc,
Wageningen,
106-130
Dansie
BR
(1986)
Normal
order
statistics
as
permutation
probability
models. Appl
Statist
35,
269-275
David
FN,
Johnson
NL
(1954)
Statistical
treatment
of
censored
data.
I.
Fundamen-
tal
formulae.
Biometrika
41,
228-240
David
HA
(1981)
Order
Statistics.
Wiley,
NY,
2nd
edn,
p
360
Ducrocq
V,
Colleau
JJ
(1986)
Interest
in
quantitative
genetics
of Dutt’s
and
Deak’s
methods
for
numerical
computation
of
multivariate
normal
probability
integrals.
Genet
Sel
Evol 18,
447-474
Dutt
JE
(1973)
A
representation
of
multivariate
probability
integrals
by
integral
transforms.
Biometrika
60,
637-645
Fernando
RL,
Gianola
D
(1984)
Optimal
properties
of
the
conditional
mean
as
a
selection
criterion.
J Anim
Sci
59
(suppl),
177
(abstr)
Foulley
JL
(1987)
Methodes
d’Evaluation
des
Reproducteurs
pour
des
Caractères
Discrets
a
Determinisme
Podygenique
en
Selection
Animale.
These
d’6tat,
Univer-
site
de
Paris-Sud,
Centre
d’Orsay,
pp
320
Foulley
JL,
Gianola
D,
Planchenault
D
(1987a)
Sire
evaluation
with
uncertain
paternity.
Genet
Sel
Evod 19,
83-102
Foulley
JL,
Im
S,
Gianola
D,
Hoschele
I
(1987b)
Empirical
Bayes
estimation
of
parameters
for
n
polygenic
binary
traits.
Genet
Sel
Evod 19,
197-204
Gianola
D,
Foulley
JL
(1983)
Sire
evaluation
for
ordered
categorical
data
with
a
threshold
model.
Genet
Sel
Evol 15,
201-224
Gianola
D,
Foulley
JL,
Fernando
RL
(1986)
Prediction
of
breeding
values
when
variances
are
not
known.
Genet
Sel
Evod
18,
485-498
Godwin
HJ
(1949)
Some
low
moments
of
order
statistics. Ann
Math
Statist
20,
279-285
Goffinet
B,
Elsen
JM
(1984)
Critbre
optimal
de
selection:
quelques
r6sultats
g6n6raux.
G6n6t
Sel
Evol 16,
307-318
Harville
DA,
Mee
RW
(1984)
A
mixed
model
procedure
for
analyzing
ordered
categorical
data.
Biometrics
40,
393-408
Henery
RJ
(1981)
Permutation
probabilities
as
models
for
horse
races.
JR
Statist
Soc
43,
86-91
Hintz
RL
(1980)
Genetics
of
performance
in
the
horse.
J
Anirrc
Sci
51,
582-594
Klemetsdal
G
(1989)
Norwegian
trotter
breeding
and
estimation
of
breeding
values.
In:
State
of
Breeding
Evaluation
in
Trotters.
EAAP
Publication
No
42,
Pudoc,
Wageningen,
95-105
Langlois
B
(1980a)
Heritability
of
racing
ability
in
thoroughbreds.
A
review.
Livest
Prod
Sci
7,
591-605
Langlois
B
(1980b)
Estimation
de
la
valeur
g6n6tique
des
chevaux
de
sport
d’apr6s
les
sommes
gagn6es
dans
les
competitions
6questres
frangaises.
Ann
Ggn!t
Sel
Anim
12,
15-31
Langlois
B
(1983)
Quelques
reflexions
au
sujet
de
l’utilisation
des
gains
pour
appr6cier
les
performances
des
chevaux
trotteurs.
34th
Ann
Meet
EAAP,
Madrid,
Spain,
October
3-6,
1983,
Study
Commission
on
Horse
Production
Langlois
B
(1984)
H6ritabilit6
et
correlations
g6n6tiques
des
temps
records
et
des
gains
établis
par
les
Trotteurs
Fran!ais
de
2
a
6
ans.
35th
Ann
Meet
EAAP,
The
Hague,
The
Netherlands,
August
6-9, 1984,
Study
Commission
on
Horse
Production
Langlois
B
(1989)
Breeding
evaluation
of
French
trotters
according
to
their
race
earnings.
I.
Present
situation.
In:
State
of
Breeding
Evaluation
in
Trotters.
EAAP.
Publication
No
42,
Pudoc,
Wageningen,
27-40
Meinardus
H,
Bruns
E
(1987)
BLUP
procedure
in
riding
horses
based
on
compe-
tition
results.
38th
Ann
Meet
EAAP,
Lisbon,
Portugal,
September
28-October
1,
1987,
Study
Commission
on
Horse
Production
Minkema
D
(1989)
Breeding
value
estimation
of
trotters
in
the
Netherlands.
In:
State
of
Breeding
Evaluation
in
Trotters.
EAAP
Publication
No
42,
Pudoc,
Wageningen,
82-94.
Pearson
ES,
Hartley
HO
(1972)
Biometrika
Tables
for
Statisticians.
Cambridge
University
Press,
vol
2,
27-35
Pettitt
AN
(1982)
Inference
for
the
linear
model
using
a
likelihood
based
on
ranks.
JR
Statist
Soc
44,
234-243
Tavernier
A
(1988)
Advantages
of
BLUP
animal
model
for
breeding
value
estima-
tion
in
horses.
Livest
Prod
Sci
20,
149-160
Tavernier
A
(1989)
Breeding
evaluation
of
French
trotters
according
to
their
race
earnings.
II.
Prospects.
In:
State
of
Breeding
Evaluation
in
Trotters.
EAAP
Publication
No
42,
Pudoc,
Wageningen,
41-54
Tavernier
A
(1989b)
Caract6risation
de
la
population
Trotteur
Frangais
d’apr6s
leur
estimation
g6n6tique
par
un
BLUP
modèle
animal.
Ann
Zootech
38,
145-155
Tavernier
A
(1990)
Caract6risation
des
chevaux
de
concours
hippique
fran!ais
d’apr6s
leur
estimation
g6n6tique
par
un
BLUP
modèle
animal.
Ann
Zootech
39,
27-44
Thery
C
(1981)
Analyse
g6n6tique
et
statistique
des
performances
des
Trotteurs
Fran!ais
en
courses
en
1979
et
1980.
M6moire
de
Dipl6me
d’Etudes
Approfondies
de
G6n6tique
Quantitative
et
Appliqu6e,
Universite
Paris
XI,
pp
80
APPENDIX
1
Calculation
of
the
first
and
second
derivatives
of
the
logarithm
of
the
a
posteriori
density
Let
y(
l
),
Y(2), ,Y(n)
be
the
ordered
underlying
performances
of
the
n
horses
which
have
participated
in
race
k
(see,
for
example,
David,
1981,
p
4).
Further,
let
Q(t),k, R(t)(t),k, R(t)(z),k
be:
We
have:
where:
-
(k,
(t))
E j
indicates
the
set
of
events k
in
which
the
animal j
competed
and
obtained
the
rank
t;
-
!G-1!!
indicates
the
row
corresponding
to
animal j
in
inverse
of
G.
where:
-
(t)
E
i indicates
the
horses
ranked
at
the
place
t
in
the
event
k
and
with
associated
fixed
effect
i
and,
if
the
horses j
and
have
participated
in
the
same
event:
I I
_
!-
The
second
derivatives
with
respect
to
u
and
p,
or
p
and
p
are
built
in
the
same
way.
The
only
value
that
changes
is
the
covariance
which
is
equal
to
0
between
u
p
and
is
equal
to
1/(J!
on
the
diagonal
of
the
second
derivatives
with
respect
to
p
and
p.
p
where:
-
!i(t)
=
0
if
fixed
effect
i does
not
influence
the
horse
ranked
t
-
!i(t) =
1
if
fixed
effect
i influences
the
horse
ranked
t
APPENDIX
2
Approximation
of
first
and
second
derivatives
of
log
of
the
a
posteriori
density
using
Taylor’s
series
expansion
These
expansions
are
drawn
from
those
used
by
Henery
(1981)
and
Dansie
(1986)
who
approximate
the
probability
Pk.
An
example
of these
decompositions
is
given
for
(Q!t!,K/P!;):
where,
for
n
independent
normal
distributions:
-
e
t:n
:
expectation
of
the
tth
order
statistic
-
o-
tt:, :
variance
of
the
tth
order
statistic
-
<!tp:n :
covariance
between
the
tth
order
statistic
and
the
pth
order
statistic
-
Pt
p
z:n
:
moment
of
order
3
between
the
tth,
pth
and
the
zth
order
statistics.