Báo cáo y học: "Identification of motifs that function in the splicing of non-canonical introns" doc
Bạn đang xem bản rút gọn của tài liệu. Xem và tải ngay bản đầy đủ của tài liệu tại đây (1.23 MB, 17 trang )
Genome Biology 2008, 9:R97
Open Access
2008Murrayet al.Volume 9, Issue 6, Article R97
Research
Identification of motifs that function in the splicing of non-canonical
introns
Jill I Murray, Rodger B Voelker, Kristy L Henscheid, M Bryan Warf and
JAndrewBerglund
Address: Institute of Molecular Biology and Department of Chemistry, University of Oregon, Eugene, Oregon, USA.
Correspondence: J Andrew Berglund. Email:
© 2008 Murray et al.; licensee BioMed Central Ltd.
This is an open access article distributed under the terms of the Creative Commons Attribution License ( which
permits unrestricted use, distribution, and reproduction in any medium, provided the original work is properly cited.
Non-canonical intronic motifs<p>The enrichment of specific intronic splicing enhancers upstream of weak PY tracts suggests a novel mechanism for intron recognition that compensates for a weakened canonical pre-mRNA splicing motif.</p>
Abstract
Background: While the current model of pre-mRNA splicing is based on the recognition of four
canonical intronic motifs (5' splice site, branchpoint sequence, polypyrimidine (PY) tract and 3'
splice site), it is becoming increasingly clear that splicing is regulated by both canonical and non-
canonical splicing signals located in the RNA sequence of introns and exons that act to recruit the
spliceosome and associated splicing factors. The diversity of human intronic sequences suggests the
existence of novel recognition pathways for non-canonical introns. This study addresses the
recognition and splicing of human introns that lack a canonical PY tract. The PY tract is a uridine-
rich region at the 3' end of introns that acts as a binding site for U2AF65, a key factor in splicing
machinery recruitment.
Results: Human introns were classified computationally into low- and high-scoring PY tracts by
scoring the likely U2AF65 binding site strength. Biochemical studies confirmed that low-scoring PY
tracts are weak U2AF65 binding sites while high-scoring PY tracts are strong U2AF65 binding sites.
A large population of human introns contains weak PY tracts. Computational analysis revealed
many families of motifs, including C-rich and G-rich motifs, that are enriched upstream of weak PY
tracts. In vivo splicing studies show that C-rich and G-rich motifs function as intronic splicing
enhancers in a combinatorial manner to compensate for weak PY tracts.
Conclusion: The enrichment of specific intronic splicing enhancers upstream of weak PY tracts
suggests that a novel mechanism for intron recognition exists, which compensates for a weakened
canonical pre-mRNA splicing motif.
Background
Pre-mRNA splicing is an essential processing step where non-
coding intervening sequences (introns) are removed from the
initial RNA transcript and coding sequences (exons) are
ligated together to produce mature mRNA. Pre-mRNA splic-
ing is mediated by the spliceosome, a multi-component com-
plex composed of small nuclear ribonucleoproteins (snRNPs)
and over 100 accessory proteins [1]. The splicing machinery
assembles on the pre-mRNA in a highly regulated fashion to
carry out the process of removing the intron and ligating the
two adjoining exons [2,3]. Pre-mRNA splicing relies on the
accurate recognition of the splice junctions that define
Published: 12 June 2008
Genome Biology 2008, 9:R97 (doi:10.1186/gb-2008-9-6-r97)
Received: 20 September 2007
Revised: 27 December 2007
Accepted: 12 June 2008
The electronic version of this article is the complete one and can be
found online at />Genome Biology 2008, 9:R97
Genome Biology 2008, Volume 9, Issue 6, Article R97 Murray et al. R97.2
introns and exons. This is underlined by the observation that
incorrect pre-mRNA splicing is a major contributor to human
genetic diseases [4-6]. Not only is splicing a crucial step in the
accurate transfer of genetic information from DNA to RNA to
protein, it is also a step that allows for regulation of gene
expression as well as increased protein diversity through
alternative splicing decisions [7].
Several canonical intronic sequences define an intron and
recruit the spliceosome to the pre-mRNA: the 5' splice site
(5'ss, AG/GURAGU), the branchpoint sequence (CURAY),
the polypyrimidine (PY) tract (a run of polypyrimidines
located between the 3' splice site and the branchpoint), and
the 3' splice site (3'ss, YAG). These four canonical intronic
sequences are recognized by specific components of the spli-
ceosome or associated splicing factors. In the initial stage of
splicing, when the decision to remove an intron is made, the
U1 snRNP recognizes the 5'ss [8,9], splicing factor 1 (SF1, also
known as BBP) recognizes the branchpoint sequence [10,11],
and U2AF65 (U2AF (U2 snRNP auxillary factor), 65 kDa sub-
unit) recognizes the PY tract [12,13] while its heterodimer
partner U2AF35 (U2AF 35 kDa subunit) recognizes the 3'ss
[14-16]. After these initial recognition events, U2AF65 inter-
acts with the U2 snRNP in order to recruit it to the branch-
point sequence, where it displaces SF1 [17,18].
Although canonical splice elements are located within the
intron, the exon is generally considered to be the unit that is
first recognized and defined by the spliceosome. This is
known as exon definition and is thought to be a dominant
mode of recognition in human genes where the exons are
small and the introns are large [19]. In the exon definition
model, the exon and flanking upstream and downstream
splice junctions are recognized and bridging interactions
across the exon are important for accurate splicing. Con-
versely, according to the intron definition model, the splice
junctions within the intron are recognized and bridging inter-
actions across the intron mediate accurate splicing [19,20].
Intron definition is proposed to be the dominant mode of rec-
ognition for small introns [19].
It has become clear that the four canonical splice elements do
not contain adequate sequence information to ensure accu-
rate splicing [3]. Additional cis-elements appear to be essen-
tial for accurate identification of many splice sites, and
various cis-splicing elements have been identified in both
exonic and intronic regions. Based upon their locations and
effects upon splicing, these have been categorized as exonic
and intronic splicing enhancers (ESEs and ISEs, respectively)
or exonic and intronic splicing silencers (ESSs and ISSs,
respectively) (for reviews see [21-26]).
We are interested in the question of how introns that lack a
canonical splice element are recognized and spliced. We have
focused on introns that lack a canonical PY tract. In humans,
U2AF65 binding to the PY tract is believed to be critical for
intron recognition and splicing. In vitro selection studies
have determined that U2AF65 binds with highest affinity to
continuous runs of uridines interrupted by cytidines [27].
This agrees with the general observation that good PY tracts
contain runs of uridines. We have observed that many human
introns lack these canonical PY tracts. This leads to the ques-
tion of how introns lacking strong U2AF65 binding sites are
recognized and are able to recruit the U2 snRNP.
One model predicts that U2AF65 is not essential for the splic-
ing of these introns. Several human introns have been shown
to be spliced when U2AF65 levels are significantly reduced by
RNA interference [28]. U2AF65 may not be required because
another splicing factor is functioning to recognize the PY tract
region. For example, PUF60 has been shown to substitute for
U2AF65 in vitro for some substrates [29]. There is the poten-
tial that other, yet unidentified, U2AF65-like proteins may
function to promote 3'ss selection of non-canonical PY tracts.
In a second model, U2AF65 is required for splicing but strong
U2AF65-PY tract interactions are not. It has recently been
observed in fission yeast that introns lacking PY tracts require
U2AF for splicing in vivo [30]. Alternative pathways for
U2AF65 recruitment may function in introns lacking strong
PY tracts. For example, additional cis-elements present in the
intron could alleviate the need for strong U2AF65-RNA inter-
actions. These cis-elements could include the branchpoint
sequence and 3'ss, which recruit SF1 and U2AF35, respec-
tively, both of which can bind U2AF65 cooperatively through
protein-protein interactions [11,31,32]. Auxiliary cis-ele-
ments such as ESEs and ISEs could function in the recogni-
tion of introns containing weak PY tracts. Previous studies
have indicated that ESEs located in the downstream exon are
able to compensate for weak PY tracts [33,34]. In this model,
the ESEs are recognized by SR (serine/arginine-rich) pro-
teins that interact with the U2AF65/35 heterodimer to help
recruit U2AF65 to the 3' end of the intron [34-36]. We pro-
pose that a similar mechanism exists where ISEs in the region
upstream of the PY tract function to compensate for weak
U2AF65 binding by helping to recruit either U2AF65 or
U2AF65-recruiting proteins or bypassing the need for
U2AF65 in recruiting the U2 snRNP to the intron.
We have used a computational approach to classify human
introns in terms of their U2AF65 binding site strength. We
conclude that a significant population of human introns does
not contain a strong U2AF65 binding site in the PY tract
region. This classification of human PY tract strength enabled
us to computationally identify intronic motifs over-repre-
sented upstream of weak PY tracts. We propose that these
over-represented motifs are putative ISEs that are important
for the splicing of introns containing weak PY tracts.
LCAT (lecithin cholesterol acyltransferase) intron 4 is a short
(83 nucleotide) constitutively spliced intron with a weak PY
tract. Mutation of the branchpoint sequence U to C (CU
GAC),
is known to result in intron retention, causing familial LCAT
Genome Biology 2008, Volume 9, Issue 6, Article R97 Murray et al. R97.3
Genome Biology 2008, 9:R97
deficiency (complete deficiency) or fish-eye disease (partial
deficiency), which can lead to premature atherosclerosis [37].
Intron retention, rather than skipping, suggests an intron
definition model of recognition [19]. Therefore, we expected
that ISEs might be involved in the recognition of this intron.
We present results showing that G-rich and C-rich motifs,
similar to those predicted by our computational approach to
be enriched upstream of weak PY tracts, are ISEs important
for the splicing of LCAT intron 4, which has a weak PY tract.
Furthermore, we have observed that the G-rich and C-rich
ISEs function in a combinatorial manner to promote the rec-
ognition of a weak PY tract-containing intron. Finally, we
show another example of an intron, GNPTG (N-acetylglu-
cosamine-1-phosphotransferase gamma subunit) intron 2, in
which C-rich ISEs again appear to be compensating for a
weak PY tract.
Results
Computational analysis of human intron PY tracts
using a U2AF65 binding site scoring method
U2AF65 plays an important role during splicing and is known
to bind to the PY tract region located between the branch-
point sequence and the acceptor splice junction [38]. Visual
inspection of human introns reveals that, although the PY
tract region is enriched in uridines in general, there is a great
deal of sequence variation between introns. This degeneracy,
at least in part, appears to reflect the low RNA site specificity
that U2A65 displays compared to other RNA binding proteins
that evolved to recognize highly specific targets. U2AF65
binds with high affinity to contiguous runs of uridines but
appears to tolerate moderate interruptions of other nucleo-
tides [27,39-41]. Despite the ability of U2AF65 to bind to
degenerate sites, an effective binding site must still be com-
posed primarily of uridines [40,41]. However, many thou-
sands of human introns contain PY tracts that do not contain
any sequences that are likely to be effective binding sites
(shown below). Many of these PY tracts either contain contig-
uous runs of cytidines or contain numerous purines, neither
of which are likely to represent binding sites for U2AF65
[40,41]. Therefore, it is likely that individual human intronic
PY tracts possess a wide range of affinities towards U2AF65,
and that many may possess only weak binding sites for it. It is
possible that additional cis-sequence elements augment the
role of the PY tract during splicing, and that such elements
play crucial roles in splicing in the absence of a strong
U2AF65 binding site.
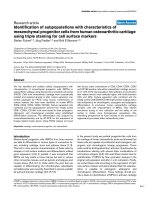
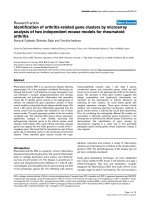
Many human introns have been shown to be enriched in
motifs containing GGG in the region upstream of the PY tract
[42,43] (Figure 1a). This observation demonstrates that this
region is under compositional selection. G-triples located
upstream of a weak PY tract have been shown to affect splice
site usage [20]. We hypothesized other cis-elements may also
be located upstream of the PY tract and may compensate for
PY tracts containing weak U2AF65 binding sites. To explore
this possibility we performed a computational analysis to
determine if the region upstream of the PY tract is enriched in
specific motifs when the PY tract does not contain a strong
U2AF65 binding site.
In order to carry out this analysis, we first needed to correlate
the composition of the PY tract of introns with likely affinities
towards U2AF65. Several theoretical models have been pre-
sented that describe the relationship between binding site
composition and the ΔG of binding between nucleic acids and
nucleic acid binding proteins [44,45]. These models require
the use of a positional frequency model representing the pre-
ferred binding site. In vitro selection (SELEX) experiments
using human U2AF65 did not reveal a well defined consensus
motif shared by high affinity RNAs [27,39]. Several computa-
tional methods have been developed to define a degenerate
consensus motif from a population of sequences that are
thought to contain a common, but unknown, motif [46,47].
Though such methods have proven useful, each has its own
weaknesses, and all such predictive methods introduce an
added level of uncertainty. We decided to develop a computa-
tional method to predict the affinity between a short RNA
sequence and U2AF65 that is independent of knowledge of a
particular consensus binding motif. We refer to this score as
an S
65
score. The S
65
score, for a given intron, is the average
degree to which all pentamers (using a sliding window) found
in the PY tract region (-30 to -3 relative to the acceptor splice-
junction) are themselves enriched within the SELEX derived
sequences (see Materials and methods for a complete
description).
For this analysis, the PY tract was defined as the region from
-30 to -3 (relative to the acceptor splice junction). This region
is highly enriched in the pentamers that are most abundant
within the U2AF65 selected sequences (Figure 1a and data
not shown). Although a small number of introns are thought
to possess functional U2AF65 binding sites upstream of this
region [48], the general enrichment for uridines in this region
(Figure 1a) is consistent with the premise that the bulk of
U2AF65 functional binding sites are located adjacent to the
acceptor splice-junction.
The S
65
scores for the SELEX RNAs appear to be normally dis-
tributed with a mean of 1.5 (Figure 1b). In contrast, the S
65
scores for human PY tracts display a slightly skewed distribu-
tion with a mean of 0.877 and a median of 0.811. These are
shifted significantly to the left (that is, weaker) relative to the
scores for the U2AF65 selected RNAs, suggesting that a large
portion of human PY tracts represent weaker than optimal
U2AF65 binding sites.
We chose to classify PY tracts that score below the median of
0.811 as 'weak' PY tracts and those above 0.811 as 'strong' PY
tracts or likely to have high affinity U2AF65 binding sites.
Using this designation, only a single SELEX-derived
sequence scores as 'weak'. We are therefore asking whether
Genome Biology 2008, 9:R97
Genome Biology 2008, Volume 9, Issue 6, Article R97 Murray et al. R97.4
there are statistically significant differences in the composi-
tion of the -80 to -30 region of two types of introns: ones that
contain a PY tract with affinities similar to those derived
using SELEX, and those with PY tracts with lower affinities.
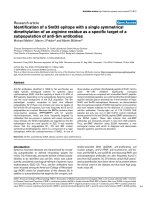
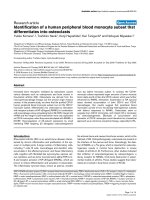
Binding of U2AF65 to low-scoring PY tracts
In order to asses the relationship between the S
65
score and
observed U2AF65 binding affinities, we evaluated the binding
of recombinant human U2AF65 to several human PY tracts of
varying S
65
scores using gel-shift mobility assays (Figure 2).
We chose one PY tract that had a very low score (MBNL1
intron 6, S
65
= 0.0750). This PY tract is interrupted by several
purines that are expected to impair U2AF65 binding. We also
evaluated three other low-scoring PY tracts with scores closer
to the median, and, therefore, correspond to the more 'typical'
human PY tract: BRUNOL4 intron 9 (S
65
= 0.3602), ITGB4
intron 31 (S
65
= 0.3608), and LCAT intron 4 (S
65
= 0.5068).
All three of these are cytidine-enriched. In addition, we tested
three high-scoring PY tracts that had scores spanning the
higher range of the distribution: INSR intron 10 (S
65
=
0.9593), U2AF2 intron 6, (S
65
= 1.1787), and SR140 intron 9
(S
65
= 1.8434), and an altered version of the LCAT intron 4 in
which the central region was modified to contain an eight
nucleotide poly-uridine run (LCATmut with a S
65
of 1.2060).
All four of these high-scoring sequences are uridine-enriched.
Binding data were also obtained using two sequences derived
from the PY tract of the adenovirus major late (ADML) pre-
mRNA, similar to previously studied ADML PY tracts [32,49].
We expected the MBNL1 intron 6 PY tract to represent the
weakest U2AF65 binding target and observed no detectable
levels of U2AF65 binding at the protein concentrations tested
(Figure 2). Meanwhile, all three of the cytidine-rich
sequences with moderate S
65
scores demonstrated moderate
affinities in the binding assay. In contrast, three of the urid-
ine-rich sequences (with high S
65
scores) bound with high
affinity. An interesting exception was the INSR-derived
sequence, which bound U2AF65 more weakly than the more
cytidine-rich LCAT-derived sequence. Importantly, for both
LCAT and ADML, the binding of the mutant versions corre-
lates well with the predicted affinities based upon the S
65
score.
Overall, there is a good agreement between the observed
binding affinities for U2AF65 and the predicted affinities
based upon the S
65
score. Plotting the observed K
d
values ver-
sus the predicted S
65
score revealed that the ln of the K
d
appears to be linearly related to the S
65
score (Figure 2c).
Since ΔG is related to K
d
according to the equation ΔG° = -
RTln(K
d
), this is consistent with the supposition that S
65
is
linearly related to ΔG. Linear regression of the observed affin-
ities and S
65
scores demonstrates that these values are
strongly correlated (R
2
= 0.77; Figure 2c). Some of the
observed deviations may be due to influences of RNA second-
ary structures present in some of the templates. Such second-
ary structure could greatly influence U2AF65 interactions,
but this parameter is not addressed in the S
65
score. Since
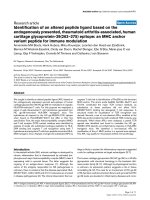
Computational analysis of human intron PY tractsFigure 1
Computational analysis of human intron PY tracts. (a) Distribution of intronic motifs (branchpoint (BPS), G-triples (GGG) and U2AF65 binding sites
(U2AF65)) adjacent to the 3' end of human introns. The BPS curve is a composite of the distribution of all pentamers containing YTRAC (Y = T or C, R =
A or G). The G-triple curve is the composite for all pentamers containing GGG. The U2AF65 curve is a composite of the occurrence of the ten most
abundant pentamers found in the U2AF65 SELEX sequences [27,39] (Additional data file 1). The distributions were determined over all human introns, and
for each curve the total area under the curve was normalized to unity. The two regions used in this study are depicted below the curves. The PY tract
region consisted of the region from -30 to -3, and the upstream PY (UPY) tract region was defined to be from -80 to -30 (relative to the acceptor splice-
junction (SJ)). (b) Distribution of U2AF65 binding site scores (S
65
scores) for all human introns (filled blue) and for the U2AF65 SELEX sequences used as
the training set for the binding site score (vertical solid black lines). The distributions were generated using a bin size of 0.02, and the total area under the
curves was normalized to unity. The median (used as the cutoff for 'weak' and 'strong' binding sites) is depicted as a vertical dashed line.
(a) (b)
SJ relative position
Fractional
occurrence
–100 –80 –60 –40 –20 0
0.00
0.01
0.02
0.03
0.04
BPS
GGG
U2AF65
Fractional
occurrence
UPY PY
weak strong
0123
0.00
0.02
0.04
PYT
SELEX
Median
S score
65
Genome Biology 2008, Volume 9, Issue 6, Article R97 Murray et al. R97.5
Genome Biology 2008, 9:R97
U2AF65 is known to have a strong preference for uridines, it
is possible that the observed binding affinities simply reflect
overall uridine content. However, linear regression analysis
of the uridine content versus binding affinities demonstrates
that these values are not well correlated (R
2
= 0.27, data not
shown). Therefore, the S
65
score is a better predictor of bind-
ing affinity than uridine content alone and suggests that
U2AF65 is recognizing sequence features more complex than
the simple presence or absence of contiguous runs of
uridines.
Introns containing weak PY tracts are enriched in
specific motifs upstream of the PY tract
It is possible that introns containing weak U2AF65 binding
sites might be enriched in specific sequences that can com-
pensate for the lack of a well-defined PY tract. In order to
identify such motifs, we first characterized the relative
enrichment of all 4-7 nucleotide n-mers in the 50 nucleo-
tide region from -80 to -30 (relative to the splice-junction)
for introns with PY tracts categorized as 'weak' relative to
the set of all introns (S
65
scores less than 0.811; see Materi-
als and methods). We were specifically interested in iden-
tifying sequences located in the region upstream of the
branchpoint itself. Since most branchpoints are located
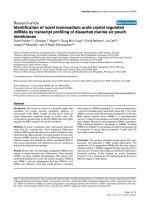
Binding of U2AF65 to human PY tracts validates the U2AF65 SELEX scoring systemFigure 2
Binding of U2AF65 to human PY tracts validates the U2AF65 SELEX scoring system. (a) Gel shift of human U2AF65 with human PY tract RNA
oligonucleotides. (b) RNA sequences used for binding studies. The gene and intron (IVS) of origin are indicated. The K
d
values are the average of triplicate
experiments. K
d
values marked with an asterisk are estimated since the levels of protein required to reach saturation exceed the capacity of the
experiment. (c) Linear regression of the observed U2AF65 affinities versus the predicted S
65
score.
LCAT ITGB4 MBNL1 LCATmut
Free
Complex
(a)
[U2AF65] µM
BRUNOL4 INSR
Free
Complex
[U2AF65] µM0010 10
3.4
+
-
0.6 8.8 1.5
0 140 14
0 14
0 14
1.9 0.3 52 0.3 >>14 0.12 0.03
SR140 U2AF2
Free
Complex
[U2AF65] µM0 0.5 0 0.5
0.03 0.01 0.08 0.03
(b) (c)
+
-
+
-
+
-
+
-
+
-
+
-
+
-
+
-
+
-
+
-
+
-
+
-
+
-
+
-
Gene/IVS Sequence
S
65
score
MBNL1 / 6 caugugcucgcugccugcuaauuaag 0.0750 100 *
BRUNOL4 / 9 ccgcccacccccuccccucaccgcag 0.3602 3.4 0.6
ITGB4 / 31 cccuggcucacuccccugcccugcag 0.3608 52 *
LCAT / 4 gcccugaccccuuccacccgcugcag 0.5068 1.9 0.3
INSR / 10 caaaggcguugguuuuguuuccacag 0.9593 8.8 1.5
LCATmut / 4 gcccugaccccuuuuuuuugcugcag 1.2060 0.12 0.03
U2AF2 / 6 ucaccacuccuuucucuuucauucag 1.1787 0.08 0.03
SR140 / 9 uaauucuuuuuuucuuucugcccuag 1.8434 0.03 0.01
ADMLmut uucgugcugacccugucccguauuaguccacagcugca 0.3553 15.8 6.3
ADML uucgugcugacccugucccuuuuuuuuccacagcugca 1.1640 0.12 0.03
Kd
(µ
M
)
LN( K
d
)
0.0
0.5
1.0
1.5
2.0
–4
0
4
R
2
= 0.77
S score
65
Genome Biology 2008, 9:R97
Genome Biology 2008, Volume 9, Issue 6, Article R97 Murray et al. R97.6
between -17 and -30 (Figure 1a), the region evaluated would
exclude the majority of branchpoint-like sequences.
Human introns have been shown to fall into two classes based
upon GC or AT content [50]. In order to be sure that we were
not merely measuring compositional biases between AT-rich
and GC-rich introns, we classified introns according to the GC
content of the last 100 bases. Introns with greater than 50%
GC content were categorized as GC-rich while those with less
than 50% GC were categorized as AT-rich. As measured using
our criteria, 37% of AT-rich introns were found to have 'weak'
PY tracts, and 72% of GC-rich introns were determined to
have 'weak' PY tracts.
Enrichment of n-mers in the -80 to -30 region for introns
with weak PY tracts versus all GC or AT-rich introns was
determined (see Materials and methods). The entire list of
enriched n-mers used in this study is available in Additional
data files 2 and 3. According to this analysis, 99 n-mers were
determined to be significantly enriched (P < 0.01) in the AT-
rich class, and 349 n-mers were determined to be signifi-
cantly enriched in the GC-rich class. For comparison, we drew
random samples of the same size as the corresponding weak
PY tract class for both the AT-rich and GC-rich introns, and
determined enrichment using the same method as above. The
average number of n-mers (for to seven nucleotides) that
were determined to be significantly enriched in the randomly
drawn samples was ten for the AT-rich and zero for the GC-
rich class. Therefore, the enrichment measured appears to be
strongly correlated with the composition of the PY tract as
measured by the S
65
score.
It has been proposed that signals that govern splicing of
shorter (<200 nucleotides) introns may differ from those
governing splicing of longer introns [51]. Therefore, we also
evaluated short (<200 nucleotides) and long (≥ 200 nucleo-
tides) AT-rich and GC-rich introns as independent classes.
We found that enrichment was similar for both short and long
GC-rich introns as evidenced by the observation that the
enrichment score for n-mers correlated between these groups
(Additional data file 6a). Meanwhile, little correlation was
seen between the enrichment scores for long versus short AT-
rich introns (Additional data file 6b). This is likely due to the
fact that few n-mers were actually determined to be signifi-
cantly enriched in the short AT-rich population (Additional
data file 6b, and data not shown). Together, these data sug-
gest that the compositional biases seen in the region
upstream of the PY tract correlate with the potential for
U2AF65 binding, especially for GC-rich introns, and that the
bias is similar for both long and short introns.
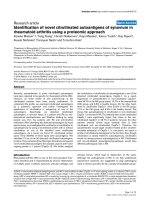
To determine motifs, the enriched n-mers were clustered
using the graph clustering method and software presented by
Voelker and Berglund [52]. Clustering of the n-mers derived
from the GC-rich introns yielded 25 clusters (Additional data
file 4). These were manually separated into eight groups of
compositionally similar motifs (Figure 3a). The n-mers
derived from the AT-rich introns yielded eight clusters, of
which the three most significant are shown in Figure 3b.
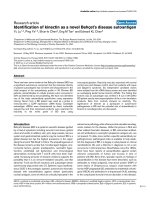
Motifs containing three to four contiguous guanidines are
greatly enriched upstream of weak PY tracts for both AT-rich
and GC-rich introns (Figure 3, motifs GC2-GC8 and AT1-
AT2). Similar G-rich motifs have been previously shown to be
enriched in this region [42,43]. G-rich intronic tracts have
been shown to play important roles as splicing signals [53-
56], and several heterogeneous nuclear ribonucleoproteins
(hnRNPs), including hnRNPs A1, A2, F, and H, have been
shown to bind G-rich RNA motifs [54,57-59]. The majority of
the G-rich motifs appear to contain a common substring of
three to four contiguous Gs separated by one to two
nucleotides, and the preferred di-nucleotide spacers appear
to be CT, CC, and CA.
In addition, we observed that C-rich motifs (containing three
to four contiguous cytidines) are enriched upstream of weak
GC-rich PY tracts (Figure 3, motif GC1). Using different com-
putational methods, similar C-rich motifs have been pre-
dicted to be ISEs [60]. Our analysis provides additional
evidence suggesting that C-rich motifs, located upstream of
the PY tract, may play important roles in splicing.
We also observed that AT-rich introns with weak PY tracts
were enriched in motifs similar to a motif recognized by the
protein CUG-BP1 (Figure 3, motif AT3) [61]. It is interesting
that these motifs did not appear in the GC-rich class. This
may be due to compositional biases in the GC-rich class that
preclude their identification using the computational meth-
ods that we employed, or it may imply that these motifs are,
in fact, more abundantly represented in the AT-rich class.
Introns containing weak PY tracts are enriched in specific motifs upstream of the PY tractFigure 3
Introns containing weak PY tracts are enriched in specific motifs upstream
of the PY tract. Shown are representative motifs derived from n-mers
enriched in the region upstream of weak PY tracts (see Materials and
methods for details of motif construction). The complete list of motifs is
available in Additional data files 4 and 5. The average Z-score for
enrichment of all of the n-mers that compose the motif is shown to the
right. (a) Motifs over-represented upstream of weak PY tracts for GC-
rich human introns. (b) Motifs over-represented upstream of weak PY
tracts for AT-rich human introns.
(a) (b)
ID Motif Ave Z ID Motif Ave Z
GC1 2.46 AT1 2.76
GC2 3.03 AT2 2.66
GC3 2.86 AT3 2.91
GC4 3.32
GC5 2.84
GC6 2.55
GC7 2.67
GC8 2.62
C
G
C
A
GGGGG
A
G
T
A
T
GGG
A
GG
C
G
G
GGCT G
C
T
G
G
A
G
GG
T
GGG
T
C
G
T
G
GC CCC
G
C
T
G
GGGCG
G
G
C
G
CCGGG
A
C
G
A
A
T
G
A
G
GGC
A
G
G
C
A
A
G
T
T
GGG
C
A
T
A
T
C
A
C
A
G
T
C
A
T
GGGG
T
G
A
A
T
C
G
C
T
G
T
G
T
G
T
Genome Biology 2008, Volume 9, Issue 6, Article R97 Murray et al. R97.7
Genome Biology 2008, 9:R97
These analyses demonstrate that certain motifs are statisti-
cally over-represented upstream of human introns containing
weak PY tracts. We also wanted to assess how prevalent these
motifs are among introns in general, and also determine the
relative level of enrichment between introns with strong ver-
sus weak U2AF65 binding sites. Therefore, for each intron,
we determined the percentage of the region from -80 to -30
that matched one or more of the n-mers determined to be
enriched in introns with weak PY tracts relative to those with
strong PY tracts (see above). We refer to this value as the per-
cent coverage. As an example, 80% coverage indicates that
80% of the -80 to -30 region (or 40 of the 50 nucleotides)
matches one or more of the enriched n-mers. This analysis
(Additional data file 7) revealed that most introns have at
least one match to an enriched n-mer. This is not surprising
considering that the n-mers are only four to seven nucleotides
in length, and, therefore, are expected to occur by chance with
fairly high frequency. However, this analysis also revealed
that introns with weak PY tracts are likely to have a greater
coverage than introns with strong PY tracts. This is especially
true of the GC-rich class of introns. For instance, while only
10% of GC-rich introns with strong PY tracts have 80-100%
coverage, 23% of introns with weak PY tracts have this level of
coverage (Additional data file 7). A smaller difference in cov-
erage is seen between AT-rich introns with strong and weak
PY tracts; however, the overall trend is the same (Additional
data file 7). In both cases, the enriched n-mers tend to make
up a greater portion of the -80 to -30 region for introns with
weak PY tracts. Together, these observations indicate that the
sequences represented by the enriched n-mers are rather
common but they tend to cluster in introns with weak PY
tracts.
C-rich and G-rich motifs act as ISEs in an intron
containing a weak polypyrimidine tract
LCAT intron 4 contains both C-rich and G-rich motifs
upstream of the PY tract similar to those we identified com-
putationally that are also highly conserved. The PY tract of
LCAT intron 4 is a low-scoring PY tract and is not well con-
served. To investigate the role of C-rich and G-rich motifs
present in LCAT intron 4, we used a mini-gene system. We
created a mini-gene that contains the last 50 nucleotides of
LCAT intron 3, LCAT exon 4, LCAT intron 4, LCAT exon 5 and
the first 50 nucleotides of LCAT intron 5. We included the
downstream and upstream flanking introns in order to allow
exon definition to occur, although short introns are often
observed to function by intron definition [19].
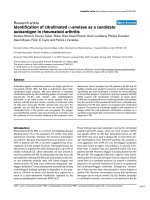
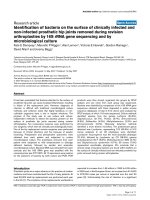
Mutation of the G-rich motifs
We examined the role of two G-rich motifs (G-rich motif
(GRM)1 and GRM2) present upstream of the PY tract of LCAT
intron 4 (Figure 4a). The wild-type (WT) LCAT intron 4 mini-
gene splices such that 5 ± 1% pre-mRNA is observed (Figure
4b, lane 1, and 4c). Mutation of GRM1 to AAA (MUT 3, Figure
4a) had a strong effect, and increased the unspliced product
to 19 ± 5% (Figure 4b, lane 2, and 4c). Mutation of GRM2 to
AAA (MUT 4, Figure 4a) had slightly less of an effect than
MUT 3, resulting in 14 ± 3% pre-mRNA (Figure 4b, lane 3,
and 4c). Mutation of both GRM1 and GRM2 (MUT 7, Figure
4a) had a similar effect as mutation of GRM1 alone (Figure
4b, lane 4, and 4c), suggesting that the two GRMs do not func-
tion additively towards recognition of LCAT intron 4. We also
mutated a region that was neither a G-rich motif nor C-rich
motif (MUT 5, Figure 4a) to be sure that the AAA motif we
were inserting was not acting as an ISS. MUT 5 spliced simi-
larly to WT (Figure 4b, compare lanes 1 and 5; Figure 4c), sug-
gesting that the presence of the mutant AAA sequence in that
region of LCAT intron 4 does not act as an ISS. These results
suggest that GRM1 and GRM2 are ISEs important for the
splicing of LCAT intron 4.
Mutation of the C-rich motifs
To determine whether the C-rich motifs function as ISEs, we
mutated two C-rich motifs: C-rich motif (CRM)1 and CRM2
(Figure 5a), which are present upstream of the PY tract in
LCAT intron 4. Mutation of CRM1 to AAA (MUT 1, Figure 5a)
did not have a significant effect on splicing (Figure 5b, lane 2,
and 5c). We also created a CRM1 mutant where we mutated
CCC to AUA (MUT 1b, Figure 5a) and observed the same level
of splicing as the AAA mutant (Figure 5b, compare lanes 2
and 3; Figure 5c). Similarly, mutation of CRM2 to AAA (MUT
2, Figure 5a) did not have a significant effect on splicing (Fig-
ure 5b, lane 4, and 5c). However, mutation of both CRM1 and
CRM2 (MUT 6, Figure 5a) resulted in a decrease in splicing to
19 ± 3% pre-mRNA (Figure 5b, lane 5). These results suggest
that while CRM1 and CRM2 do not individually contribute
significantly to the splicing of LCAT intron 4, mutation of
multiple C-rich motifs has a combinatorial effect.
Cumulative mutation of the G-rich and C-rich motifs
We hypothesized that the G-rich motifs and C-rich motifs
could be functioning together in the recognition of LCAT
intron 4. We have observed that there are many examples of
introns where the G-rich and C-rich motifs are both present
(data not shown). Mutation of both GRM1 and CRM1 (MUT
24, Figure 6a) resulted in a greater decrease in splicing
(shown as an increase in percent pre-mRNA) than mutation
of either motif alone (Figure 6b, compare MUT 24, lane 5, to
MUT 1, lane 2, or MUT 3, lane 3; Figure 6c). An even greater
decrease in splicing was observed for the combined mutation
of GRM1, CRM1 and CRM2 (MUT 25, Figure 6b, compare
MUT 25, lane 6, to MUT 3, lane 3 or MUT 6, lane 4; Figure
6c). These results suggest that the G-rich motifs and C-rich
motifs function in combination to promote the splicing of
LCAT intron 4.
G-rich and C-rich motifs can functionally replace one
another as ISEs
We examined whether the C-rich motifs could function in the
place of the G-rich motifs. Mutation of GRM1 to CCC (MUT
27, Figure 7a) resulted in a smaller decrease in splicing com-
pared to that observed for mutation of GRM1 to AAA (Figure
Genome Biology 2008, 9:R97
Genome Biology 2008, Volume 9, Issue 6, Article R97 Murray et al. R97.8
7b, compare MUT 27, lane 5, to MUT 3, lane 2; Figure 7c).
Mutation of GRM1 and GRM2 to C-rich motifs (MUT 28, Fig-
ure 7a) also resulted in a smaller decrease in splicing com-
pared to mutating GRM1 and GRM2 to AAA (Figure 7b,
compare MUT 28, lane 6, to MUT 7, lane 3). We observed that
both the single and double GRM to CRM mutations resulted
in similar effects on splicing (Figure 7b, compare MUT 27,
lane 5, to MUT 28, lane 6). These results suggest that a C-rich
motif can partially compensate for a G-rich motif in this loca-
tion. Furthermore, it appears that a C-rich motif followed by
a G-rich motif (MUT 27) functions as effectively as two C-rich
motifs (MUT 28). Mutation of CRM1 and CRM2 to G-rich
motifs (MUT 29, Figure 7a) resulted in splicing similar to WT
(Figure 7b, compare MUT 29, lane 7, to WT, lane 1; Figure 7c).
We conclude that G-rich motifs can fully compensate for, and
function in the place of, C-rich motifs, while C-rich motifs can
only partially compensate for G-rich motifs.
Strengthening the PY tract eliminates the role of the
C-rich motifs
We next investigated the role of the PY tract in LCAT intron 4
splicing. We mutated the PY tract to determine whether the
C-rich sequences in the PY tract were also being recognized.
Mutation of a C-rich sequence in the PY tract (CRM3, MUT
16B, Figure 8a) resulted in a minor decrease in splicing (MUT
16B, Figure 8b, lane 9, and 8c), indicating that CRM3 is not
singly making a major contribution to the recognition of
LCAT intron 4. However, the minor decrease in splicing does
suggest that the PY tract may be playing a role. Strengthening
the PY tract by mutating the sequence to include a run of eight
uridines (MUT 17, Figure 8a) resulted in similar splicing to
WT (Figure 8b, compare WT, lane 1, to MUT 17, lane 5). How-
ever, in the context of this strengthened PY tract, mutation of
CRM1 and CRM2 (MUT 20, Figure 8a) did not result in
decreased splicing (Figure 8b, compare MUT 20, lane 6, to
MUT 6, lane 2; Figure 8c). Furthermore, the cumulative
mutation of GRM1 and CRM1 (MUT 48, Figure 8a) or GRM1,
CRM1 and CRM2 (MUT 49, Figure 8a) did not affect splicing
in the presence of the strengthened PY tract (Figure 8b, com-
pare MUT 48 to MUT 24 and MUT 49 to MUT 25). This result
suggests that, in the context of a strengthened PY tract, the C-
rich motifs and G-rich motifs are no longer necessary for rec-
ognition, while in the WT context the C-rich motifs and G-rich
motifs function as ISEs to compensate for the weak LCAT
intron 4 PY tract.
G-rich motifs function as ISEs in LCAT intron 4 splicingFigure 4
G-rich motifs function as ISEs in LCAT intron 4 splicing. (a) LCAT intron 4 with the mutations shown in blue above the WT sequence. BPS, branchpoint.
(b) Splicing of the LCAT intron 4 mini-genes (WT, MUT3, MUT4, MUT7 and MUT 5) in HeLa cells. Splicing products (isolated from HeLa, reverse-
transcribed and amplified with radioactive PCR) were resolved on an 8% non-denaturing gel and scanned using a phosphorimager. The pre-mRNA (top) is
a 472 bp product and the mRNA (bottom) is a 389 bp product. The average quantification and standard deviation of the percent pre-mRNA (pre-mRNA
divided by total RNA) for at least triplicate reactions is reported below each lane. (c) Graphical representation of the percent pre-mRNA for each LCAT
mini-gene. Error bars represent standard deviation of replicate experiments.
WT MUT3 MUT4 MUT7 MUT5
1 2 3 4 5
LCAT intron 4
(a)
(c)(b)
WT MUT3 MUT4 MUT7 MUT5
25
10
20
15
5
0
Percentage of pre-mRNA
4 5
4 5
BPS
GTGAGTGTCTCTGCGGATGACCGGCTTGGGGTGGGGCAGGTGCCCCAGACCCCAGCTGCCCTG
A
CCCCTTCCACCCGCTGCAG
AAA
GRM1 GRM2
MUT3 MUT4
AAA
MUT5
AA
MUT7
AAATAAA
5±1 19±5 14±3 23±1 7±1
Genome Biology 2008, Volume 9, Issue 6, Article R97 Murray et al. R97.9
Genome Biology 2008, 9:R97
C-rich motifs are ISEs in an additional intron
containing a weak PY tract
GNPTG intron 2 is an alternatively spliced (intron retention)
short intron containing multiple C-rich motifs upstream of a
low scoring PY tract (Figure 9a, S
65
score = 0.536). In order to
test the function of the three C-rich motifs, we created a mini-
gene containing exon 2, intron 2 and exon 3. The WT GNPTG
intron 2 mini-gene splices such that 29 ± 6% pre-mRNA is
observed (Figure 9b,c). Mutation of the three C-rich motifs
upstream of the PY tract (Figure 9a) had a significant effect on
splicing, resulting in 63 ± 5% pre-mRNA (Figure 9b,c). This
result provides an additional example of C-rich motifs func-
tioning as ISEs in an intron containing a weak PY tract.
Discussion
The present model of pre-mRNA splicing is based on the rec-
ognition of the four canonical intronic motifs (5'ss, branch-
point sequence, PY tract and 3'ss) [3]. However, many introns
lack one or more of these motifs and yet they are spliced. The
diversity of human intronic sequences suggests that novel
recognition pathways exist for non-canonical introns. Using
an experimentally validated computational approach, introns
lacking a canonical PY tract were isolated and analyzed to
identify putative ISEs that functionally compensate in splic-
ing when the PY tract is weak.
U2AF65 binding to PY tracts confirms the U2AF65
SELEX scoring system
Our U2AF65 binding studies using various human intron PY
tracts (Figure 2) confirm that the computational prediction
can generally delineate strong and weak U2AF65 binding
sites. Two caveats to our scoring system are: it is based solely
on the U2AF65 SELEX data and, therefore, does not take into
account nucleotide substitutions that are particularly delete-
rious for U2AF65 binding; and it cannot account for RNA sec-
ondary structure. Each of these parameters can contribute to
lower than predicted binding affinities and may partially
explain the deviations observed between predicted and
observed binding strengths. Nevertheless, the S
65
score is
generally able to distinguish between sequences displaying
strong and weak interactions with U2AF65, and it is more
accurate than using simple uridine content alone.
For this analysis we also assume that the PY tract is located in
the last 30 nucleotides of the intron. While this is a fair
assumption for the vast majority of human introns, there are
examples of introns where the PY tract and branchpoint
sequence are located a further distance from the 3'ss AG
[48,62-64]. Some of the human introns that score as having
low scoring PY tracts may actually have high scoring PY tracts
that are distally located. Although there are caveats to our
scoring system, the S
65
score generally distinguishes low and
C-rich motifs function as ISEs in LCAT intron 4 splicingFigure 5
C-rich motifs function as ISEs in LCAT intron 4 splicing. (a) LCAT intron 4 with the mutations shown in blue above the WT sequence. BPS, branchpoint.
(b) Splicing of the LCAT intron 4 mini-genes (WT, MUT1, MUT1b, MUT2, MUT 6 and MUT 5) in HeLa cells. Analysis was performed as in Figure 4. (c)
Graphical representation of the percent pre-mRNA for each LCAT mini-gene. Error bars represent standard deviation of replicate experiments.
4 5
4 5
WT MUT1 MUT1b MUT2 MUT6 MUT5
(a)
(c)(b)
WT MUT1 MUT1b MUT2 MUT6 MUT5
BPS
GTGAGTGTCTCTGCGGATGACCGGCTTGGGGTGGGGCAGGTGCCCCAGACCCCAGCTGCCCTG
ACCCCTTCCACCCGCTGCAG
AAA
CRM1 CRM2
MUT1
MUT2
AAA
MUT5
AA
MUT6
AAAAGACAAA
MUT1b
AUA
LCAT intron 4
1 2 3 4 5 6
5±1 8±2 10±2 10±2 19±3 7±1
25
10
20
15
5
0
Percentage of pre-mRNA
Genome Biology 2008, 9:R97
Genome Biology 2008, Volume 9, Issue 6, Article R97 Murray et al. R97.10
high affinity U2AF65 binding sites, allowing us to ask
questions about the population of human introns with low
affinity U2AF65 binding sites.
Intronic motifs enriched upstream of weak PY tracts
We have identified families of motifs that are over-repre-
sented upstream of weak PY tracts but not upstream of strong
PY tracts (Figure 3). Our evidence, combined with previous
observations, suggests that these motifs function as ISEs that
appear to compensate for weakened U2AF65-PY tract inter-
actions. While we chose to focus our attention on the G-rich
and C-rich triplet motifs, our study identified at least one
additional motif that may represent binding sites for mem-
bers of the CELF family of proteins. However, additional
experimental evidence will need to be obtained to verify the
functional significance of the other motifs identified by our
study.
The experimental work presented here has focused on two
relatively short introns, but our computational analysis found
that the same families of motifs were over-represented in
both short and long human introns (Additional data file 6).
Although LCAT intron 4 is constitutively spliced, expressed
sequence tag data suggest that GNPTG intron 2 is alterna-
tively spliced, with some expressed sequence tags containing
a retained intron 2. We expect to find examples where these
motifs may play important roles in both constitutive and
alternative splicing for both short and long introns.
Interplay of G-rich and C-rich ISEs in the splicing of
LCAT intron 4
G-rich motifs have been shown to be enriched in short mam-
malian introns [20,65]. The G-rich motif GRM1 is the strong-
est ISE we have observed in LCAT intron 4 (Figure 4). Double
mutation of the two sequential G-rich motifs does not result
in an additive effect on splicing. G-rich motifs have been
shown to function in a combinatorial manner to promote
splicing [20,56], although the spacing between G-rich motifs
was greater (for example, 8-10 nucleotides [56]), than in
LCAT intron 4, where only a single nucleotide separates the
two G-rich motifs. Our studies confirm that G-rich sequences
play an important role in promoting the recognition of GC-
rich introns with weak PY tracts as previously observed [20].
Our results also show that C-rich motifs can act as ISEs like
the G-rich motifs, but that the C-rich motifs may play more of
an ancillary role to the G-rich motifs, at least in the case of
LCAT intron 4 (Figure 5). C-rich motifs have been shown to
function as an ISE in a chicken intron near the 5'ss [66], and
as an ISS in a human intron near the 3'ss [67]. The single C-
rich motif mutational studies presented here suggest that the
C-rich motifs present in LCAT intron 4 have little individual
G-rich and C-rich motifs function combinatorially in LCAT intron 4 splicingFigure 6
G-rich and C-rich motifs function combinatorially in LCAT intron 4 splicing. (a) LCAT intron 4 with the mutations shown in blue above the WT sequence.
BPS, branchpoint. (b) Splicing of the LCAT intron 4 mini-genes (WT, MUT1, MUT3, MUT6, MUT 24 and MUT 25) in HeLa cells. Analysis was performed
as in Figure 4. (c) Graphical representation of the percent pre-mRNA for each LCAT mini-gene. Error bars represent standard deviation of replicate
experiments.
WT MUT1 MUT3 MUT6 MUT24 MUT25
(a)
(c)
(b)
4 5
4 5
WT MUT1 MUT3 MUT6 MUT24 MUT25
BPS
GTGAGTGTCTCTGCGGATGACCGGCTTGGGGTGGGGCAGGTGCCCCAGACCCCAGCTGCCCTG
ACCCCTTCCACCCGCTGCAG
AAA
CRM1 CRM2
MUT3
AAA
MUT6
AAAAGACAAA
MUT1
GRM1
AAATGGGGCAGGTGCAAAAGACAAA
MUT25
MUT24
AAATGGGGCAGGTGCAAA
LCAT intron 4
1 2 3 4 5 6
5±1 8±2 19±5 19±3 33±5 50±6
Percentage of pre-mRNA
50
20
40
30
10
0
60
Genome Biology 2008, Volume 9, Issue 6, Article R97 Murray et al. R97.11
Genome Biology 2008, 9:R97
effect on LCAT intron 4 splicing. However, we have observed
that the C-rich motifs function additively, and that mutating
both C-rich motifs (CRM1 and CRM2) is equivalent to mutat-
ing the one stronger G-rich motif (GRM1). Furthermore, we
show that the mutation of multiple C-rich motifs in GNPTG
intron 2 has a significant effect on splicing. This provides an
additional example of C-rich motifs functioning as ISEs in an
intron with a weak PY tract. C-rich motifs have not been
previously shown to function as ISEs in human, nor to func-
tion in tandem to produce an additive effect on splicing.
Interestingly, the C-rich and G-rich motifs together function
additively (Figure 6). This suggests a model where the combi-
natorial recognition of two separate ISEs promotes LCAT
intron 4 splicing. It is intriguing to consider that interactions
between the two ISEs could exist and represent an opportu-
nity for protein-protein interactions between the C-rich and
G-rich trans-factors, which could enhance intron recognition
to a greater extent than either ISE (or trans-factor) alone.
Combinatorial recognition of G-rich repeats with each other
has been reported [20,55,56], as has the combinatorial func-
tion of a G-rich ISS with upstream ESSs [54]. Here we show
that G-rich motifs can function in conjunction with C-rich
ISEs to promote splicing, showing the flexibility of the G-rich
motifs to function in different contexts.
We have also observed that the C-rich motifs can only par-
tially compensate in the place of G-rich motifs in LCAT intron
4 splicing, while G-rich motifs appear to fully compensate in
the place of C-rich motifs (Figure 7). It may be that the C-rich
motifs have a positional dependence while the G-rich motifs
do not. G-rich motifs appear to be the dominant ISE in LCAT
intron 4 splicing. G-rich motifs appear to be capable of allevi-
ating the need for C-rich motifs. The observation that C-rich
motifs only partially rescue splicing reinforces the model that
the C-rich motifs do not have the same enhancer strength as
the G-rich motifs.
An examination of the primary sequence and predicted sec-
ondary structure (using mfold [68]) of LCAT intron 4 sug-
gests that the intron could be folding into a stem-loop
structure with the G-rich and C-rich sequences base-pairing
(data not shown). While this is an intriguing model, when the
C-rich motifs are replaced with G-rich motifs (a mutation that
would abolish stem-loop formation; MUT 29, Figure 7), we
observe splicing similar to WT levels, suggesting that a stem-
loop structure is not contributing to the splicing of LCAT
intron 4.
Candidate protein factors for the G-rich and C-rich
ISEs
There are multiple candidate proteins that could be recogniz-
ing the G-rich and C-rich motifs present in LCAT intron 4. A
G-rich motif trans-factor, hnRNP H, has been identified and
shown to bind G-rich sequences and regulate splicing both
positively and negatively [54-56]. Several additional hnRNP
G-rich and C-rich motifs can functionally replace one another as ISEsFigure 7
G-rich and C-rich motifs can functionally replace one another as ISEs. (a) LCAT intron 4 with the mutations shown in blue above the WT sequence. BPS,
branchpoint. (b) Splicing of the LCAT intron 4 mini-genes (WT, MUT3, MUT7, MUT6, MUT 27, MUT 28 and MUT 29) in HeLa cells. Analysis was
performed as in Figure 4. (c) Graphical representation of the percent pre-mRNA for each LCAT mini-gene. Error bars represent standard deviation of
replicate experiments.
(a)
(c)
(b)
WT MUT3 MUT7 MUT6 MUT27 MUT28 MUT29
4 5
4 5
BPS
GTGAGTGTCTCTGCGGATGACCGGCTTGGGGTGGGGCAGGTGCCCCAGACCCCAGCTGCCCTG
A
CCCCTTCCACCCGCTGCAG
AAA
CRM1 CRM2
MUT3
AAA
MUT6
AAAAGACAAA
MUT4
GRM1
CCCTCCC
MUT28
MUT27
CCC
LCAT intron 4
MUT7
AAATAAA
MUT29
GGGAGACGGG
GRM2
WT MUT3 MUT7 MUT6 MUT27 MUT28 MUT29
1 2 3 4 5 6 7
5±1 19±5 23±1 19±3 12±3 10±1 5±3
25
10
20
15
5
0
Percentage of pre-mRNA
Genome Biology 2008, 9:R97
Genome Biology 2008, Volume 9, Issue 6, Article R97 Murray et al. R97.12
proteins, including hnRNPs A1, A2, and F, have also been
shown to bind G-rich RNA sequences [54,57-59]. An alterna-
tive model for G-rich sequence recognition involves RNA-
RNA interactions to promote U1 snRNP binding. G-triplets
near the 5'ss have been shown to bind the U1 snRNP by inter-
acting with the U1 snRNA and this interaction was shown to
be important for human alpha globin splicing in vivo [69].
hnRNP K and the α-CP proteins are the major poly-C-binding
proteins identified in mammalian cells [70,71]. Both hnRNP
K and several α-CP isoforms have been implicated in post-
transcriptional control [70]. There have also been two studies
that have implicated these proteins in splicing. hnRNP K was
shown to enhance the splicing of a chicken b-Tropomyosin
intron by binding a C-rich motif near the 5'ss [66]. A recent
study has shown that α-CP2 binds a C-rich patch upstream of
a weak PY tract in the human α-globin intron 1 transcript and
inhibits splicing of this intron in vitro [67]. This is in contrast
to our results with LCAT intron 4 where the C-rich motifs
function as splicing enhancers, not silencers. Several cis-ele-
Strengthening the PY tract eliminates the role of the C-rich motifsFigure 8
Strengthening the PY tract eliminates the role of the C-rich motifs. (a) LCAT intron 4 with the mutations shown in blue above the WT sequence. BPS,
branchpoint. (b) Splicing of the LCAT intron 4 mini-genes (WT, MUT6, MUT24, MUT24, MUT17, MUT20, MUT48, MUT49 and MUT 16B) in HeLa cells.
Analysis was performed as in Figure 4. (c) Graphical representation of the percent pre-mRNA for each LCAT mini-gene. Error bars represent standard
deviation of replicate experiments.
(a)
(c)
(b)
GTGAGTGTCTCTGCGGATGACCGGCTTGGGGTGGGGCAGGTGCCCCAGACCCCAGCTGCCCTGACCCCTTCCACCCGCTGCAG
WT MUT6 MUT24 MUT25 MUT17 MUT20 MUT48 MUT49 MUT16B
BPSCRM1 CRM2GRM1 GRM2
MUT6
AAAAGACAAA
AA
MUT16B
TTTTTT
MUT17
AAAAGACAAA TTTTTT
MUT20
WT MUT6 MUT24 MUT25 MUT17 MUT20 MUT48 MUT49 MUT16B
4 5
4 5
CRM3
1 2 3 4 5 6 7 8 9
5±1 19±3 3±1 5±1 11±47±3 8±333±5 50±6
AAATGGGGCAGGTGCAAAAGACAAA
MUT25
MUT24
AAATGGGGCAGGTGCAAA
AAATGGGGCAGGTGCAAAAGACAAA TTTTTT
AAATGGGGCAGGTGCAAA TTTTTT
MUT48
MUT49
Percentage of pre-mRNA
50
20
40
30
10
0
60
Genome Biology 2008, Volume 9, Issue 6, Article R97 Murray et al. R97.13
Genome Biology 2008, 9:R97
ments, including G-rich ISEs, have been shown to act as both
splicing enhancers and silencers [54-56,72]. The C-rich
motifs and their trans-factor may also possess the flexibility
to function as silencers and enhancers.
Role of the PY tract in splicing
Our results suggest a model where ISEs present upstream of
a weak PY tract compensate for a weakened U2AF65-RNA
interaction (Figure 10). In the case of LCAT intron 4, the G-
rich and C-rich motifs and the branchpoint sequence are
highly conserved and yet the PY tract is not well conserved. It
is possible that the presence of strong enhancers upstream of
the PY tract has allowed for greater degeneracy in the PY tract
region. In support of this model we have observed that when
the PY tract is strengthened to include a run of eight uridines,
mutation of both C-rich motifs or the cumulative mutation of
the G-rich and C-rich motifs no longer have an effect on LCAT
intron 4 splicing (Figure 8). The G-rich and C-rich motifs
appear dispensable in the presence of a strong PY tract. G-
rich motifs have previously been shown to be dispensable for
maximal splicing in the presence of a strengthened PY tract
[20]. These results suggest that strong U2AF65-PY tract
interactions alleviate the role of upstream ISEs.
An alternative model to weakened U2AF65-RNA interactions
is that a splicing factor other than U2AF65 binds the weak-
ened PY tracts. Recent work has shown that PUF60 plays a
role in splicing by interacting with the PY tract [29]. Our
observation that many of the weak PY tracts are particularly
C-rich leads us to propose that a C-rich binding protein may
function in this region. When we mutated a C-rich motif in
the LCAT intron 4 PY tract we observed a small effect on splic-
ing, suggesting that the C-rich motifs in the PY tract itself are
recognized by a trans-factor (Figure 8). It is possible that such
a splicing factor, be it U2AF65 or another protein, could be
functioning in conjunction with the factor(s) that recognize
the G-rich and C-rich ISEs upstream of the PY tract.
Conclusion
Novel mechanisms of intron recognition promote
splicing of introns with non-canonical PY tracts
The pool of introns containing low-scoring U2AF65 binding
sites represents a significant class of human introns lacking a
canonical splicing element. The ISEs identified and validated
here suggest that novel mechanisms exist in the cell for cop-
ing with weakened U2AF65-RNA interactions. Specifically,
we have observed that the interplay of multiple cis-elements,
in this case the G-rich and C-rich motifs, appears to be crucial
for the recognition of non-canonical introns. In the future we
plan to explore additional ISEs identified by this study to gain
a broader picture of how the splicing machinery functions in
the recognition of introns with weak PY tracts. While we have
focused our attention here on a single key canonical splicing
C-rich motifs function as ISEs in GNPTG intron 2Figure 9
C-rich motifs function as ISEs in GNPTG intron 2. (a) GNPTG intron 2 with the mutations shown in blue above the WT sequence and the putative
branchpoint sequence shown in bold. (b) Splicing of the GNPTG intron 2 mini-genes (WT and MUT) in HeLa cells. Splicing products (isolated from HeLa,
reverse-transcribed and amplified with radioactive PCR) were resolved on a 10% non-denaturing gel and scanned using a phosphorimager. The average
quantification and standard deviation of the percent pre-mRNA (pre-mRNA divided by total RNA) for triplicate reactions is reported below each lane. (c)
Graphical representation of the percent pre-mRNA for the WT and MUT GNPTG mini-genes. Error bars represent standard deviation of replicate
experiments.
(a)
(c)
MUT
MUT
60
40
20
0
WT
Percentage of pre-mRNA
80
GNPTG intron 2
GTGAGCAGCCTCGCGGGCTGGCGGCTCGAGCGGGGGACGGCCCGGGCCCGTTCCCCGCTG
ACTTGCCGCTTCCCGTAG
WT
(b)
2 3
2 3
29±6 63±5
MUT
GAACGGGAACGTTCAAC
Genome Biology 2008, 9:R97
Genome Biology 2008, Volume 9, Issue 6, Article R97 Murray et al. R97.14
element, the PY tract, we plan on extending our analyses and
expect to find that similar strategies exist for the recognition
of other classes of non-canonical pre-mRNAs.
Materials and methods
Computational prediction of strength of U2AF65
binding sites in PY tracts
The March 2006 human reference sequence (NCBI Build
36.1) in conjunction with the UCSC KnownGenes (hg18)
annotation database (Release 8 April 2007) [73] was used to
create a non-redundant database of human intronic
sequences. After excluding annotated introns that did not
begin with G [T/C] [A/G] and end with AG, and were less than
60 bases in length, we were left with 171,475 unique acceptor
ends.
In order to score PY tracts according to their likely affinity
towards U2AF65, we developed a score that reflects the level
of similarity of the PY tract sequence to the sequences that
were enriched in RNAs derived from in vitro SELEX experi-
ments using human U2AF65. In particular, if we let the fre-
quency of occurrence of an n-mer n of length k within the
SELEX sequences be represented by f
n
, then for a subject
sequence of length L the S
65
score is determined according to:
where f
n
represents the frequency (within the SELEX popula-
tion) of the n-mer found at position i in the subject sequence.
The term is a log-odds representation of the
degree to which the particular n-mer was enriched within the
SELEX sequences. Since the SELEX experiment began with
uniformly random sequences, the denominator is simply the
expectation for random occurrence of an n-mer of length k.
For this study we chose the n-mer length to be five and the
SELEX data were those reported in Singh et al. [27] and both
SELEX experiments reported in Banerjee et al. [39]. The
frequency of occurrence for all pentamers within these
sequences is shown in Additional data file 1. Introns with
'strong' PY tracts (that is, expected to have high affinity for
U2AF65) were defined to be those that are above the median
value for all introns (0.811). All but one of the RNAs derived
from in vitro SELEX had S
65
scores above this value.
Identification of intronic motifs over-represented
upstream of weak PY tracts
In order to avoid biases due to long interspersed repetitive
elements (LINEs) and short interspersed repetitive elements
(SINEs), repetitive elements in the intronic sequence data-
base (obtained as described above) were masked using the
masking coordinates associated with the UCSC hg18 annota-
tion database (Release 8 April 2007) [73]. However, simple
repeats (many of which resemble known hnRNP binding
sites) were not masked. The intronic acceptor sequences were
then separated according to their GC content within the last
100 bases (or last half if the intron was less than 200 bases in
length). AT-rich introns were defined to be introns containing
less than 50% GC content. GC-rich introns were defined to be
those containing greater than or equal to 50% GC content.
For each of these data sets, the occurrence of all n-mers (4-7
nucleotides) in the 50 nucleotide region from -80 to -30 (rel-
ative to the acceptor splice-junction) were determined using
a sliding window. These counts were used to determine the
background expectations for each n-mer. The occurrence of
each 4-7 nucleotide n-mer within the equivalent region for all
introns possessing 'weak' PY tracts (defined as above) was
determined using a sliding window. From these values, n-
mers that are enriched upstream of the branchpoint region
for introns possessing weak PY tracts was determined using
the binomial confidence interval method described in Voelker
and Berglund [52]. For the AT-rich class, 99 n-mers were
ISEs compensate for a weakened PY tractFigure 10
ISEs compensate for a weakened PY tract. The four factors present in the
early (E) complex (U1 snRNP, SF1, U2AF65 and U2AF35) recognize the
four canonical intronic splicing elements (the 5' splice site, the branchpoint
(BPS), the PY tract and the 3' splice site). During A complex formation,
which follows E complex, the U2 snRNP is recruited by U2AF65 and
replaces SF1 at the branchpoint. There are presumably multiple redundant
pathways that compensate for weak U2AF65-PY tract interactions,
including bridging interactions between SF1, U2AF65 and U2AF35,
alternative PY tract binding proteins (shown here as factor 'P'), and
pathways involving additional non-canonical motifs such as ESEs or ISEs.
We propose that ISEs in the region upstream of a weak PY tract
(nucleotides -30 to -80) are important for recognizing introns with weak
PY tracts. Specifically, we have shown that G-rich and C-rich motifs are
ISEs that compensate for weakened U2AF65-PY tract interactions. Factors
X and Y represent proteins binding the compensating ISEs. We propose
that ISE-factor X/Y interactions can compensate for weak PY tract-
U2AF65 interactions and help recruit the U2 snRNP to the branchpoint.
The dash (//) indicates the variable length between the 5' splice site and 3'
end of the intron.
BPS
exon exon
SF1
U2AF65
35
U1
U2
ISE ESE
G-rich C-rich
X
PY tract
weak
ESE ISE
–80 to –30 region
A
F
6
5
5
Y
Y
P
S
f
n
i
k
i
iLk
Lk
65
1
4
0
1
1
=
⎛
⎝
⎜
⎜
⎜
⎜
⎞
⎠
⎟
⎟
⎟
⎟
=
=−+
∑
−+
ln
ln
f
n
i
k
1
4
⎛
⎝
⎜
⎜
⎜
⎞
⎠
⎟
⎟
⎟
Genome Biology 2008, Volume 9, Issue 6, Article R97 Murray et al. R97.15
Genome Biology 2008, 9:R97
determined to be significantly enriched (P < 0.01), and 349 n-
mers were determined to be significantly enriched for the GC-
rich class. Enriched n-mers and corresponding counts and
statistics are available in Additional data files 2 and 3.
Enriched n-mers were used to construct motifs as in Voelker
and Berglund [52]. All of the derived motifs and the identities
and occurrences of all n-mers that were used to construct the
motifs are available in Additional data files 4 and 5.
U2AF65 binding
RNA oligonucleotides (listed in Figure 2b, IDT, Integrated
DNA Technologies, San Diego, CA, USA) for U2AF65 binding
assays were 5' end-labeled with γ-
32
P ATP using T4 polynucle-
otide kinase (NEB, Ipswich, MA, USA) for 30 minutes at
37°C. The RNAs were then gel purified using an 8% denatur-
ing gel, eluted from the gel in 0.3M Na acetate and ethanol
precipitated. The resulting pellet was resuspended in nanop-
ure water and purified with a Bio-spin 6 column (BioRad,
Hercules, CA, USA) equilibrated with nanopure water. The
radioactivity level of the purified RNA solution was deter-
mined by scintillation. Gel-shift binding assays were
performed using varying concentrations of recombinant
human U2AF65 with constant amounts of radiolabeled RNA
oligonucleotides as previously described [49]. The Ensembl
gene accession numbers for the genes addressed in this study
are: BRUNOL4 [ENSEMBL: ENSG00000101489], INSR
[ENSEMBL: ENSG00000171105], LCAT [ENSEMBL: ENSG
00000124067], MBNL1 [ENSEMBL: ENSG00000152601],
SR140 [ENSEMBL: ENSG00000163714], and U2AF2
[ENSEMBL: ENSG00000063244].
Cloning of mini-genes and mutants
WT LCAT intron 4 mini-gene was cloned from HeLa genomic
DNA using primers to amplify the region between the last 50
nucleotides of LCAT intron 3 to the first 50 nucleotides of
LCAT intron 5 (502 nucleotides). The forward primer
included a BamH1 site and the reverse primer included an
EcoR1 site. The amplified genomic DNA was cut with BamH1
and EcoR1, inserted into pcDNA3 and sequenced. LCAT
intron 4 mutants were made by PCR using the WT LCAT 4
mini-gene as template and primers containing the mutation
of interest. LCAT intron 4 mutants were also cloned into
pcDNA3 using BamH1 and EcoR1 and sequenced. The WT
and mutant GNPTG [ENSEMBL: ENSG00000090581]
intron 2 mini-genes were cloned using overlapping primers to
create a sequence containing exon 2, intron 2 and exon 3. This
sequence was flanked by cut sites HindIII and Not1, cloned
into pcDNA3 and sequenced.
In vivo splicing assays: cell culture, transfection, and
harvesting
HeLa cells were grown in monolayers in DMEM with
GLUTAMAX (Invitrogen, Carlsbad, CA, USA) and supple-
mented with 10% fetal bovine serum (GIBCO). For the LCAT
splicing experiments 1.5 (± 0.2) × 10
5
cells were plated in 6-
well plates and transfected 18-20 h later at approximately
70% confluency. Plasmid (1 μg) was transfected into each well
of cells using 5 μl of Lipofectin (Invitrogen, Carlsbad, CA,
USA) and 10 μl of Plus reagent (Invitrogen) according to the
manufacturer's protocols. For the GNPTG splicing experi-
ments, 2 × 10
5
cells were plated in 6-well plates and trans-
fected with 1 μg plasmid 18-20 h later using 5 μl of
Lipofectamine 2000. Cells were harvested 24 h (LCAT exper-
iments) or 16 h (GNPTG experiments) after transfection
using TriplE (GIBCO) and then pelleted by centrifugation.
RNA was isolated from the cell pellets using an RNeasy kit
(QIAGEN, Valencia, CA, USA).
In vivo splicing assays: DNAsing, reverse transcription,
PCR, and quantifying percent mRNA
Isolated RNA (500 ng) was incubated with 1 unit of RQI
DNase (Promega, Madison, WI, USA) in a 10 μl reaction for 2
h (LCAT experiments) or 1 h (GNPTG experiments) according
to the manufacturer's protocol. DNAsed RNA (2 μl (100 ng))
was reverse transcribed in a 10 μl reaction (1:5 dilution) using
Superscript II and an LCAT-specific reverse primer or a
reverse primer to the pCDNA3 SP6 sequence for the GNPTG
experiments, according to manufacturer's protocols with the
exception that we used half the recommended amount of
Superscript II (Invitrogen, Carlsbad, CA, USA). For the LCAT
splicing experiments, 2 μl of the reverse transcription reac-
tion was subjected to 20 rounds of PCR amplification in a 20
μl reaction (1:10 dilution) using LCAT specific primers spiked
with a kinased LCAT forward primer (0.4 nM). Twenty
rounds of PCR were found to be within the linear range for
this PCR experiment (data not shown). The resulting PCR
products were run on an 8% (19:1) polyacrylamide native gel.
For the GNPTG splicing experiments, 2 μl of the reverse tran-
scription reaction was subjected to 27 rounds of PCR amplifi-
cation in a 20 μl reaction (1:10 dilution) using primers specific
to the T7 (forward) and SP6 (reverse) sequences of the
pcDNA3 plasmid spiked with kinased T7 forward primer.
Twenty-seven rounds of PCR were found to be within the lin-
ear range for this PCR experiment (data not shown). The
resulting PCR products were run on a 10% (19:1) polyacryla-
mide gel. The gels were dried and exposed overnight to a
phosphorimager screen. Quantification of the radioactive
bands was performed using ImageQuant software (GE
Healthcare, London, UK). The percent pre-mRNA was calcu-
lated by dividing the amount of the pre-mRNA band by the
total amount of the pre-mRNA and mRNA bands and multi-
plying by 100%.
Abbreviations
ADML, adenovirus major late; CRM, C-rich motif; ESE,
exonic splicing enhancer; ESS, exonic splicing silencer;
GNPTG, N-acetylglucosamine-1-phosphotransferase gamma
subunit; GRM, G-rich motif; hnRNP, heterogeneous nuclear
ribonucleoproteins; ISE, intronic splicing enhancer; ISS,
intronic splicing silencer; LCAT, lecithin cholesterol
acyltransferase; PY tract, polypyrimidine tract; S
65
score,
Genome Biology 2008, 9:R97
Genome Biology 2008, Volume 9, Issue 6, Article R97 Murray et al. R97.16
U2AF65 binding site score; SF, splicing factor; snRNP, small
nuclear ribonucleoprotein; ss, splice site; U2AF, U2 snRNP
auxilliary factor; WT, wild-type.
Authors' contributions
JIM and RBV designed experiments, performed experiments,
analyzed data and wrote the paper. KLH and MBW
performed experiments and analyzed data. JAB designed
experiments, analyzed data and wrote the paper.
Additional data files
The following additional data files are available with the
online version of this paper. Additional data file 1 is a table
listing the probability of occurrence for pentamers found in
U2AF65 SELEX derived sequences. Additional data file 2 is a
table listing the n-mers enriched upstream of weak PY tracts
from GC-rich introns. Additional data file 3 is a table listing
the n-mers enriched upstream of weak PY tracts from AT-rich
introns. Additional data file 4 is a table listing the clusters
enriched upstream of weak PY tracts from GC-rich introns.
Additional data file 5 is a table listing the clusters enriched
upstream of weak PY tracts from AT-rich introns. Additional
data file 6 is a figure of the scatterplots of Z-scores for enrich-
ment upstream of weak PY tracts for long versus short
introns. Additional data file 7 is a histogram showing the per-
centage of introns possessing specific n-mers that are
enriched upstream of weak PY tracts
Additional data file 1Probability of occurrence for pentamers found in U2AF65 SELEX derived sequencesTable listing the count and the probability of occurrence (using a sliding window) for all pentamers found in the sequences reported in Singh et al. [27] and both SELEX experiments reported in Ban-erjee et al. [39].Click here for fileAdditional data file 2N-mers enriched upstream of weak PY tracts from GC-rich intronsAssociated statistics and listing of n-mers (4-7 nucleotides) deter-mined to be enriched in the 50 nucleotide region upstream of weak PY tracts from GC-rich introns.Click here for fileAdditional data file 3N-mers enriched upstream of weak PY tracts from AT-rich intronsAssociated statistics and listing of n-mers (4-7 nucleotides) deter-mined to be enriched in the 50 nucleotide region upstream of weak PY tracts from AT-rich introns.Click here for fileAdditional data file 4Clusters enriched upstream of weak PY tracts from GC-rich intronsListing of all clusters derived from n-mers enriched in the 50 nucleotide region upstream of weak PY tracts from GC-rich introns. Included are the individual n-mers and associated statistics used to produce each motif.Click here for fileAdditional data file 5Clusters enriched upstream of weak PY tracts from AT-rich intronsListing of all clusters derived from n-mers enriched in the 50 nucleotide region upstream of weak PY tracts from AT-rich introns. Included are the individual n-mers and associated statistics used to produce each motif.Click here for fileAdditional data file 6Scatterplots of Z-scores for enrichment upstream of weak PY tracts for long versus short intronsThe Z-scores for enrichment of all 4-7 nucleotide n-mers in the intronic region upstream (-80 to -30 relative to the acceptor splice-junction) of PY tracts with low S
65
scores for short (<200 nucleo-tide) introns is plotted versus long (≥ 200 nucleotide) introns. (a) Data for GC-rich introns. (b) Data for AT-rich introns.Click here for fileAdditional data file 7Histograms showing the percentage of the -80 to -30 region of introns that matches one or more enriched n-mersThe portion of the sequence corresponding to the -80 to -30 region matching one or more of the n-mers enriched in the same region for introns with weak PY tracts (Additional data files 2 and 3) was determined. These values (referred to as the percent coverage) were binned as indicated along the x-axis.Click here for file
Acknowledgements
JIM was supported by an AHA Pacific Mountain Affiliate pre-doctoral fel-
lowship. KLH was supported by a NSF graduate research fellowship. MBW
was supported by NIH training grant GM-07759, to the Institute of Molec-
ular Biology at the University of Oregon. This work was supported by NSF
grant 0616264-MCB to JAB. We thank members of the Berglund lab for
helpful discussion.
References
1. Will CL, Lührmann R: Spliceosome structure and function. In
The RNA World 3rd edition. Edited by: Gesteland R, Cech T, Atkins J.
Cold Spring Harbor, New York Cold Spring Harbor Laboratory
Press; 2006:369-400.
2. Staley JP, Guthrie C: Mechanical devices of the spliceosome:
motors, clocks, springs, and things. Cell 1998, 92:315-326.
3. Burge CB, Tuschl T, Sharp P: Splicing of precursors to mRNA by
the spliceosome. In The RNA World 2nd edition. Edited by: Geste-
land R, Cech T, Atkins J. Cold Spring Harbor, New York: Cold Spring
Harbor Laboratory Press; 1999:525-560.
4. Krawczak M, Reiss J, Cooper DN: The mutational spectrum of
single base-pair substitutions in mRNA splice junctions of
human genes: causes and consequences. Hum Genet 1992,
90:41-54.
5. Faustino NA, Cooper TA: Pre-mRNA splicing and human
disease. Genes Dev 2003, 17:419-437.
6. Wang GS, Cooper TA: Splicing in disease: disruption of the
splicing code and the decoding machinery. Nat Rev Genet 2007,
8:749-761.
7. Black DL: Mechanisms of alternative pre-messenger RNA
splicing. Annu Rev Biochem 2003, 72:291-336.
8. Mount SM, Pettersson I, Hinterberger M, Karmas A, Steitz JA: The
U1 small nuclear RNA-protein complex selectively binds a 5'
splice site in vitro. Cell 1983, 33:509-518.
9. Seraphin B, Rosbash M: Identification of functional U1 snRNA-
pre-mRNA complexes committed to spliceosome assembly
and splicing. Cell 1989, 59:349-358.
10. Berglund JA, Chua K, Abovich N, Reed R, Rosbash M: The splicing
factor BBP interacts specifically with the pre-mRNA branch-
point sequence UACUAAC. Cell 1997, 89:781-787.
11. Berglund JA, Abovich N, Rosbash M: A cooperative interaction
between U2AF65 and mBBP/SF1 facilitates branchpoint
region recognition. Genes Dev 1998, 12:858-867.
12. Zamore PD, Green MR: Identification, purification, and bio-
chemical characterization of U2 small nuclear ribonucleo-
protein auxiliary factor. Proc Natl Acad Sci USA
1989,
86:9243-9247.
13. Zamore PD, Green MR: Biochemical characterization of U2
snRNP auxiliary factor: an essential pre-mRNA splicing fac-
tor with a novel intranuclear distribution. EMBO J 1991,
10:207-214.
14. Zorio DA, Blumenthal T: Both subunits of U2AF recognize the
3' splice site in Caenorhabditis elegans. Nature 1999,
402:835-838.
15. Wu S, Romfo CM, Nilsen TW, Green MR: Functional recognition
of the 3' splice site AG by the splicing factor U2AF35. Nature
1999, 402:832-835.
16. Merendino L, Guth S, Bilbao D, Martinez C, Valcarcel J: Inhibition of
msl-2 splicing by Sex-lethal reveals interaction between
U2AF35 and the 3' splice site AG. Nature 1999, 402:838-841.
17. Gozani O, Potashkin J, Reed R: A potential role for U2AF-SAP
155 interactions in recruiting U2 snRNP to the branch site.
Mol Cell Biol 1998, 18:4752-4760.
18. Cass DM, Berglund JA: The SF3b155 N-terminal domain is a
scaffold important for splicing. Biochemistry 2006,
45:10092-10101.
19. Berget SM: Exon recognition in vertebrate splicing. J Biol Chem
1995, 270:2411-2414.
20. McCullough AJ, Berget SM: G triplets located throughout a class
of small vertebrate introns enforce intron borders and regu-
late splice site selection. Mol Cell Biol 1997, 17:4562-4571.
21. Blencowe BJ: Exonic splicing enhancers: mechanism of action,
diversity and role in human genetic diseases. Trends Biochem
Sci 2000, 25:106-110.
22. Cartegni L, Chew SL, Krainer AR: Listening to silence and under-
standing nonsense: exonic mutations that affect splicing. Nat
Rev Genet 2002, 3:
285-298.
23. Ladd AN, Cooper TA: Finding signals that regulate alternative
splicing in the post-genomic era. Genome Biol 2002,
3:reviews0008.
24. Matlin AJ, Clark F, Smith CW: Understanding alternative
splicing: towards a cellular code. Nat Rev Mol Cell Biol. 2005,
6:386-398.
25. Pozzoli U, Sironi M: Silencers regulate both constitutive and
alternative splicing events in mammals. Cell Mol Life Sci 2005,
62:1579-1604.
26. Zheng ZM: Regulation of alternative RNA splicing by exon
definition and exon sequences in viral and mammalian gene
expression. J Biomed Sci 2004, 11:278-294.
27. Singh R, Valcarcel J, Green MR: Distinct binding specificities and
functions of higher eukaryotic polypyrimidine tract-binding
proteins. Science 1995, 268:1173-1176.
28. Pacheco TR, Coelho MB, Desterro JM, Mollet I, Carmo-Fonseca M:
In vivo requirement of the small subunit of U2AF for recog-
nition of a weak 3' splice site. Mol Cell Biol 2006, 26:8183-8190.
29. Hastings ML, Allemand E, Duelli DM, Myers MP, Krainer AR: Control
of pre-mRNA splicing by the general splicing factors PUF60
and U2AF65. PLoS ONE 2007, 2:e538.
30. Sridharan V, Singh R: A conditional role of U2AF in splicing of
introns with unconventional polypyrimidine tracts. Mol Cell
Biol 2007, 27:7334-7344.
31. Huang T, Vilardell J, Query CC: Pre-spliceosome formation in S.
pombe requires a stable complex of SF1-U2AF(59)-
U2AF(23). EMBO J 2002, 21:5516-5526.
32. Henscheid KL, Voelker RB, Berglund JA: Alternative modes of
binding by U2AF65 at the polypyrimidine tract. Biochemistry
2007, 47:449-459.
33. Graveley BR: Sorting out the complexity of SR protein
functions. Rna
2000, 6:1197-1211.
34. Tian M, Maniatis T: A splicing enhancer complex controls
alternative splicing of doublesex pre-mRNA. Cell 1993,
Genome Biology 2008, Volume 9, Issue 6, Article R97 Murray et al. R97.17
Genome Biology 2008, 9:R97
74:105-114.
35. Wu JY, Maniatis T: Specific interactions between proteins
implicated in splice site selection and regulated alternative
splicing. Cell 1993, 75:1061-1070.
36. Zuo P, Maniatis T: The splicing factor U2AF35 mediates critical
protein-protein interactions in constitutive and enhancer-
dependent splicing. Genes Dev 1996, 10:1356-1368.
37. Kuivenhoven JA, Weibusch H, Pritchard PH, Funke H, Benne R, Ass-
mann G, Kastelein JJ: An intronic mutation in a lariat branch-
point sequence is a direct cause of an inherited human
disorder (fish-eye disease). J Clin Invest 1996, 98:358-364.
38. Ruskin B, Zamore PD, Green MR: A factor, U2AF, is required for
U2 snRNP binding and splicing complex assembly. Cell 1988,
52:207-219.
39. Banerjee H, Rahn A, Gawande B, Guth S, Valcarcel J, Singh R: The
conserved RNA recognition motif 3 of U2 snRNA auxiliary
factor (U2AF 65) is essential in vivo but dispensable for activ-
ity in vitro. Rna 2004, 10:240-253.
40. Roscigno RF, Weiner M, Garcia-Blanco MA: A mutational analysis
of the polypyrimidine tract of introns. Effects of sequence
differences in pyrimidine tracts on splicing. J Biol Chem 1993,
268:11222-11229.
41. Coolidge CJ, Seely RJ, Patton JG: Functional analysis of the
polypyrimidine tract in pre-mRNA splicing. Nucleic Acids Res
1997, 25:888-896.
42. Nussinov R: Conserved quartets near 5' intron junctions in
primate nuclear pre-mRNA. J Theor Biol 1988, 133:73-84.
43. Zhang XH, Heller KA, Hefter I, Leslie CS, Chasin LA: Sequence
information for the splicing of human pre-mRNA identified
by support vector machine classification. Genome Res 2003,
13:
2637-2650.
44. Berg OG, von Hippel PH: Selection of DNA binding sites by reg-
ulatory proteins. Statistical-mechanical theory and applica-
tion to operators and promoters. J Mol Biol 1987, 193:723-750.
45. Stormo GD: DNA binding sites: representation and discovery.
Bioinformatics (Oxford, England) 2000, 16:16-23.
46. MacIsaac KD, Fraenkel E: Practical strategies for discovering
regulatory DNA sequence motifs. PLoS Comput Biol. 2006, 2:e36.
47. GuhaThakurta D: Computational identification of transcrip-
tional regulatory elements in DNA sequence. Nucleic Acids Res
2006, 34:3585-3598.
48. Gooding C, Clark F, Wollerton MC, Grellscheid SN, Groom H, Smith
CW: A class of human exons with predicted distant branch
points revealed by analysis of AG dinucleotide exclusion
zones. Genome Biol 2006, 7:R1.
49. Henscheid KL, Shin DS, Cary SC, Berglund JA: The splicing factor
U2AF65 is functionally conserved in the thermotolerant
deep-sea worm Alvinella pompejana. Biochim Biophys Acta 2005,
1727:197-207.
50. Zhang XH, Leslie CS, Chasin LA: Dichotomous splicing signals in
exon flanks. Genome Res 2005, 15:768-779.
51. Fox-Walsh KL, Dou Y, Lam BJ, Hung SP, Baldi PF, Hertel KJ: The
architecture of pre-mRNAs affects mechanisms of splice-site
pairing. Proc Natl Acad Sci USA 2005, 102:16176-16181.
52. Voelker RB, Berglund JA: A comprehensive computational
characterization of conserved mammalian intronic
sequences reveals conserved motifs associated with consti-
tutive and alternative splicing. Genome Res 2007, 17:1023-1033.
53. Kralovicova J, Vorechovsky I: Position-dependent repression
and promotion of DQB1 intron 3 splicing by GGGG motifs.
J Immunol 2006, 176:2381-2388.
54. Han K, Yeo G, An P, Burge CB, Grabowski PJ: A combinatorial
code for splicing silencing: UAGG and GGGG motifs. PLoS
Biol
2005, 3:e158.
55. Garneau D, Revil T, Fisette JF, Chabot B: Heterogeneous nuclear
ribonucleoprotein F/H proteins modulate the alternative
splicing of the apoptotic mediator Bcl-x. J Biol Chem 2005,
280:22641-22650.
56. Marcucci R, Baralle FE, Romano M: Complex splicing control of
the human Thrombopoietin gene by intronic G runs. Nucleic
Acids Res 2007, 35:132-142.
57. Alkan SA, Martincic K, Milcarek C: The hnRNPs F and H2 bind to
similar sequences to influence gene expression. Biochem J
2006, 393:361-371.
58. Burd CG, Dreyfuss G: RNA binding specificity of hnRNP A1:
significance of hnRNP A1 high-affinity binding sites in pre-
mRNA splicing. EMBO J 1994, 13:1197-1204.
59. Sofola OA, Jin P, Qin Y, Duan R, Liu H, de Haro M, Nelson DL, Botas
J: RNA-binding proteins hnRNP A2/B1 and CUGBP1 sup-
press fragile X CGG premutation repeat-induced neurode-
generation in a Drosophila model of FXTAS. Neuron 2007,
55:565-571.
60. Yeo G, Hoon S, Venkatesh B, Burge CB: Variation in sequence
and organization of splicing regulatory elements in verte-
brate genes. Proc Natl Acad Sci USA 2004, 101:15700-15705.
61. Marquis J, Paillard L, Audic Y, Cosson B, Danos O, Le Bec C, Osborne
HB: CUG-BP1/CELF1 requires UGU-rich sequences for high-
affinity binding. Biochem J 2006, 400:291-301.
62. Helfman DM, Ricci WM: Branch point selection in alternative
splicing of tropomyosin pre-mRNAs. Nucleic Acids Res 1989,
17:5633-5650.
63. Smith CW, Nadal-Ginard B: Mutually exclusive splicing of alpha-
tropomyosin exons enforced by an unusual lariat branch
point location: implications for constitutive splicing. Cell
1989, 56:749-758.
64. Goux-Pelletan M, Libri D, d'Aubenton-Carafa Y, Fiszman M, Brody E,
Marie J: In vitro splicing of mutually exclusive exons from the
chicken beta-tropomyosin gene: role of the branch point
location and very long pyrimidine stretch. EMBO J 1990,
9:241-249.
65. Lim LP, Burge CB: A computational analysis of sequence fea-
tures involved in recognition of short introns. Proc Natl Acad
Sci USA 2001, 98:11193-11198.
66. Expert-Bezancon A, Le Caer JP, Marie J: Heterogeneous nuclear
ribonucleoprotein (hnRNP) K is a component of an intronic
splicing enhancer complex that activates the splicing of the
alternative exon 6A from chicken beta-tropomyosin pre-
mRNA. J Biol Chem 2002, 277:16614-16623.
67. Ji X, Kong J, Carstens RP, Liebhaber SA: The 3' untranslated
region complex involved in stabilization of human alpha-
globin mRNA assembles in the nucleus and serves an inde-
pendent role as a splice enhancer. Mol Cell Biol 2007,
27:3290-3302.
68. Zuker M: Mfold web server for nucleic acid folding and hybrid-
ization prediction. Nucleic Acids Res 2003, 31:3406-3415.
69. McCullough AJ, Berget SM: An intronic splicing enhancer binds
U1 snRNPs to enhance splicing and select 5' splice sites. Mol
Cell Biol 2000, 20:9225-9235.
70. Makeyev AV, Liebhaber SA: The poly(C)-binding proteins: a
multiplicity of functions and a search for mechanisms. Rna
2002, 8:265-278.
71. Thisted T, Lyakhov DL, Liebhaber SA: Optimized RNA targets of
two closely related triple KH domain proteins, heterogene-
ous nuclear ribonucleoprotein K and alphaCP-2KL, suggest
distinct modes of RNA recognition. J Biol Chem 2001,
276:17484-17496.
72. Ule J, Stefani G, Mele A, Ruggiu M, Wang X, Taneri B, Gaasterland T,
Blencowe BJ, Darnell RB: An RNA map predicting Nova-
dependent splicing regulation. Nature 2006, 444:580-586.
73. UCSC KnownGenes (hg18) Annotation Database [http://
hgdownload.cse.ucsc.edu/goldenPath/hg18/database]