Báo cáo y học: "Modulation of gene expression in drug resistant Leishmania is associated with gene amplification, gene deletion and chromosome aneuploidy" ppsx
Bạn đang xem bản rút gọn của tài liệu. Xem và tải ngay bản đầy đủ của tài liệu tại đây (1.08 MB, 16 trang )
Genome Biology 2008, 9:R115
Open Access
2008Ubedaet al.Volume 9, Issue 7, Article R115
Research
Modulation of gene expression in drug resistant Leishmania is
associated with gene amplification, gene deletion and chromosome
aneuploidy
Jean-Michel Ubeda
*
, Danielle Légaré
*
, Frédéric Raymond
*†
,
Amin Ahmed Ouameur
*
, Sébastien Boisvert
†
, Philippe Rigault
†
,
Jacques Corbeil
*†
, Michel J Tremblay
*
, Martin Olivier
‡
,
Barbara Papadopoulou
*
and Marc Ouellette
*
Addresses:
*
Université Laval, Division de Microbiologie, Centre de Recherche en Infectiologie, boulevard Laurier, Québec, G1V 4G2, Canada.
†
Université Laval, Centre de Recherche en Endocrinologie Moléculaire et Oncologique, boulevard Laurier, Québec, G1V 4G2, Canada.
‡
McGill
University, Department of Microbiology and Immunology, Lyman Duff Medical Building, University Street, Montreal, H3A 2B4, Canada.
Correspondence: Marc Ouellette. Email:
© 2008 Ubeda et al.; licensee BioMed Central Ltd.
This is an open access article distributed under the terms of the Creative Commons Attribution License ( which
permits unrestricted use, distribution, and reproduction in any medium, provided the original work is properly cited.
Leishmania drug resistance<p>Gene expression and DNA copy number analyses using full genome oligonucleotide microarrays of <it>Leishmania</it> reveal molec-ular mechanisms of methotrexate resistance.</p>
Abstract
Background: Drug resistance can be complex, and several mutations responsible for it can co-
exist in a resistant cell. Transcriptional profiling is ideally suited for studying complex resistance
genotypes and has the potential to lead to novel discoveries. We generated full genome 70-mer
oligonucleotide microarrays for all protein coding genes of the human protozoan parasites
Leishmania major and Leishmania infantum. These arrays were used to monitor gene expression in
methotrexate resistant parasites.
Results: Leishmania is a eukaryotic organism with minimal control at the level of transcription
initiation and few genes were differentially expressed without concomitant changes in DNA copy
number. One exception was found in Leishmania major, where the expression of whole
chromosomes was down-regulated. The microarrays highlighted several mechanisms by which the
copy number of genes involved in resistance was altered; these include gene deletion, formation of
extrachromosomal circular or linear amplicons, and the presence of supernumerary
chromosomes. In the case of gene deletion or gene amplification, the rearrangements have
occurred at the sites of repeated (direct or inverted) sequences. These repeats appear highly
conserved in both species to facilitate the amplification of key genes during environmental changes.
When direct or inverted repeats are absent in the vicinity of a gene conferring a selective
advantage, Leishmania will resort to supernumerary chromosomes to increase the levels of a gene
product.
Conclusion: Aneuploidy has been suggested as an important cause of drug resistance in several
organisms and additional studies should reveal the potential importance of this phenomenon in
drug resistance in Leishmania.
Published: 18 July 2008
Genome Biology 2008, 9:R115 (doi:10.1186/gb-2008-9-7-r115)
Received: 25 February 2008
Revised: 6 June 2008
Accepted: 18 July 2008
The electronic version of this article is the complete one and can be
found online at />Genome Biology 2008, 9:R115
Genome Biology 2008, Volume 9, Issue 7, Article R115 Ubeda et al. R115.2
Background
The protozoan parasite Leishmania is distributed worldwide
and is responsible for a wide spectrum of diseases, including
cutaneous, mucocutaneous and visceral leishmaniasis. No
vaccines are presently available against Leishmania infec-
tions [1] and treatments rely primarily on chemotherapy. The
chemotherapeutic arsenal is limited and resistance to the
mainstay of pentavalent antimonials has reached epidemic
proportions in parts of India [2]. Several studies dealing with
drug resistance in Leishmania have highlighted the plasticity
of the Leishmania genome [3,4]. The antifolate methotrexate
(MTX) has been one of the first and most widely used drugs
for understanding drug-induced plasticity and resistance
mechanisms [5-8]. While Leishmania is sensitive to MTX, the
drug is not used clinically to treat leishmaniasis. However,
Leishmania is a folic acid auxotroph and studies of MTX
resistance mechanisms have highlighted several novel
aspects of folate metabolism in this parasite that could be
exploited for drug interventions [9,10]. Indeed, the develop-
ment of novel antifolate molecules for Leishmania and
related parasites has been ongoing in several laboratories [11-
13].
Leishmania resists MTX by a number of mechanisms. Leish-
mania has the capacity to transport folic acid, but this activity
is often impaired in MTX resistant cells [8,14-17]. The main
Leishmania folate transporter FT1 has been isolated [18,19]
and is part of a large family of folate biopterin transporter
(FBT) proteins with 14 members in Leishmania (AA Oua-
meur et al., unpublished data). Rearrangements of FBT genes
are correlated with MTX resistance [19-21]. A frequent mech-
anism of drug resistance in Leishmania is gene amplification
[3]. Small chromosomal regions of 20-70 kb that are part of
one of the 36 Leishmania chromosomes are amplified as part
of extrachromosomal elements [3]. These elements are usu-
ally formed by recombination between repeated homologous
sequences [22-24]. Amplification of the gene coding for the
target dihydrofolate reductase-thymidylate synthase (DHFR-
TS) has been described in MTX resistant parasites [5,6,25-
29]. Work on MTX resistance also led to the characterization
of the pteridine reductase PTR1, whose main function is to
reduce pterins. However, when overexpressed it can also
reduce folic acid and lead to MTX resistance by by-passing
DHFR-TS activity [30-33]. The PTR1 gene is frequently
amplified as part of extrachromosomal circular or linear
amplicons [6,16,22,34-38]. In addition to these three main
mechanisms of resistance, perturbation in folate metabolism
[39,40], in one carbon metabolism [41] or in DNA metabo-
lism [42] have also been associated with MTX resistance. Sev-
eral of these mutations can co-exist in the same cell,
demonstrating that resistance can be a complex multi-gene
phenomenon. Genome wide expression profiling scans repre-
sent a useful tool for understanding complex resistance
mechanisms and may lead either to the discovery of novel
resistance mechanisms and/or could provide clues about
mechanisms of gene rearrangements.
Indeed, DNA microarrays have been useful for investigating
the mode of action of drugs [43] and mechanisms of resist-
ance (reviewed in [44-46]). DNA microarrays for Leishmania
have evolved from random genomic DNA clones [47-50],
cDNA clones [51,52], targeted PCR fragments [29], selected
70-mer oligonucleotides [53,54] to full genome microarrays
[55,56]. Targeted microarrays have been used previously for
the study of drug resistance in Leishmania [29,52,54,57]. We
present here the generation of full genome DNA microarrays
for both L. major and L. infantum and their use in the study
of one L. major and one L. infantum MTX resistant mutant.
These genome wide expression profiling experiments illus-
trate the complexity of resistance mechanisms present in the
same cell. They allowed the definition of the precise mecha-
nisms leading to the formation of extrachromosomal circular
and linear amplicons, the definition of gene deletion events
and revealed the involvement of aneuploidy in the complex
genotype of MTX resistance.
Results
RNA expression profiling in methotrexate resistant
Leishmania cells
Completion of the L. major genome has allowed the genera-
tion of arrays containing 60-mer oligonucleotide probes
designed by NimbleGen Systems [55,56] and in this work, we
present the generation of a full genome DNA microarray com-
posed of 70-mer oligonucleotide probes suitable for both L.
major and L. infantum analysis (see Materials and methods
for a full description of the arrays). These full genome arrays
were used for deciphering how Leishmania resists the anti-
folate model drug MTX. Two MTX resistant mutants, L.
major MTX60.4, which has previously been studied with
small targeted arrays [29], and L. infantum MTX20.5, were
studied using the full-genome microarrays. Mutants of both
species are highly resistant to MTX (Figure 1a), and since they
were selected in a stepwise fashion, it is likely that multiple
resistance mechanisms may exist in these mutants and could
thus be uncovered by these arrays. The resistant cells had a
similar generation time as the wild-type parent cells.
The DNA microarrays were first validated by hybridizing flu-
orescently labeled digested DNA of wild-type L. major and L.
infantum cells. The arrays were found to yield uniform and
reproducible results (not shown) and were deemed appropri-
ate for RNA expression profiling experiments. Total RNAs
were thus purified for both wild-type and mutant strains,
used to synthesize fluorescent probes, and hybridized to the
microarrays as described in Materials and methods. Scanning
and normalization led to expression data that were first rep-
resented as scatter plots. As evident from these plots (inserts
in Figure 2a,b), most genes in both species are equally
expressed between the sensitive and resistant strains. Indeed,
the bulk of expression (RNA level) ratios between sensitive
and resistant strains were close to 1. Nonetheless, there were
notable differences. First, the RNA levels of a total of 61 genes
Genome Biology 2008, Volume 9, Issue 7, Article R115 Ubeda et al. R115.3
Genome Biology 2008, 9:R115
were found to be modulated (cut-off of 2, p < 0.05) in the L.
infantum MTX20.5 mutant compared to the wild-type strain
(Figure 2a; Table S1 in Additional data file 1) and the expres-
sion levels of 75 genes were changed significantly (cut-off of
2, p < 0.05) in the L. major MTX60.4 mutant compared to the
wild-type strain (Figure 2b; Table S1 in Additional data file 1).
Secondly, a majority of genes whose expression was modu-
lated by more than two-fold had increased expression levels
in L. infantum MTX20.5 but the majority of another set of
genes had decreased expression levels in L. major MTX60.4
(inserts of Figure 2; Table S1 in Additional data file 1). If the
expression modulation cut-off was changed from 2 to 1.5 (p <
0.05), we found 251 and 372 genes that were differentially
expressed in L. infantum MTX20.5 and L. major MTX60.4,
respectively (Figure 2). Surprisingly, few differentially
expressed genes were found to be modulated similarly in both
mutants (Figure 3; Table S1 in Additional data file 1). One
notable exception is a region of chromosome 6 that corre-
sponds to a six gene locus including the DHFR-TS gene.
DHFR-TS is the main target for MTX and its gene was fre-
quently found amplified in L. major MTX resistant mutants
as part of extrachromosomal circles (reviewed in [3,4]).
The DNA microarray data were supported by selected quanti-
tative real-time reverse transcription PCR (qRT-PCR) assays
in both the L. major and L. infantum mutants (Figure 3). In
only two cases we found a discrepancy between the two tech-
niques. LmjF04.0160 and its orthologue LinJ04_V3.0160
were found down-regulated in both mutants using DNA
microarrays, but this was confirmed only in the L. major
mutant by qRT-PCR (Figure 3). The other discrepancy
between microarray and qRT-PCR data was for FT1, but this
is explained by a gene deletion event (see below). The only
other gene that was modulated similarly in the two mutants
was the ABC protein gene ABCA2 and this was confirmed by
qRT-PCR (Figure 3). Other genes were modulated in both
mutants but in different ways. While LmjF31.0720 was down-
regulated in L. major MTX60.4, its orthologue
LinJ31_V3.0750 in L. infantum MTX20.5 was overexpressed
(Figure 3). Otherwise, genes differentially expressed were
specific to individual mutants.
The differential gene expression of the MTX resistant
mutants was also represented in a chromosome by chromo-
some fashion (Figure 2). This has permitted us to visualize
regions that are differently expressed (red/orange, corre-
sponding to overexpressed genes in the mutants). Two
regions were clearly overexpressed in the L. infantum
MTX20.5 mutant. One region was on chromosome 6 (
DHFR-
TS loci) and the second was in the left portion of chromosome
23 (Figure 2a). For the L. major MTX60.4 mutant, we also
saw an increase in expression of selected genes present on
chromosome 6 (DHFR-TS loci), but we also observed a
number of whole chromosomes (for example, chromosome
22; colored predominantly red in Figure 2b).
Extrachromosomal circular amplification of DHFR-TS
DHFR-TS is present on chromosome 6 and by close examina-
tion of the expression data derived from the arrays we were
able to precisely define the genes with increased expression in
both the L. major and L. infantum mutants. In L. infantum,
the genomic region overexpressed is delimited by genes
LinJ06_V3.0860 and LinJ06_V3.0910 (Figure 4a). Most
interestingly, the same region is overexpressed in L. major
MTX60.4 (Figure 4a). As Leishmania is devoid of control for
the initiation of transcription (no pol II promoter has yet been
isolated in this parasite [58]), it is possible that the amplifica-
tion of a small genomic region containing the DHFR-TS gene
is responsible for the increased gene expression as deter-
mined by DNA microarrays. This was tested by hybridization
of a blotted pulsed-field gel electrophoresis (PFGE) gel with a
DHFR probe. Wild-type cells gave rise to two hybridizing
bands, suggesting that the two homologous chromosomes 6
have different sizes (Figure 4b, lanes 1 and 3), a well
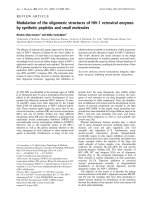
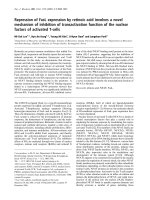
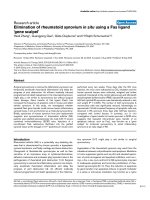
Methotrexate susceptibhellsFigure 1
Methotrexate susceptibility in Leishmania cells. (a) Leishmania cells were
grown in M199 medium and their growth was monitored at 72 hours by
measuring their OD
600 nm
with varying concentrations of MTX. White
circles, L. major wild-type cell; black circles, L. major MTX60.4; white
squares, L. infantum wild-type cells; black squares, L. infantum MTX20.5.
(b) The mutant L. major MTX60.4 was grown in the absence of drug for 5,
12, 25, 30 and 42 passages. The average of triplicate measurements is
shown.
Methotrexate [µM]
Methotrexate [µM]
(a)
(b)
%%
2.5
2
1
1.5
0.5
0
0
20
40
60
80
100
Percentage of relative growth
250
150100
25 50
0
0
20
40
60
80
100
Percentage of relative growth
MTX 60.4
rev5
rev12
rev25
rev30
rev42
Genome Biology 2008, 9:R115
Genome Biology 2008, Volume 9, Issue 7, Article R115 Ubeda et al. R115.4
established phenomenon in Leishmania [59]. The two
mutants had an extra band hybridizing to the DHFR probe,
which with its hybridizing smear is characteristic of extra-
chromosomal circles (Figure 4b, lanes 2 and 4). The genesis
of circular DNA in Leishmania has been studied and is often
due to homologous recombination between direct repeats
bordering the regions amplified [22-24]. Close examination
of the sequences flanking the regions amplified indeed
pointed to the presence of repeated sequences (Figure 4a).
The repeated sequences were highly similar between L. major
(575 bp) and L. infantum (837 bp) (Figure S1 in Additional
data file 2). To provide evidence that the DHFR-TS contain-
ing circles were generated through homologous recombina-
tion between these direct repeated sequences, we used two
primers (6a and 6b in Figure 4a,c) that should give rise to a
PCR amplification product only when an extrachromosomal
circle is formed (Figure 4c). Indeed, when using this primer
pair, PCR fragments of the expected size were observed in L.
infantum MTX20.5 and L major MTX60.4 (Figure 4d, lanes
2 and 4) while no amplification was observed in the wild-type
cells (Figure 4d, lanes 1 and 3). The difference in size of the
PCR fragments between L. major and L. infantum is due to
the difference in size of the repeats in the two species (Figure
S1 in Additional data file 2). Sequencing of the PCR generated
amplicon derived from L. major MTX60.4 [Gen-
Bank:EU346088
] confirmed the scenario of homologous
recombination between the repeated sequences (Figure S1d
in Additional data file 2).
Linear amplification of PTR1
In mutant L. infantum MTX20.5 we observed a region of
chromosome 23 that was overexpressed (increased RNA lev-
els; Figure 2a). This region contains the gene for pteridine
reductase 1 (PTR1), a well established MTX resistance gene
whose product can reduce folic acid, hence by-passing the
need for DHFR-TS [30,31]. Similarly to the DHFR-TS loci,
the microarray expression data have allowed the precise
determination of the region that was overexpressed, which
started at the telomeric end and extended 120 kb up to gene
LinJ23_V3.0380 (Figure 5a). The putative presence of telom-
eric sequences would suggest a linear amplification instead of
a circular amplification. Hybridization of a chromosome
PFGE blot has shown that PTR1 hybridized to the approxi-
mately 800 kb chromosome in both wild-type and resistant
cells but also to a smaller linear amplicon of approximately
230 kb in L. infantum MTX20.5 (Figure 5b). This amplicon
also hybridized to a telomere probe (Figure 5b). The size of
the amplicon suggests that the amplified region was
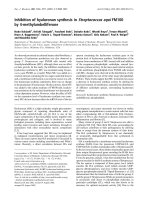
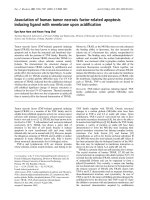
Modulation of gene expression in Leishmania cells resistant to methotrexateFigure 2
Modulation of gene expression in Leishmania cells resistant to methotrexate. DNA microarrays were analyzed as described in Materials and methods and
the software GeneSpring version GX3.1 was used to represent fold modulation either on a chromosome by chromosome basis (1 to 36) or as a scatter
plot (inserts) for both (a) L. infantum MTX20.5 and (b) L. major MTX60.4. Vertical bars refer to individual genes on each chromosome and their location
above or below the strand represents the transcribed strand. Transcription in Leishmania leads to polycistronic RNAs. Red (increased expression) and
blue (decreased expression) dashed lines in the scatter plots indicate 1.5-fold differences in gene expression, with the y-axis representing the expression
ratios between the mutant and wild-type cells and the x-axis the signal intensity in the mutant. The color scale indicates the modulation of hybridization
signals in the resistant mutants compared to wild-type cells. The spots corresponding to genes that are part of the DHFR-TS amplicons are circled in the
scatter plots. The entire data set was deposited in GEO under the accession number series GSE9949.
(b)
(a)
Expression ratios L.inf.MTX20.5/WT
0.1
0.58
1
1.5
10
5
1e2 1e3 1e4
Signal intensity
1e5
DHFR-TS
Expression ratios L.m.MTX60.4/WT
0.58
1
1.5
10
5
1e2 1e3
1e4
Signal intensity
0.1
FT1
DHFR-TS
Chromosomes
Chromosomes
Base pairs
Base pairs
1,000,000
2,000,000
1,000,000
2,000,000
Genome Biology 2008, Volume 9, Issue 7, Article R115 Ubeda et al. R115.5
Genome Biology 2008, 9:R115
duplicated. The LinJ23_V3.0390 gene is clearly not overex-
pressed and thus not part of the amplicon (Figure 5a). Three
genes, LinJ23_V3.0360, LinJ23_V3-0370 and
Lin23_V3.0380, were less overexpressed than the other
genes that are part of the amplicon (Figure 5a). Examination
of the sequences where expression changed enabled the
detection of inverted homologous repeats of 578 bp (Figure
S2 in Additional data file 2) between LinJ23_V3.0350 and
Lin23_V3.0360, and between LinJ23_V3.0380 and
Lin23_V3.0390 (Figure 5a). Interestingly, similar repeats of
574 bp with 91% identity were found at the same position in
the L. major genome [60]. The presence of these inverted
repeats and the microarray expression data would suggest the
formation of a linear amplicon with large inverted duplica-
tions that was formed by annealing of the identical 578 bp
inverted repeats (Figure 5c). To obtain support for this sce-
nario, we used PCR primer pairs (23a and 23b, or 23c and
23d) that would lead to a PCR product only if the rearrange-
ment had occurred at the level of the inverted repeats (as, for
example, during a block in DNA replication). Indeed, we
obtained a product of the expected size with these pairs of
primers in L. infantum MTX20.5 but no product was
obtained from DNA derived from wild-type cells (Figure 5d).
The nucleotide sequence of the PCR amplicon obtained with
primer pair 23a/23b [GenBank:EU346089
] is entirely con-
sistent with the model shown in Figure 5c (Figure S2 in Addi-
tional data file 2).
Decrease in gene expression due to deletion of folate
transporter genes
Leishmania spp. have a large gene family of conserved folate
transporters with 14 FBT members (AA Ouameur et al.,
unpublished data). Part of this family located on chromosome
10 is shown in Figure 6a. Microarray expression data indi-
cated that FT1, coding for the main Leishmania folate trans-
porter [18,19], is down-regulated in L. major MTX60.4 but
not in L. infantum MTX20.5 (Figure 3). The level of conser-
vation of the various FBTs precluded that the 70-mer
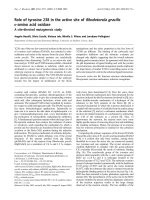
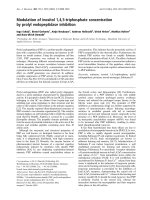
Validation of DNA microarray expression data by qRT-PCRFigure 3
Validation of DNA microarray expression data by qRT-PCR. The mean log10 ratios of selected genes from microarray expression data (grey bars) are
compared to qRT-PCR data (black bars) for (a) L. infantum MTX20.5 and (b) L. major MTX60.4. The microarray data are the average of four biological
replicates (with two dye swaps), while the qRT-PCR data are the average of three biological replicates repeated two times each. The asterisk indicates that
the related gene transcript was not detected by qRT-PCR. The upper panel shows the expression of orthologous genes where the expression changes in
the two species; the middle panel shows the modulation in the expression of FBT genes; the lower panel shows the expression of individual genes specific
for each mutant.
LmjF10.0370
FT1
LinJ31_V3.2040
LinJ31_V3.0750
PTR1
ABCA2
DHFR-TS
LinJ04_V3.0160
Microarray
qRT-PC R
-0.5 0 0.5 1
log
10
ratio
-1.5 -1 -0.5 0 0.5 1 1.5
LinJ19_V3.0870
LinJ10_V3.0380
BT1
-0.5 0 0.5 1
log
10
ratio
-0.5 0 0.5 1
LinJ26_V3.0780
LinJ23_V3.0380
LinJ23_V3.0340
LinJ23_V3.0020
log
10
ratio
Microarray
qRT-PC R
log
10
ratio
-1.5 -1 -0.5 0 0.5 1 1.5
LmjF23.1665
LmjF12.0850 - LmjF12.1070
LmjF04.0310
log
10
ratio
FBT genes
Individual genes
Orthologous genes
*
(a)
LmjF31.2000
LmjF31.0720
PTR1
ABCA2
DHFR-TS
LmjF04.0160
-1.5 -1 -0.5 0 0.5 1 1.5
Microarray
qRT-PC R
log
10
ratio
(b)
Genome Biology 2008, 9:R115
Genome Biology 2008, Volume 9, Issue 7, Article R115 Ubeda et al. R115.6
oligonucleotides spotted on the arrays would discriminate
several of these closely related genes. The use of qRT-PCR to
confirm the microarray data indicated that FT1 may be absent
(Figure 3). This was suggestive of a gene deletion event and
indeed a Southern blot of L. major MTX60.4 DNA hybridized
with a probe recognizing the majority of FBT genes confirmed
this extensive gene rearrangement (Figure 6b) and bands
corresponding to LmjF10.0380, LmjF10.0385 (FT1) and
LmjF10.0390 were either lacking or rearranged. Using PCR
primers (labeled F and R in Figure 6a,c), we were able to dem-
onstrate that FT1 (LmjF10.0385) was deleted following an
event of homologous recombination between conserved
sequences between LmjF10.0380 and LmjF10.0390 (Figure
6c). Indeed, primers F and R gave rise to a PCR fragment of
2.2 kb in L. major MTX60.4 (Figure 6d, lane 2) while under
the conditions tested no fragments were found with L. major
wild-type cells. Sequencing of the amplicon [Gen-
Bank:EU346090
] validated the scenario of homologous
recombination between two FBT genes leading to the diploid
deletion of FT1 (Figure 6c; Figure S3 in Additional data file 2).
Selection for MTX resistance and chromosome
aneuploidy
Analysis of gene expression on a chromosome by chromo-
some basis (Figure 2) suggested that the expression of whole
chromosomes is modulated in L. major MTX60.4. Indeed,
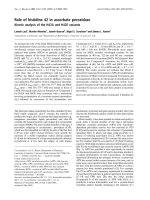
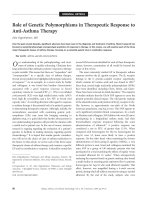
Extrachromosomal circular amplification of a genomic region of Leishmania chromosome 6 that includes the DHFR-TS locusFigure 4
Extrachromosomal circular amplification of a genomic region of Leishmania chromosome 6 that includes the DHFR-TS locus. (a) Genomic organization of
the DHFR-TS locus in both L. infantum MTX20.5 and L. major MTX60.4. Relative gene expression data (RNA) were determined using DNA microarrays and
relative hybridization data were obtained by comparative genomic hybridization (DNA). Asterisks indicate that the microarray data of these genes were
not found to be reliable. Direct repeats are shown with thick arrows and the approximate position of primers 6a and 6b are indicated with half arrows. (b)
Chromosome size blot of Leishmania cells hybridized to a DHFR-TS probe. Sizes were determined using a yeast molecular weight marker (Biorad. Hercules,
CA, USA). (c) Model for the formation of the extrachromosomal DHFR-TS circular DNA generated through homologous recombination between direct
repeats (Figure S1 in Additional data file 2). (d) PCR with primers 6a and 6b to support the model shown in (c). Lane 1, L. infantum wild-type cells; lane 2,
L. infantum MTX 20.5; lane 3, L. major wild-type cells; lane 4, L. major MTX60.4.
(a)
(b)
(c)
1
22
33
kb
LinJ06_V3.0920
-
LmjF06.0890
LinJ06_V3.0850
-
LmjF06.0820
LinJ06_V3.0860
-
LmjF06.0830
LinJ06_V3.0870
-
LmjF06.0840
LinJ06_V3.0880
-
LmjF06.0850
DHFR
-
TS
L
inJ06_V3.0900
-
LmjF06.0870
LinJ06_V3.0910
-
LmjF06.0880
6a 6b
MTX 60.4
MTX 20.5 1 6.1 4.3 8.3 4.9 6.5 1
1 5.7 5.4 5.3 8.1 11.9
*
*
microarr ay data p<0.05
225
285
365
450
kb
(d)
1
1 2 3 4
234
6b 6a
DHFR
-
TS
6b 6a
MTX 60.4 1123.7 10.7 16.6 8.87.6
*
RNA
DNA
Genome Biology 2008, Volume 9, Issue 7, Article R115 Ubeda et al. R115.7
Genome Biology 2008, 9:R115
the majority of genes present on chromosomes 11 and 12
appeared down-regulated while the expression of genes
located on chromosomes 7, 22, 28 and 32 seemed up-regu-
lated (Figure 2). Chromosome 6 of L. infantum MTX20.5 also
appears to be in more than two copies. This chromosome-
wide uniform modulation of expression was represented
more thoroughly for selected chromosomes by plotting the
fold modulation in gene expression along the chromosome
(Figure 7). The normalized microarray data indicated that
genes of chromosomes 22 and 28 were overexpressed 1.7- and
1.5-fold, respectively, in the resistant strain L. major
MTX60.4 compared to the wild-type strain. The expression of
genes on chromosomes 11 and 12 seemed, in general, to be
50% underexpressed in the mutant strain compared to wild-
type cells (Figure 7).
A number of hypotheses can explain this whole chromosome-
specific gene regulation and we tested whether the copy
number of specific chromosomes changed upon MTX selec-
tion in L. major MTX60.4. Quantitative Southern blot analy-
ses with two distinct probes derived from chromosome 22
revealed that if the wild-type cells contain two homologous
Linear amplification of PTR1 as a large inverted duplicationFigure 5
Linear amplification of PTR1 as a large inverted duplication. (a) Genomic organization of the PTR1 locus in L. infantum and relative gene expression data as
determined by DNA microarrays in L. infantum MTX20.5. Note that all genes from the telomere up to LinJ23_V3.0380 showed increased levels of
expression in the MTX20.5 mutant compared to wild-type cells. (b) Chromosome size PFGE of Leishmania cells. Ethidium bromide (Et-Br) stained gel, or
blotted gels hybridized to a PTR1 probe or to a probe containing the telomeric repeats are shown. Sizes were determined using a yeast molecular weight
marker (Biorad). (c) Model for the formation of the extrachromosomal PTR1 linear amplicon generated through annealing of homologous inverted repeats
(Figure S2 in Additional data file 2). This annealing could be facilitated by a block in replication. (d) PCR with primer pairs 23a and 23b or 23c and 23d to
support the model shown in (c). Lane 1, L. infantum wild-type cells; lane 2, L. infantum MTX20.5.
(c)
(d)
(a)
Et- Br PTR1 Telomere
225
285
365
kb
(b)
PTR1
LinJ23_V3.0380
LinJ23_V3.0390
LinJ23_V3.0370
LinJ23_V3.0360
LinJ23_V3.0350
LinJ23_V3.0340
LinJ23_V3.0330
LinJ23_V3.0320
23a 23b
LinJ23_V3.0380
LinJ23_V3.0370
LinJ23_V3.0360
LinJ23_V3.0350
LinJ23_V3.0340
23a 23b
LinJ23_V3.0350
LinJ23_V3.0340
23a
23ab 23cd
1000
850
2000
bp
650
MTX 20.5 1.5 3.6 3.5 4.3 2.5 2.6 11.5
microarray data p<0.05
2.3
<<<
<<<
<<<
<<<
<<<
23c 23d 23c
.0360
.0370
.0380
1 2 1 2 1 2
12 12
Genome Biology 2008, 9:R115
Genome Biology 2008, Volume 9, Issue 7, Article R115 Ubeda et al. R115.8
copies of chromosome 22 (Leishmania is a diploid organism),
L. major MTX60.4 had four copies (Figure 7a, lanes 1 and 2).
Similarly, L. major MTX60.4 had three copies of chromo-
some 28 compared to wild-type cells (Figure 7b, lanes 1 and
2). The probes used are physically far apart, indicating a
change in ploidy of the whole chromosome. However, this
change in chromosome copy number was not observed for
chromosomes 11 and 12 (Figure 7c,d). Aneuploidy of specific
chromosomes and drug resistance has been described in can-
cer cells (reviewed in [61]) and fungi [62,63]. To test this pos-
sibility, we generated a revertant line of L. major MTX60.4 by
successive passages in the absence of MTX; under these con-
ditions, resistance to the drug decreased (Figure 1b). Rever-
tant cells were not as sensitive as wild-type cells to MTX but
this is expected as a deletion of FT1 (Figure 6) will lead to
resistant parasites [19]. The aneuploidy of chromosomes 22
and 28 regressed to diploidy (similar to wild-type diploidy)
after 30 passages, thus circumstantially linking resistance
levels (Figure 1b) and copy number of these chromosomes
(Figure 7a,b, lanes 2-6). With the cells now diploid, additional
passages (for example, passage 42) did not decrease resist-
ance further.
Comparative genomic hybridization
Since several of the changes in RNA levels were correlated
with gene amplification or gene deletion, we undertook a
comparative genomic hybridization (CGH) study using the
full genome array. The DNA of mutant L. major MTX60.4
was labeled and changes in copy number in comparison to
sensitive wild-type cells were measured using CGH. The CGH
data are represented in a chromosome by chromosome fash-
ion in Figure S4 in Additional data file 3. A qualitative corre-
lation was observed between CGH and RNA-based
hybridization (Figure 8). Indeed, amplification of the DHFR-
TS locus, derived from chromosome 6, was easily detected by
both techniques and quantification of the DNA amplification
was compared to RNA levels (Figure 4). The deletion of FT1
was also detected by CGH and the latter technique was found
to be quantitative. Indeed, the 70-mers recognizing FT1 rec-
ognized three conserved FT genes. In the MTX60.4 mutant
two of these genes are deleted, hence explaining the ratio of
0.33 obtained by CGH (Figure 6). Polyploidy was also easily
detected by CGH (Figure 8). Indeed, a similar qualitative pat-
tern of hybridization intensities was obtained for both RNA
expression profiling and CGH (Figure 8). Interestingly, while
RNA expression profiling showed that chromosome 11 was
Mechanism of deletion of the main folate transporter gene FT1 in L. major selected for MTX resistanceFigure 6
Mechanism of deletion of the main folate transporter gene FT1 in L. major selected for MTX resistance. (a) A portion of the L. major chromosome 10
showing some of the FT genes. Approximate location of PvuI sites (crosses) and their size are shown. Primers F and R are indicated by half arrows. The
relative hybridization data obtained from RNA expression profiling (RNA) and comparative genomic hybridization (DNA) are shown. Due to conservation
between the FT genes, the 70-mer probes for LmjF10.0380, FT1 and LmjF10.0390 are not discriminatory. (b) Southern blot of Leishmania total DNA
digested with PvuI and hybridized to a probe recognizing conserved sequences of most FBT genes (indicated by bars underneath the genes in (a,c)). The
genes corresponding to some hybridizing bands are indicated. (c) Model for the deletion of FT1 mediated by the homologous recombination of the
conserved sequences between the folate transporter genes LmjF10.0380 and LmjF10.0390 (Figure S3 in Additional data file 2). (d) PCR with primers F and
R to support the model shown in (c). Lane 1, L. major wild-type cells; lane 2, L. major MTX60.4.
1.6
2
3
5
4
6
7
Kb
(a) (b)
(c)
(d)
FR
FT1
10.0390
10.0380 -90 10.040010.0370
FR
10.0380
10.0390
deletion
2
3
Kb
FT1
1 2
1 2
10.0380
x
x
x
xx
9.1 kb5.6 kb 2.7 kb
3.2 kb
10.0380 -90
FR
microarray data p<0.05
RNA
DNA 0.33 0.33 0.33
0.13 0.130.13
xxx
1.6
2
3
5
4
6
7
FR
FR
2
3
1 2
1 2
x
x
x
xx
9.1 kb5.6 kb 2.7 kb
0.33 0.33 0.33
0.13 0.130.13
xxx
10.0370 10.0380 FT1 10.0390 10.0400
Genome Biology 2008, Volume 9, Issue 7, Article R115 Ubeda et al. R115.9
Genome Biology 2008, 9:R115
down-regulated, quantitative Southern blots indicated that
the copy number of the chromosome remained unchanged
(Figure 7). This was also confirmed by CGH (Figure 8). There
are some differences, however, between RNA expression pro-
filing and CGH. For example, the latter technique showed
that chromosome 2 is polyploid (Figure S4 in Additional data
file 3) but this is likely due to the dynamic process of cell cul-
ture and parasite evolution, as DNA and RNA were prepared
1.5 years apart, rather than a difference in the techniques.
Chromosome aneuploidy in L. major selected for MTX resistanceFigure 7
Chromosome aneuploidy in L. major selected for MTX resistance. The relative expression ratio of each individual gene of chromosomes (a) 22, (b) 28, (c)
11 and (d) 12 of L. major MTX60.4 was contrasted with the expression levels of the same genes in L. major wild-type cells, which were arbitrarily set at 1.
Quantitative Southern blots were performed; two distant probes per chromosome were hybridized to HpaII digested DNA from L. major wild-type (lane
1), and L. major MTX60.4 (lane 2) (only one hybridization is shown for chromosomes 11 and 12). The hybridization signals of an α-tubulin (α-tub) probe,
whose related gene is unchanged in the resistant strain, were used to standardize all the hybridization signals. HpaII digested total DNA from revertant L.
major MTX60.4 parasites after 5, 12, 25, and 30 passages without MTX (lanes 3, 4, 5, and 6, respectively) were added, showing the progressive loss of
aneuploid chromosomes in revertants.
(a) (b)
Chromosome 28
Chromosome 22
2
1
0.5
4
0.5
2
1
4
50 kb 50 kb
1 2 4 51 234 56
Chromosome 12Chromosome 11
2
1
0.5
4
2
1
0.5
4
α -tub
LmjF22.1490
LmjF22.1180
Fold difference: 1 2 2 1.6 1.2 1
LmjF28.0550
LmjF28.1820
α-tub
Fold difference: 1 1.5 1.2 1
(c) (d)
50 kb 50 kb
12
12
LmjF11.0250 LmjF12.0670
α-tub α-tub
Fold difference: 1 1 Fold difference : 1 1
Genome Biology 2008, 9:R115
Genome Biology 2008, Volume 9, Issue 7, Article R115 Ubeda et al. R115.10
Discussion
The use of DNA microarrays is now useful to understand both
the mode of action of drugs and the mechanisms of drug
resistance (reviewed in [44-46]). Since Leishmania has no
control at the level of transcription initiation [58], it is
unlikely that drug response profiling using microarrays will
be helpful to understand the mode of action of drugs in Leish-
mania. Results using MTX as a lead drug and qRT-PCR to
monitor key genes, such as DHFR-TS, PTR1, and FT1,
appeared to confirm this lack of RNA modulation of target
genes upon drug exposure (unpublished observations). This
is unfortunate, as the mode of action of most anti-Leishmania
drugs is unknown. Nonetheless, microarrays are likely to be
useful for studying resistance in Leishmania since it is often
mediated by gene amplification [3,4] and we show here that
DNA arrays hybridized to cDNAs were most valuable for
detecting gene amplification events (Figures 2, 4, and 5).
Since resistance is mostly correlated with gene amplification,
we also used CGH and found a good qualitative correlation
between RNA expression profiling and CGH (Figure 8). The
technique of CGH was found to be technically simpler, but
since there are clear examples of modulation in RNA level (for
example, increased RNA stability) without changes in copy
number of DNA in drug resistant Leishmania [64-66] (Figure
Comparison of relative hybridization data between RNA expression profiling and comparative genomic hybridizationFigure 8
Comparison of relative hybridization data between RNA expression profiling and comparative genomic hybridization. RNA or genomic DNA derived
probes were prepared from L. major MTX60.4 and the sensitive parent strain and hybridized to DNA microarrays. A subset of whole chromosome
comparisons showing the correlation between RNA and DNA hybridization data are depicted. Examples shown are: chromosome 1 used as a no change
control; chromosome 6 and the overexpression/amplification of the DHFR-TS locus (for quantification see Figure 4); and chromosome 22, where DNA and
RNA are increased. For chromosome 11, RNA is decreased while DNA appears the same but the latter was also confirmed by Southern blots (Figure 7).
Chromosomes
DNA
RNA
1
DNA
RNA
6
DNA
RNA
11
DNA
RNA
22
2.0
1.5
1.2
1.0
0.9
0.8
0.7
0.5
0.6
expression
Chromosomes
DNA
RNA
1
DNA
RNA
6
DNA
RNA
11
DNA
RNA
22
2.0
1.5
1.2
1.0
0.9
0.8
0.7
0.5
0.6
expression
Genome Biology 2008, Volume 9, Issue 7, Article R115 Ubeda et al. R115.11
Genome Biology 2008, 9:R115
3, and Figure 7 for chromosomes 11 and 12), hybridization
with cDNAs is likely to be more comprehensive. Nonetheless,
modulation in RNA levels without changes in copy number of
a gene is an infrequent event in drug resistant Leishmania.
The use of both L. infantum and L. major MTX resistant
mutants validated the design of our multi-species array but
has also illustrated that the cellular resistance genotype can
be complex and differ considerably between different
mutants selected for resistance to the same drug. The modu-
lation in expression of a few genes was common to both
mutants, and only ABCA2 and DHFR-TS could be confirmed
by qRT-PCR (Figure 3). Down-regulation of the ABC protein
gene ABCA2 has never been described in MTX resistant
Leishmania cells and additional investigations would be
required to test whether it has any role in MTX resistance.
DHFR-TS was the first amplified gene studied in a protozoan
parasite [5] but its exact mechanism of amplification has
never been reported. In addition to detecting gene
amplification events, microarray data, whether derived from
RNA expression profiling or CGH, were also useful in map-
ping the exact regions that were amplified. We show that
DHFR-TS is amplified in L. major MTX60.4 as an
extrachromosomal circle through homologous recombina-
tion between non-coding repeated sequences (Figure 4). This
is consistent with other loci that were also found to be ampli-
fied by homologous recombination between relatively long
repeated sequences [22-24]. Blast searches have shown that
these exact repeated sequences are found only on chromo-
some 6. Remarkably, the same similar repeated sequences
(albeit with different sizes) have also been conserved in L.
infantum (Figure S1 in Additional data file 2). The same
observation was made for the inverted repeats close to PTR1
that were conserved between L. major and L. infantum. L.
major and L. infantum are thought to have diverged 0.5 mil-
lion years ago [67] and it thus seems that there is considerable
selective pressure to keep these repeated sequences intact.
Since folates and pterins are important for Leishmania
growth, it is possible that the presence of these repeats may
allow a strategy to rapidly increase DHFR-TS or PTR1 levels
in conditions of limited substrates. With its lack of transcrip-
tion initiation control, Leishmania may utilize this alterna-
tive strategy of flanking key metabolic genes by repeated
sequences to amplify these genes when required. Consistent
with this proposal, DNA amplification has been observed in
Leishmania cells subjected to nutrient shocks [68].
PTR1 is a well established MTX resistance gene product
[30,31] and the amplification of its gene was first reported as
part of extrachromosomal circles [6,34-36]. Linear amplifica-
tion of PTR1 with inverted duplications was described later
[16,24,37] and linear amplicons could be precursors of circu-
lar amplicons [38]. Linear amplicons derived from other loci
than the PTR1 region with inverted duplications have also
been described in Leishmania [69-73]. The microarray
hybridization data have enabled the elaboration of a plausible
model for the generation of a linear amplicon that contained
large inverted duplications formed at the site of inverted
repeats (Figure 5). This is consistent with other models of
gene amplification in Leishmania [16,37] where inverted
repeats seem to be a major pathway to generate amplified
large DNA palindromes (inverted duplications), as described
in Tetrahymena [74], yeast [75] and mammalian cancer cells
[76,77]. One of the large inverted duplications extends from
the inverted repeats, where rearrangement has occurred, to
the telomeric sequences (Figure 5). These data exclude the
necessity of chromosomal breaks/rearrangements at two
independent positions, but it remains to be determined
whether a double-stranded break, a single-stranded break or
blocks in replication are facilitating inverted repeat
annealing.
Gene deletions were thought to be associated with MTX
resistance in Leishmania [19,20] but had not yet been charac-
terized at the molecular level. The microarray data, either
derived from RNA expression profiling or CGH, has led to the
observation that a diploid non-conservative deletion occurred
by homologous recombination between two members of the
large FBT gene family (Figure 6). The mechanism of gene
deletion thus resembles the mechanism of amplification.
Usually, amplification in Leishmania is conservative, and
only a few instances of non-conservative amplification (loss
of one allele) have been described in it [3,22,23]. In the L.
major MTX60.4 mutant, we observed a diploid deletion of
the FT1 gene (Figure 6). It is not known whether the second
allele is deleted by homologous recombination or by a gene
conversion event such as a loss of heterozygosity, but there is
a strong selection pressure to delete FT1, the main folate (and
MTX) transporter in Leishmania. Without FT1, cells can
become resistant to MTX but folates or related molecules will
still need to be transported. It will be of interest to determine
whether the fusion FBT protein produced by the recombina-
tion event (Figure 6) is active or not.
The microarray approach has shown that modulation of gene
expression could (rarely) be due to differential RNA expres-
sion without changes in copy number (Figure 3) [29]; it could
be more frequently due to gene amplification (Figures 4 and
5) and, as determined now, to gene deletion (Figure 6). Two
novel strategies were highlighted through the use of microar-
rays. In the L. major MTX60.4 mutant, the entire set of genes
of chromosomes 11 and 12 is down-regulated while all the
genes present on chromosomes 22 and 28 and possibly a few
other chromosomes are overexpressed. The mechanism
underlying an upregulation in gene expression results from a
change in chromosome ploidy (Figure 7). Changes in ploidy
have been observed when attempting to inactivate essential
genes in Leishmania [78], but not in resistant parasites. We
recently observed a similar phenomenon with other resistant
Leishmania cells (P Leprohon et al., unpublished data),
suggesting that chromosome aneuploidy is part of the Leish-
mania arsenal for responding to drug pressure. There was a
Genome Biology 2008, 9:R115
Genome Biology 2008, Volume 9, Issue 7, Article R115 Ubeda et al. R115.12
good correlation between resistance levels and the copy
number of these supernumerary chromosomes (Figures 1 and
7), linking this genetic event to the resistance phenotype.
Obviously, additional studies will be required to determine
which gene(s) is (are) responsible for resistance. A putative
mechanism for increasing the levels of a gene product in
Leishmania would thus be to generate supernumerary chro-
mosomes. This may occur when direct or inverted repeats are
absent in the vicinity of a gene conferring a selective advan-
tage. While this is plausible, especially for an organism lack-
ing control at the level of transcription initiation, this drug
induced aneuploidy has been well documented in cells with
transcriptional control, such as cancer cells (reviewed in [61])
or fungi [62,63]. The mechanism of down-regulation of whole
chromosome expression does not seem to involve a change in
chromosome number (Figures 7 and 8) and may involve epi-
genetic factors that will need to be investigated.
Conclusion
The microarray approach was useful in highlighting several
mechanisms used by resistant cells to modulate the copy
number of genes by: gene deletion or extrachromosomal
circular or linear amplicons; through supernumerary chro-
mosomes; and by decreasing the expression of whole chro-
mosomes by a mechanism that remains to be identified. In
the case of the first two events, the rearrangements have
occurred at the site of repeated (direct or inverted) sequences.
It is possible that these repeats are not randomly distributed
to allow the amplification of specific chromosomal regions.
Using DNA microarrays it was shown that inverted duplica-
tions are frequent in cancer cells; these are not randomly
distributed, and a subset are associated with gene amplifica-
tion [79]. The availability of DNA microarrays for Leishmania
has highlighted the role of repeated sequences and of chro-
mosome ploidy in responding to environmental changes.
Aneuploidy has been suggested as an important cause of can-
cer specific drug resistance [61] and further work should
reveal the potential importance of this phenomenon in drug
resistance in Leishmania.
Materials and methods
Cell culture
The wild-type strain L. major LV39 and the mutants L. major
MTX60.4 have been described previously [65]. The L. infan-
tum strain (MHOM/MA/67/ITMAP-263) was selected in
vitro in a stepwise fashion starting with its EC
50
(0.5 μM) with
doubling concentrations of MTX when cells were adapted to
yield L. infantum MTX20.5 growing at 20 μM of MTX. All
cells were grown in M199 medium supplemented with 10%
heat-inactivated fetal bovine serum and 5 μg/ml hemin at
25°C.
DNA manipulation
Chromosomes in agarose blocks were prepared and separated
by PFGE as described previously [38]. For Southern blot and
PCR, genomic DNA was isolated using the DNAzol technique
(Invitrogen, Carlsbad, CA, USA) as recommended by the
manufacturer. Southern blots, hybridization, and washing
conditions were done following standard protocols [80]. For
chromosome copy number investigation, Southern spots
were quantified using ImageQuant 5.2 (GE Healthcare,
Upsala, Sweden) and the reference gene
α
-tubulin was used
for normalization.
L. infantum and L. major DNA oligonucleotides full
genome microarray design
The recent completion of the sequence of the L. major [81]
and L. infantum [82] genomes, allowed the generation of
multispecies high-density oligonucleotide microarrays. Our
analysis of open reading frame sequence conservation
between L. major and L. infantum revealed that these two
species share 91-96% nucleotide identity, suggesting that
interspecies microarray probes can be designed. Therefore,
70-mer oligonucleotides were designed for each open reading
frame of L. infantum and L. major using automated bioinfor-
matic procedures. The genomes of both species were first
compared using BLAST and homologous genes were grouped
together. Probes were designed with consistent
thermodynamic properties. Probes were initially designed for
L. infantum with the added requirement that the region tar-
geted by the probes had perfect homology between both spe-
cies. For common probes, up to 2 mismatches (out of 70
nucleotides) were tolerated. In the case that more than two
mismatches were present in a given gene between L. infan-
tum and L. major, a new probe was designed specifically for
L. major (956 probes). The microarray included a total of
8,978 70-mer probes that recognized with no mismatches all
L. infantum genes (8,184, GeneDB version 3) and also all L.
major genes (8,370, GeneDB version 5.1) with a small per-
centage of the probes having at most 2 mismatches. Also, 372
control probes were included in the microarray for assessing
synthesis variability, and location of the probe within a given
open reading frame and of mismatches on hybridization. The
probes were synthesized in 384-well plates by Invitrogen. The
microarrays were printed on SuperChip (Erie Scientific, Port-
smouth, NH, USA) using a BioRobotics MicroGrid (Genomic
solutions Inc, Ann Arbor, MI, USA). Each probe was printed
in duplicate. Our microarray platform is described in the
Gene Expression Omnibus (GEO) with accession number
GPL6855.
Total RNA preparation and labeling
Total RNA was isolated from 10
8
Leishmania cells during the
mid-log phase using RNeasy Plus Mini Kit (QIAGEN, Hilden,
Germany). The RNA preparation was treated with TURBO
DNase (Ambion, Austin, TX, USA) to avoid any genomic con-
tamination. The purity, integrity and quantity of the RNA
were assessed on the Agilent 2100 bioanalyzer with the RNA
Genome Biology 2008, Volume 9, Issue 7, Article R115 Ubeda et al. R115.13
Genome Biology 2008, 9:R115
6000 Nano LabChip reagent set (Agilent Technologies, Santa
Clara, CA, USA). For each probe, 10 μg of RNA were con-
verted to aminoallyl-dUTP incorporated cDNA using random
hexamers (Roche, Basel, Switzerland) and the SuperScript III
RNase H Reverse Transcriptase (Invitrogen). Probes were
thereafter coupled to the fluorescent dye Alexa Fluor555 or
Alexa Fluor647 (Invitrogen) following the manufacturer's
recommendations. Fluorescent probes were then purified
with MinElute Spin Columns (QIAGEN) and quantified
spectrophotometrically.
Genomic DNA preparation and labeling
Genomic DNA from 10
8
cells was isolated using the DNAzol
technique (Invitrogen) as recommended by the manufac-
turer. Total DNA was then fragmented by successive passages
through 22G1" and 27G 1/2" needles (Becton Dickinson Fran-
klin Lakes, NJ, USA). Fragmented DNA was then double
digested with PvuII and MseI restriction enzymes. Digested
DNA was purified by phenol-chloroform, followed by an eth-
anol precipitation. For each probe, 4 μg of purified frag-
mented and digested genomic DNA were converted to
fluorescently labeled DNA using Cy5- or Cy3-dCTP (Amer-
sham, Piscataway, NJ, USA), random hexamers (Roche) and
the exo
-
Klenow DNA polymerase (NEB, Ipswich, MA, USA).
Fluorescent probes were then purified with ArrayIt columns
(TeleChem International, Sunnyvale, CA, USA) and quanti-
fied spectrophotometrically.
Microarray hybridization
Prehybridization and hybridization were performed at 42°C
under immersion (Corning chambers, Corning, NY, USA).
Slides were prehybridized for 90 minutes in PreHYB Solution
(5× Denhardt, 30% formamide, 6× SSPE, 0.5% SDS, 100 μg/
ml salmon sperm DNA). Then, slides were first washed 2
times at 42°C for 5 minutes in 2× SSC, 0.1% SDS with gentle
agitation. Subsequent washes were at room temperature, 3
minutes each, in 1× SSC, 0.2× SSC and 0.05× SSC. Slides
were then dipped in 100% isopropanol and dried by centrifu-
gation. For hybridization, Alexa Fluor555 and 647 cDNA
probes were dried and resuspended in the HYB solution (2.5×
Denhardt, 30% formamide, 6× SSPE, 0.5% SDS, 100 μg/ml
salmon sperm DNA, 750 μg/ml yeast tRNA), then mixed,
denatured 5 minutes at 95°C and cooled slowly to 42°C.
Mixed probes were applied on the array under a lifterslip.
Hybridization was performed for 16 h. Washes after hybridi-
zation were the same as those described for the
prehybridization.
Fluorescence detection, data processing and statistical
analysis
The Perkin Elmer ScanArray 4000XL Scanner was used for
image acquisition (Perkin Elmer, Waltham, MA, USA). Gene-
Pix Pro 6.0 image analysis software (Axon Instruments,
Union City, CA, USA) was used to quantify the fluorescence
signal intensities of the array features. Four different RNA
preparations of each mutant and their respective wild-type
strain were analyzed, including dye-swaps. Raw data from
GenePix were imported in R 2.2.1 for normalization and sta-
tistical analyses were performed using the LIMMA (version
2.7.3) package [83-85]. Before processing, probes were
flagged according to the hybridization signal quality [86].
Weights were assigned to each array in order to give less
weight to arrays of lesser quality [87]. Data were corrected
using background subtraction based on convolution of nor-
mal and exponential distributions [88]. Intra-array normali-
zation was carried out using the 'print-tip loess' statistical
method and inter-array normalization was done by using the
'quantiles of A' method for each array [89]. Statistical analysis
was done using linear model fitting and standard errors were
moderated using a simple empirical Bayes [83]. Multiple test-
ing corrections were done using the FDR method with a
threshold p-value of 0.05. Only genes statistically significant
with an absolute log ratio greater than 0.58 (log
2
1.5) were
considered as differentially expressed. Species comparison
was performed only on probes that had less than two mis-
matches when hybridized to either Leishmania species.
GeneSpring GX 3.1 was used for the generation of scatter
plots and for chromosome by chromosome analysis. The
entire data set has been deposited in GEO under the accession
number series GSE9949. The comparative genomic hybridi-
zation data are deposited under reference number GSE11623.
qRT-PCR
Three independent RNA preparations were conducted for
each condition. First-strand cDNA was synthesized from 2 μg
of total RNA using the Superscript III RNase H Reverse Tran-
scriptase enzyme and random hexamers (Roche) according to
the manufacturer's instructions. The resulting cDNA samples
were stored at -20°C until use. Control PCR amplification was
carried out using primers from different internal controls
(GAPDH and actin) to evaluate the uniformity of cDNA syn-
thesis in different samples. Primers, TaqMan probes, experi-
mental procedures and quantification for qRT-PCR of the
folate transporter genes was as described (AA Ouameur et al.,
unpublished data) using the glyceraldehyde-3-phosphate
dehydrogenase gene (GAPDH) for normalization. For all
other genes, equal amounts of cDNA were run in triplicate
and amplified in a 15 μl reaction containing 7.5 μl of 2× Uni-
versal PCR Master Mix (Applied Biosystems, Foster City, CA,
USA), 10 nM of Z-tailed forward primer, 100 nM of reverse
primer, 250 nM of Amplifluor Uniprimer probe (Chemicon
Int., Temecula, CA, USA), and 1 μl of cDNA target. Reactions
were performed at the Gene Quantification core laboratory of
the Centre de Génomique de Québec using the Applied Bio-
systems Prism 7900 Sequence Detector [90]. Amplification
was normalized to two genes showing a highly stable expres-
sion in wild-type and resistant strains: LinJ18_V3.0630/
LmjF18.0620 encoding a putative 60S ribosomal protein
L10a, and LinJ36_V3.0850/LmjF36.2500 encoding a chro-
matin assembly factor 1 subunit b-like protein.
Genome Biology 2008, 9:R115
Genome Biology 2008, Volume 9, Issue 7, Article R115 Ubeda et al. R115.14
Abbreviations
CGH, comparative genomic hybridization; DHFR, dihydro-
folate reductase; DHFR-TS, DHFR-thymidylate synthase;
FBT, folate biopterin transporter; FT, folate transporter;
GEO, Gene Expression Omnibus; MTX, methotrexate; PFGE,
pulsed-field gel electrophoresis; PTR, pteridine reductase;
qRT-PCR, quantitative real-time reverse transcription PCR.
Authors' contributions
JM carried out the molecular genetic studies and all the
microarray hybridizations performed in this study, partici-
pated in the bioinformatic analyses of microarray data and
drafted the manuscript. AHO helped in the design of qRT-
PCR assays. DL developed and optimized the comparative
genomic hybridization protocol. PR designed the 70-mer
Leishmania oligonucleotide microarrays. FR performed the
microarray normalization and statistical analysis. SB devel-
oped the LIMS that was used to integrate microarray results
storage and analysis. JC, MOl, MOu, BP and MJT are part of
a CIHR group grant and have supervised all the experiments
presented in this paper. All authors read and approved the
final manuscript.
Additional data files
The following additional data are available with the online
version of this paper. Additional data file 1 contains Table S1,
which lists the differential expression measured by the full-
genome microarray analysis. Additional data file 2 contains
supplementary Figures S1-S3. Additional data file 3 contains
supplementary Figure S4, which shows the results of the com-
parative genomic hybridization analyses of L. major
MTX60.4 versus the respective wild-type cells.
Additional data file 1Differential expression measured by the full-genome microarray analysisDifferential expression measured by the full-genome microarray analysis.Click here for fileAdditional data file 2Supplementary Figures S1-S3Figure S1 shows the direct repeats flanking the DHFR-TS locus of L. major and L. infantum chromosome 6, and also provides the cir-cular junction sequence formed by homologous recombination. Figure S2 shows the inverted repeats present on chromosome 23 of L. infantum, and provides the sequence of the new junction formed through the inverted duplication. Figure S3 shows the sequence of the L. major chimera gene LmjF10.0380/0390.Click here for fileAdditional data file 3Results of the comparative genomic hybridization analyses of L. major MTX60.4 versus the respective wild-type cellsResults of the comparative genomic hybridization analyses of L. major MTX60.4 versus the respective wild-type cells.Click here for file
Acknowledgements
We are grateful to Dr Eric Madore from the Centre Génomique du Centre
de Recherche en Infectiologie for help during the optimization process of
the microarray hybridizations. This work was funded in part by a CIHR
group grant to JC, MOl, MOu, BP and MJT and operating grants to MOu.
JMU is a Strategic Training Fellow of the Strategic Training Program in
Microbial Resistance, a partnership of the CIHR Institute of Infection and
Immunity and the Fonds de Recherche en Santé du Québec. AAO and FR
are recipients of CIHR studentships. JC holds the Canada Research Chair
in Medical Genomics, MJT holds the Canada Research Chair in Human
Immuno-Retrovirology. BP and MOl are Burroughs Wellcome Fund New
Investigator in Molecular Parasitology and the holders of FRSQ senior
scholarships. MOu is a Burroughs Wellcome Fund Scholar in Molecular Par-
asitology and holds the Canada Research Chair in Antimicrobial Resistance.
References
1. Handman E: Leishmania sis: current status of vaccine
development. Clin Microbiol Rev 2001, 14:229-243.
2. Sundar S, More DK, Singh MK, Singh VP, Sharma S, Makharia A,
Kumar PC, Murray HW: Failure of pentavalent antimony in vis-
ceral leishmaniasis in India: report from the center of the
Indian epidemic. Clin Infect Dis 2000, 31:1104-1107.
3. Beverley SM: Gene amplification in Leishmania. Annu Rev
Microbiol 1991, 45:417-444.
4. Borst P, Ouellette M: New mechanisms of drug resistance in
parasitic protozoa. Annu Rev Microbiol 1995, 49:427-460.
5. Coderre JA, Beverley SM, Schimke RT, Santi DV: Overproduction
of a bifunctional thymidylate synthetase-dihydrofolate
reductase and DNA amplification in methotrexate-resistant
Leishmania tropica. Proc Natl Acad Sci USA 1983, 80:2132-2136.
6. Beverley SM, Coderre JA, Santi DV, Schimke RT: Unstable DNA
amplifications in methotrexate-resistant Leishmania consist
of extrachromosomal circles which relocalize during
stabilization. Cell 1984, 38:431-439.
7. Garvey EP, Santi DV: Stable amplified DNA in drug-resistant
Leishmania exists as extrachromosomal circles. Science 1986,
233:535-540.
8. Dewes H, Ostergaard HL, Simpson L: Impaired drug uptake in
methotrexate resistant Crithidia fasciculata without changes
in dihydrofolate reductase activity or gene amplification. Mol
Biochem Parasitol 1986, 19:149-161.
9. Nare B, Luba J, Hardy LW, Beverley S: New approaches to Leish-
mania chemotherapy: pteridine reductase 1 (PTR1) as a tar-
get and modulator of antifolate sensitivity [In Process
Citation]. Parasitology 1997, 114(Suppl):S101-110.
10. Ouellette M, Drummelsmith J, El Fadili A, Kundig C, Richard D, Roy
G: Pterin transport and metabolism in
Leishmania and
related trypanosomatid parasites. Int J Parasitol 2002,
32:385-398.
11. Hardy LW, Matthews W, Nare B, Beverley SM: Biochemical and
genetic tests for inhibitors of Leishmania pteridine pathways.
Exp Parasitol 1997, 87:157-169.
12. Chowdhury SF, Di Lucrezia R, Guerrero RH, Brun R, Goodman J,
Ruiz-Perez LM, Pacanowska DG, Gilbert IH: Novel inhibitors of
Leishmania l dihydrofolate reductase. Bioorg Med Chem Lett
2001, 11:977-980.
13. Khabnadideh S, Pez D, Musso A, Brun R, Perez LM, Gonzalez-Pac-
anowska D, Gilbert IH: Design, synthesis and evaluation of 2,4-
diaminoquinazolines as inhibitors of trypanosomal and leish-
manial dihydrofolate reductase. Bioorg Med Chem 2005,
13:2637-2649.
14. Ellenberger TE, Beverley SM: Reductions in methotrexate and
folate influx in methotrexate-resistant lines of Leishmania
major are independent of R or H region amplification. J Biol
Chem 1987, 262:13501-13506.
15. Kaur K, Coons T, Emmett K, Ullman B: Methotrexate-resistant
Leishmania donovani genetically deficient in the folate-meth-
otrexate transporter. J Biol Chem 1988, 263:7020-7028.
16. Papadopoulou B, Roy G, Ouellette M: Frequent amplification of a
short chain dehydrogenase gene as part of circular and linear
amplicons in methotrexate resistant Leishmania. Nucleic Acids
Res 1993, 21:4305-4312.
17. Gamarro F, Chiquero MJ, Amador MV, Legare D, Ouellette M,
Castanys S: P-glycoprotein overexpression in methotrexate-
resistant Leishmania tropica. Biochem Pharmacol 1994,
47:1939-1947.
18. Cunningham ML, Beverley SM: Pteridine salvage throughout the
Leishmania infectious cycle: implications for antifolate
chemotherapy. Mol Biochem Parasitol 2001, 113:
199-213.
19. Richard D, Leprohon P, Drummelsmith J, Ouellette M: Growth
phase regulation of the main folate transporter of Leishmania
infantum and its role in methotrexate resistance. J Biol Chem
2004, 279:54494-54501.
20. Richard D, Kundig C, Ouellette M: A new type of high affinity
folic acid transporter in the protozoan parasite Leishmania
and deletion of its gene in methotrexate-resistant cells. J Biol
Chem 2002, 277:29460-29467.
21. El Fadili A, Kundig C, Roy G, Ouellette M: Inactivation of the Leish-
mania tarentolae pterin transporter (BT1) and reductase
(PTR1) genes leads to viable parasites with changes in folate
metabolism and hypersensitivity to the antifolate
methotrexate. J Biol Chem 2004, 279:18575-18582.
22. Ouellette M, Hettema E, Wust D, Fase-Fowler F, Borst P: Direct
and inverted DNA repeats associated with P-glycoprotein
gene amplification in drug resistant Leishmania. EMBO J 1991,
10:1009-1016.
23. Grondin K, Papadopoulou B, Ouellette M: Homologous recombi-
nation between direct repeat sequences yields P-glycopro-
tein containing amplicons in arsenite resistant Leishmania.
Nucleic Acids Res 1993, 21:1895-1901.
24. Grondin K, Roy G, Ouellette M: Formation of extrachromo-
somal circular amplicons with direct or inverted duplications
in drug-resistant Leishmania tarentolae. Mol Cell Biol 1996,
Genome Biology 2008, Volume 9, Issue 7, Article R115 Ubeda et al. R115.15
Genome Biology 2008, 9:R115
16:3587-3595.
25. Hightower RC, Wong ML, Ruiz-Perez L, Santi DV: Electron micro-
scopy of amplified DNA forms in antifolate-resistant Leish-
mania. J Biol Chem 1987, 262:14618-14624.
26. Kapler GM, Beverley SM: Transcriptional mapping of the ampli-
fied region encoding the dihydrofolate reductase-thymi-
dylate synthase of Leishmania major reveals a high density of
transcripts, including overlapping and antisense RNAs. Mol
Cell Biol 1989, 9:3959-3972.
27. Arrebola R, Olmo A, Reche P, Garvey EP, Santi DV, Ruiz-Perez LM,
Gonzalez-Pacanowska D: Isolation and characterization of a
mutant dihydrofolate reductase- thymidylate synthase from
methotrexate-resistant Leishmania cells. J Biol Chem 1994,
269:10590-10596.
28. Kündig C, Leblanc E, Papadopoulou B, Ouellette M: Role of the
locus and of the resistance gene on gene amplification fre-
quency in methotrexate resistant Leishmania tarentolae.
Nucleic Acids Res 1999, 27:3653-3659.
29. Guimond C, Trudel N, Brochu C, Marquis N, El Fadili A, Peytavi R,
Briand G, Richard D, Messier N, Papadopoulou B, Corbeil J, Bergeron
MG, Légaré D, Ouellette M: Modulation of gene expression in
Leishmania drug resistant mutants as determined by tar-
geted DNA microarrays. Nucleic Acids Res 2003, 31:5886-5896.
30. Callahan HL, Beverley SM: A member of the aldoketo reductase
family confers methotrexate resistance in Leishmania. J Biol
Chem 1992, 267:24165-24168.
31. Papadopoulou B, Roy G, Ouellette M: A novel antifolate resist-
ance gene on the amplified H circle of Leishmania. EMBO J
1992,
11:3601-3608.
32. Nare B, Hardy LW, Beverley SM: The roles of pteridine reduct-
ase 1 and dihydrofolate reductase- thymidylate synthase in
pteridine metabolism in the protozoan parasite Leishmania
major. J Biol Chem 1997, 272:13883-13891.
33. Wang J, Leblanc E, Chang CF, Papadopoulou B, Bray T, Whiteley JM,
Lin SX, Ouellette M: Pterin and folate reduction by the Leish-
mania tarentolae H locus short- chain dehydrogenase/reduct-
ase PTR1. Arch Biochem Biophys 1997, 342:197-202.
34. White TC, Fase-Fowler F, van Luenen H, Calafat J, Borst P: The H
circles of Leishmania tarentolae are a unique amplifiable sys-
tem of oligomeric DNAs associated with drug resistance. J
Biol Chem 1988, 263:16977-16983.
35. Petrillo-Peixoto ML, Beverley SM: Amplified DNAs in laboratory
stocks of Leishmania tarentolae: extrachromosomal circles
structurally and functionally similar to the inverted-H-region
amplification of methotrexate-resistant Leishmania major.
Mol Cell Biol 1988, 8:5188-5199.
36. Hightower RC, Ruiz-Perez LM, Wong ML, Santi DV: Extrachromo-
somal elements in the lower eukaryote Leishmania. J Biol
Chem 1988, 263:16970-16976.
37. Olmo A, Arrebola R, Bernier V, Gonzalez-Pacanowska D, Ruiz-Perez
LM: Co-existence of circular and multiple linear amplicons in
methotrexate-resistant Leishmania. Nucleic Acids Res 1995,
23:2856-2864.
38. Grondin K, Kundig C, Roy G, Ouellette M: Linear amplicons as
precursors of amplified circles in methotrexate-resistant
Leishmania tarentolae. Nucleic Acids Res 1998, 26:3372-3378.
39. El Fadili A, Richard D, Kundig C, Ouellette M: Effect of poly-
glutamylation of methotrexate on its accumulation and the
development of resistance in the protozoan parasite Leish-
mania.
Biochem Pharmacol 2003, 66:999-1008.
40. Gagnon D, Foucher A, Girard I, Ouellette M: Stage specific gene
expression and cellular localization of two isoforms of the
serine hydroxymethyltransferase in the protozoan parasite
Leishmania. Mol Biochem Parasitol 2006, 150:63-71.
41. Drummelsmith J, Brochu V, Girard I, Messier N, Ouellette M: Pro-
teome mapping of the protozoan parasite Leishmania and
application to the study of drug targets and resistance
mechanisms. Mol Cell Proteomics 2003, 2:146-155.
42. Gallego C, Estevez AM, Farez E, Ruiz-Perez LM, Gonzalez-Pac-
anowska D: Overexpression of AP endonuclease protects
Leishmania major cells against methotrexate induced DNA
fragmentation and hydrogen peroxide. Mol Biochem Parasitol
2005, 141:191-197.
43. Wilson M, DeRisi J, Kristensen HH, Imboden P, Rane S, Brown PO,
Schoolnik GK: Exploring drug-induced alterations in gene
expression in Mycobacterium tuberculosis by microarray
hybridization. Proc Natl Acad Sci USA 1999, 96:12833-12838.
44. Lee CH, Macgregor PF: Using microarrays to predict resistance
to chemotherapy in cancer patients. Pharmacogenomics 2004,
5:611-625.
45. Brazas MD, Hancock RE: Using microarray gene signatures to
elucidate mechanisms of antibiotic action and resistance.
Drug Discov Today 2005, 10:1245-1252.
46. Ouellette M, Drummelsmith J, Leprohon P, El Fadili K, Foucher A,
Vergnes B, Légaré D: Drug Resistance in Leishmania Norwich, UK:
Horizon Press; 2007.
47. Saxena A, Worthey EA, Yan S, Leland A, Stuart KD, Myler PJ: Evalu-
ation of differential gene expression in Leishmania major
Friedlin procyclics and metacyclics using DNA microarray
analysis. Mol Biochem Parasitol 2003, 129:103-114.
48. Akopyants NS, Matlib RS, Bukanova EN, Smeds MR, Brownstein BH,
Stormo GD, Beverley SM: Expression profiling using random
genomic DNA microarrays identifies differentially expressed
genes associated with three major developmental stages of
the protozoan parasite Leishmania major
. Mol Biochem Parasitol
2004, 136:71-86.
49. Saxena A, Lahav T, Holland N, Aggarwal G, Anupama A, Huang Y,
Volpin H, Myler PJ, Zilberstein D: Analysis of the Leishmania
donovani transcriptome reveals an ordered progression of
transient and permanent changes in gene expression during
differentiation. Mol Biochem Parasitol 2007, 152:53-65.
50. Srividya G, Duncan R, Sharma P, Raju BV, Nakhasi HL, Salotra P:
Transcriptome analysis during the process of in vitro differ-
entiation of Leishmania donovani using genomic microarrays.
Parasitology 2007, 134:1527-1539.
51. Almeida R, Gilmartin BJ, McCann SH, Norrish A, Ivens AC, Lawson
D, Levick MP, Smith DF, Dyall SD, Vetrie D, Freeman TC, Coulson
RM, Sampaio I, Schneider H, Blackwell JM: Expression profiling of
the Leishmania life cycle: cDNA arrays identify developmen-
tally regulated genes present but not annotated in the
genome. Mol Biochem Parasitol 2004, 136:87-100.
52. Singh N, Almeida R, Kothari H, Kumar P, Mandal G, Chatterjee M,
Venkatachalam S, Govind MK, Mandal SK, Sundar S: Differential
gene expression analysis in antimony-unresponsive Indian
kala azar (visceral leishmaniasis) clinical isolates by DNA
microarray. Parasitology 2007, 134:777-787.
53. McNicoll F, Drummelsmith J, Muller M, Madore E, Boilard N, Ouel-
lette M, Papadopoulou B: A combined proteomic and transcrip-
tomic approach to the study of stage differentiation in
Leishmania infantum. Proteomics 2006, 6:3567-3581.
54. Leprohon P, Legare D, Girard I, Papadopoulou B, Ouellette M: Mod-
ulation of Leishmania ABC protein gene expression through
life stages and among drug-resistant parasites. Eukaryot Cell
2006, 5:1713-1725.
55. Holzer TR, McMaster WR, Forney JD: Expression profiling by
whole-genome interspecies microarray hybridization
reveals differential gene expression in procyclic promastig-
otes, lesion-derived amastigotes, and axenic amastigotes in
Leishmania mexicana. Mol Biochem Parasitol 2006,
146:198-218.
56. Leifso K, Cohen-Freue G, Dogra N, Murray A, McMaster WR:
Genomic and proteomic expression analysis of Leishmania
promastigote and amastigote life stages: the Leishmania
genome is constitutively expressed. Mol Biochem Parasitol 2007,
152:35-46.
57. El Fadili K, Messier N, Leprohon P, Roy G, Guimond C, Trudel N, Sar-
avia NG, Papadopoulou B, Legare D, Ouellette M: Role of the ABC
transporter MRPA (PGPA) in antimony resistance in Leish-
mania infantum axenic and intracellular amastigotes. Antimi-
crob Agents Chemother 2005, 49:1988-1993.
58. Clayton CE: Life without transcriptional control? From fly to
man and back again. EMBO J 2002, 21:1881-1888.
59. Blaineau C, Bastien P, Rioux JA, Roizes G, Pages M: Long-range
restriction maps of size-variable homologous chromosomes
in Leishmania infantum. Mol Biochem Parasitol 1991, 46:292-302.
60. Sanger Institute Pathogen Sequencing Unit [http://
www.genedb.org/]
61. Duesberg P, Li R, Sachs R, Fabarius A, Upender MB, Hehlmann R:
Cancer drug resistance: the central role of the karyotype.
Drug Resist Updat 2007, 10:51-58.
62. Selmecki A, Forche A, Berman J: Aneuploidy and isochromo-
some formation in drug-resistant Candida albicans. Science
2006, 313:367-370.
63. Coste A, Selmecki A, Forche A, Diogo D, Bougnoux ME, d'Enfert C,
Berman J, Sanglard D: Genotypic evolution of azole resistance
mechanisms in sequential Candida albicans isolates. Eukaryot
Cell 2007, 6:1889-1904.
Genome Biology 2008, 9:R115
Genome Biology 2008, Volume 9, Issue 7, Article R115 Ubeda et al. R115.16
64. Haimeur A, Guimond C, Pilote S, Mukhopadhyay R, Rosen BP, Poulin
R, Ouellette M: Elevated levels of polyamines and trypan-
othione resulting from overexpression of the ornithine
decarboxylase gene in arsenite-resistant Leishmania. Mol
Microbiol 1999, 34:726-735.
65. Drummelsmith J, Girard I, Trudel N, Ouellette M: Differential pro-
tein expression analysis of Leishmania major reveals novel
roles for methionine adenosyltransferase and S-adenosylme-
thionine in methotrexate resistance. J Biol Chem 2004,
279:33273-33280.
66. Marquis N, Gourbal B, Rosen BP, Mukhopadhyay R, Ouellette M:
Modulation in aquaglyceroporin AQP1 gene transcript levels
in drug-resistant Leishmania. Mol Microbiol 2005, 57:1690-1699.
67. Ibrahim ME, Barker DC: The origin and evolution of the Leish-
mania donovani complex as inferred from a mitochondrial
cytochrome oxidase II gene sequence. Infect Genet Evol 2001,
1:61-68.
68. Rovai L, Tripp C, Stuart K, Simpson L: Recurrent polymorphisms
in small chromosomes of Leishmania tarentolae after nutri-
ent stress or subcloning. Mol Biochem Parasitol 1992, 50:115-125.
69. Tripp CA, Myler PJ, Stuart K: A DNA sequence (LD1) which
occurs in several genomic organizations in Leishmania. Mol
Biochem Parasitol 1991, 47:151-156.
70. Navarro M, Liu J, Muthui D, Ortiz G, Segovia M, Hamers R: Inverted
repeat structure and homologous sequences in the LD1
amplicons of Leishmania spp. Mol Biochem Parasitol 1994,
68:69-80.
71. Ortiz G, Segovia M: Characterisation of the novel junctions of
two minichromosomes of Leishmania major. Mol Biochem
Parasitol 1996, 82:137-144.
72. Dubessay P, Ravel C, Bastien P, Lignon MF, Ullman B, Pages M,
Blaineau C: Effect of large targeted deletions on the mitotic
stability of an extra chromosome mediating drug resistance
in Leishmania. Nucleic Acids Res 2001, 29:3231-3240.
73. Genest PA, ter Riet B, Dumas C, Papadopoulou B, van Luenen HG,
Borst P: Formation of linear inverted repeat amplicons fol-
lowing targeting of an essential gene in Leishmania. Nucleic
Acids Res 2005, 33:1699-1709.
74. Butler DK, Yasuda LE, Yao MC: An intramolecular recombina-
tion mechanism for the formation of the rRNA gene palin-
drome of Tetrahymena thermophila. Mol Cell Biol 1995,
15:7117-7126.
75. Albrecht EB, Hunyady AB, Stark GR, Patterson TE: Mechanisms of
sod2 gene amplification in Schizosaccharomyces pombe. Mol
Biol Cell 2000, 11:873-886.
76. Tanaka H, Tapscott SJ, Trask BJ, Yao MC: Short inverted repeats
initiate gene amplification through the formation of a large
DNA palindrome in mammalian cells. Proc Natl Acad Sci USA
2002, 99:8772-8777.
77. Tanaka H, Cao Y, Bergstrom DA, Kooperberg C, Tapscott SJ, Yao
MC: Intrastrand annealing leads to the formation of a large
DNA palindrome and determines the boundaries of genomic
amplification in human cancer. Mol Cell Biol 2007, 27:1993-2002.
78. Cruz AK, Titus R, Beverley SM: Plasticity in chromosome
number and testing of essential genes in Leishmania by
targeting. Proc Natl Acad Sci USA 1993, 90:1599-1603.
79. Tanaka H, Bergstrom DA, Yao MC, Tapscott SJ: Widespread and
nonrandom distribution of DNA palindromes in cancer cells
provides a structural platform for subsequent gene
amplification. Nat Genet 2005,
37:320-327.
80. Sambrook J, Fritsch EF, Maniatis T: Molecular Cloning New York: Cold
Spring Harbour Laboratory Press; 1989.
81. Ivens AC, Peacock CS, Worthey EA, Murphy L, Aggarwal G, Berriman
M, Sisk E, Rajandream MA, Adlem E, Aert R, Anupama A, Apostolou
Z, Attipoe P, Bason N, Bauser C, Beck A, Beverley SM, Bianchettin G,
Borzym K, Bothe G, Bruschi CV, Collins M, Cadag E, Ciarloni L, Clay-
ton C, Coulson RM, Cronin A, Cruz AK, Davies RM, De Gaudenzi J,
et al.: The genome of the kinetoplastid parasite, Leishmania
major. Science 2005, 309:436-442.
82. Peacock CS, Seeger K, Harris D, Murphy L, Ruiz JC, Quail MA, Peters
N, Adlem E, Tivey A, Aslett M, Kerhornou A, Ivens A, Fraser A, Rajan-
dream MA, Carver T, Norbertczak H, Chillingworth T, Hance Z, Jag-
els K, Moule S, Ormond D, Rutter S, Squares R, Whitehead S,
Rabbinowitsch E, Arrowsmith C, White B, Thurston S, Bringaud F,
Baldauf SL, et al.: Comparative genomic analysis of three Leish-
mania species that cause diverse human disease. Nat Genet
2007, 39:839-847.
83. Smyth GK: Linear models and empirical bayes methods for
assessing differential expression in microarray experiments.
Stat Appl Genet Mol Biol 2004, 3:Article3.
84. Smyth GK, Speed T: Normalization of cDNA microarray data.
Methods 2003, 31:265-273.
85. Smyth GK, Michaud J, Scott HS: Use of within-array replicate
spots for assessing differential expression in microarray
experiments. Bioinformatics 2005, 21:2067-2075.
86. Oshlack A, Chabot AE, Smyth GK, Gilad Y: Using DNA microar-
rays to study gene expression in closely related species. Bio-
informatics 2007, 23:1235-1242.
87. Ritchie ME, Diyagama D, Neilson J, van Laar R, Dobrovic A, Holloway
A, Smyth GK: Empirical array quality weights in the analysis of
microarray data. BMC Bioinformatics 2006, 7:261.
88. Ritchie ME, Silver J, Oshlack A, Holmes M, Diyagama D, Holloway A,
Smyth GK: A comparison of background correction methods
for two-colour microarrays. Bioinformatics 2007, 23:
2700-2707.
89. Yang Y, Hoh J, Broger C, Neeb M, Edington J, Lindpaintner K, Ott J:
Statistical methods for analyzing microarray feature data
with replications. J Comput Biol 2003, 10:157-169.
90. Quebec Genomics Center [ />