Báo cáo y học: "MotifCluster: an interactive online tool for clustering and visualizing sequences using shared motifs" pot
Bạn đang xem bản rút gọn của tài liệu. Xem và tải ngay bản đầy đủ của tài liệu tại đây (3.49 MB, 13 trang )
Genome Biology 2008, 9:R128
Open Access
2008Hamadyet al.Volume 9, Issue 8, Article R128
Software
MotifCluster: an interactive online tool for clustering and visualizing
sequences using shared motifs
Micah Hamady
*
, Jeremy Widmann
†
, Shelley D Copley
‡
and Rob Knight
†
Addresses:
*
Department of Computer Science, University of Colorado, Boulder, CO 80309, USA.
†
Department of Chemistry and Biochemistry,
University of Colorado, Boulder, CO 80309, USA.
‡
Department of Molecular, Cellular and Developmental Biology and Cooperative Institute for
Research in Environmental Sciences (CIRES), University of Colorado, Boulder, CO 80309, USA.
Correspondence: Rob Knight. Email:
© 2008 Hamady et al.; licensee BioMed Central Ltd.
This is an open access article distributed under the terms of the Creative Commons Attribution License ( which
permits unrestricted use, distribution, and reproduction in any medium, provided the original work is properly cited.
MotifCluster<p>MotifCluster finds related motifs in a set of sequences and clusters the sequences into families using the motifs they contain.</p>
Abstract
MotifCluster finds related motifs in a set of sequences, and clusters the sequences into families
using the motifs they contain. MotifCluster, at lets users test
whether proteins are related, cluster sequences by shared conserved motifs, and visualize motifs
mapped onto trees, sequences and three-dimensional structures. We demonstrate MotifCluster's
accuracy using gold-standard protein superfamilies; using recommended settings, families were
assigned to the correct superfamilies with 0.17% false positive and no false negative assignments.
Rationale
Detection of evolutionary relationships between very dis-
tantly related protein families is important for efforts to
assign functions to newly identified proteins, as well as to
understand the evolutionary mechanisms by which new func-
tions have emerged. Pairwise sequence identities between
proteins in distantly related families are often statistically
insignificant. Algorithms such as COMPASS [1] that evaluate
relationships between profiles representative of protein fam-
ilies are perhaps the most powerful method for identification
of distant sequence relationships, although iterative BLAST
approaches, such as PSI-BLAST [2] and SHOTGUN [3], are
also valuable. Identification of evolutionary relationships
between protein families and superfamilies sets the stage for
analysis of the sequence changes that led to the distinctive
structural and functional characteristics of protein families.
In many enzyme superfamilies, the ability to catalyze an
ancestral catalytic step has been retained, while additional
steps have been added before or after the ancestral step. For
example, in the enolase superfamily, abstraction of a proton
from a position alpha to a carbonyl is the conserved catalytic
step; the fate of the resulting enolate intermediate varies in
different families according to the disposition of catalytic
groups in the active site [4].
Identification of short, highly conserved sequences, known as
motifs, in proteins provides important insights into the
regions of proteins that have been conserved within a super-
family or suprafamily, as well as those that have diverged in
specific families. Consideration of these motifs in conjunction
with mechanistic and structural information can provide a
picture of the sequence changes that led to acquisition of new
catalytic capabilities. Two motif-finding algorithms, MEME
(Multiple EM for motif elicitation) [5] and the Gibbs Sampler
[6], are in widespread use. MEME identifies motifs by search-
ing for a set of short, conserved sequences (motifs) in a set of
longer, less conserved sequences. MEME assumes that each
of the sequences in the input set contains at least one motif.
The Gibbs Sampler works by searching for a predefined
number of motifs with minimum and maximum lengths. A
background probability model for chance matches based on
amino acid occurrences is determined from the input set of
Published: 15 August 2008
Genome Biology 2008, 9:R128 (doi:10.1186/gb-2008-9-8-r128)
Received: 12 February 2008
Revised: 23 June 2008
Accepted: 15 August 2008
The electronic version of this article is the complete one and can be
found online at />Genome Biology 2008, 9:R128
Genome Biology 2008, Volume 9, Issue 8, Article R128 Hamady et al. R128.2
sequences. Motifs are discovered by searching for regions in
the set of sequences that do not fit this background probabil-
ity model. Both algorithms report motifs present in subsets of
a user-provided set of sequences, along with statistical infor-
mation regarding the significance of each motif in the entire
set as well as within a particular sequence.
A drawback of these algorithms is that the results depend on
the order of sequences provided in the input set in an unpre-
dictable way. Clustering sets of sequences based upon visual
analysis of motifs, as in [7], is both subjective and time-con-
suming, as it requires re-ordering of the input set. Further-
more, motifs are presented solely in terms of primary
sequence; mapping of motifs onto structures, which is critical
for recognizing the roles played by specific motifs, requires
additional manipulation.
In this paper, we present a new online tool, MotifCluster, that
clusters input sequences according to the presence or absence
of user-supplied motifs. MotifCluster uses any of six different
distance metrics. Some of these metrics group sequences that
contain the same motifs in the same order, and others look
solely at which motifs are shared. The ability to take order
into account is critical in some cases, because motifs may
need to be in the context of a specific structural context to
have biological activity. However, domain shuffling and cir-
cular permutation of sequences are not uncommon, so it can
also be important to recognize the occurrence of shared
motifs in an unusual order. Longer or more highly significant
motifs can be given more weight than shorter or less signifi-
cant motifs, or all motifs can be treated equally. Sequences
can also be labeled with user-defined designations, such as
family assignment, and the associations between families and
motifs can then be used to explore functional relationships. In
addition to clustering input sequences according to the motifs
they contain, MotifCluster automatically maps motifs onto
the structures of all proteins in the set for which structural
information is available, providing an immediate visual
assessment of the location of each motif. MotifCluster can be
used online from the URL provided in the abstract, which also
links to documentation and a downloadable version.
Key features
MotifCluster allows sequences to be clustered according to
their shared motifs in several ways, and facilitates identifica-
tion of relationships between groups of sequences that share
specific motifs. MotifCluster provides methods for testing
whether different sequence families are related to one
another, whether the motifs are meaningful in the context of
the structures corresponding to each sequence (when availa-
ble), and whether the patterns of motifs identified are consist-
ent with standard phylogenetic analysis. The latter feature is
particularly important, as standard phylogenetic analysis
becomes difficult when sequences are highly diverse because
alignments become unreliable below about 30% sequence
identity [8]. Brief summaries of MotifCluster functionality
and that of several tools related to it can be found in Table 1.
Several reports are generated after uploading a set of aligned
or unaligned sequences, motif information, and, optionally,
mappings that relate sequence identifiers (IDs) to known
gene families. In these reports, each motif is assigned a
unique style (color and font display, for example, bold or
italic) that is used consistently throughout the displays. Each
report format can be selected from a drop down list on the
search results page.
Displaying motifs on trees
The first four report formats display motifs, either including
or excluding the rest of the sequence, on a tree based either on
the sequences or the motifs. These reports are important for
establishing whether a particular motif fits the overall phylo-
genetic pattern, or has evolved convergently in different line-
ages, and can be especially useful for establishing
relationships between sequences that are too diverse for con-
struction of phylogenetic trees using standard methods. They
are also important for visualizing where the motifs occur in
the sequences, which can be important for detecting domain
shuffling. These four report formats are described below.
Motifs on motif-based tree
This tree is built using a matrix of distances calculated from
the motif-based alignment. The metric used to build this tree
reflects similarities only among the motifs (and not in the rest
of the sequences). The color-coded motifs and location infor-
mation are displayed, along with links to available Protein
Data Bank (PDB) structures. The PDB links allow the user to
view the motifs found in a particular sequence on the corre-
sponding structure using PyMol [9]. This format is especially
useful for visually evaluating whether the clustering method
chosen groups the motifs together in an intuitively reasonable
way, and for checking whether motifs are shuffled or circu-
larly permuted.
Sequences on motif-based tree
Similar to the 'Motifs on motif-based tree' format above,
except that the full sequences are shown (rather than just the
sequences of the motifs). This format is useful for deciding
whether there are extended regions of conservation around
the motifs in specific groups of sequences, and like the format
above, for identifying domain shuffling or circular permuta-
tion of motifs.
Motifs on sequence-based tree (full-length)
Similar to the 'Sequences on motif-based tree' format above,
except that a phylogenetic tree is generated using MUSCLE
(Multiple sequence comparison by log-expectation; with
default parameters) based on similarities among the full-
length sequences. Motifs are highlighted and displayed as for
the 'Motifs on motif-based tree' format. This display is useful
for testing whether the pattern of motif conservation follows
Genome Biology 2008, Volume 9, Issue 8, Article R128 Hamady et al. R128.3
Genome Biology 2008, 9:R128
Table 1
Summary of key features of MotifCluster and a selection of other programs that perform clustering of motifs or remote homology
detection
Strategy Program Overview of program Publication
Clustering proteins by motifs
they contain
MotifCluster Takes aligned or unaligned protein and nucleotide sequences and a MEME file
showing motifs; allows clustering of the sequences according to the motifs
they contain, and visualization of the motifs on the aligned and unaligned
sequences and three-dimensional structures
This article
Clustering of transcription
factor binding sites (in DNA)
MCAST Takes list of transcription factor binding sites as input: uses hidden Markov
models to find cis-regulatory modules in DNA
[
21]
Cluster-Buster Takes list of transcription factor binding sites as input: uses Forward
algorithm and expected uniform distribution to find motif co-occurrence in
DNA
[
22]
ClusterDraw Takes list of transcription factor binding sites as input: uses r-scan algorithm
and sweep over parameter values to visualize significant clusters as peaks on
the DNA sequence
[
23]
COMET Calculates significance of collection of position-specific score matrices that
appear in order: can apply to DNA or protein, in principle
[
24]
PEAKS Calculates significance of collection of transcription factor binding sites that
appear at specified distance from transcription start site or other feature in
the DNA
[
25]
CompMoby Aligns all pairs of motifs that appear significant in different promoters, then
groups these into clusters using the CAST algorithm. DNA-specific
[
26]
CREME Identifies groups of DNA motifs that co-occur significantly within a defined
distance using both order-dependent and order-independent models
[
27]
PHYLOCLUS Uses Bayesian method to find clusters of evolutionarily conserved DNA
motifs that appear in different promoters.
[
28]
INCLUSive Clusters genes based on microarray analysis: feeds promoters to Gibbs
sampler to find DNA motifs overrepresented in each cluster
[
29]
Identifying kernels for SVMs* SVM kernels Introduces kernels based on k-word occurrences and best BLAST hit for
SVM clustering: does not focus on conserved motifs
[
30]
WCM (word correlation
matrices)
Introduces k-word kernel for SVM clustering based on correlations in
appearance of pairs of k-words: does not focus on conserved motifs.
[
31]
ODH (oligomer distance
histograms)
Introduces new kernel for SVM clustering based on histograms of distances
between all words in protein: does not focus on conserved motifs
[
32]
Iterative BLAST Shotgun BLAST-based approach for identifying remote homologs by iterative
searches: not motif-based
[
3]
DivergentSet Among other features, can perform BLAST and PSI-BLAST versions of
Shotgun and choose representative sequences of each group: not motif-
based
[
20]
Cascade PSI-BLAST Performs iterative steps of PSI-BLAST, otherwise like Shotgun: not motif-
based.
[
33]
ProClust Performs graph-based connection of proteins based on pairwise sequence
similarity: not motif based
[
34]
k-word clustering CD-Hit Clusters proteins based on shared segments of overall sequence, not by
motifs already known to be significant
[
35]
Profile-profile alignment COMPASS Performs profile-profile alignments for remote homology detection: assesses
statistical significance matches in the profiles overall, rather than specifically
using shared motifs
[
1]
Clustering of motifs STAMP Aligns motifs with one another so that relationships among motifs can be
detected; performs many other tasks for promoter characterization, but
specific to promoters
[
36]
TAMO Performs many functions for cis-regulatory analysis: is able to cluster DNA
motifs with one another
[
37]
SOMBRERO Aligns and clusters DNA motifs with one another to improve transcription
factor binding site searches
[
38]
Identification of functions in
labeled structures
FunClust Takes set of three-dimensional structures with annotated functions;
identifies three-dimensional motif fragments that are common to the
structures with each function.
[
39]
*SVMs are support vector machines, a common machine learning approach to pattern classification. A kernel is a function that calculates the inner
product of all pairs of input vectors in an abstract space, which is an important step in the process and affects the clustering.
Genome Biology 2008, 9:R128
Genome Biology 2008, Volume 9, Issue 8, Article R128 Hamady et al. R128.4
the overall conservation of the sequences: if motifs have not
evolved convergently and the sequences are sufficiently
closely related to retain phylogenetic signal, the tree built
using the motifs will be approximately the same as the tree
built using the sequences, and, in both cases, large clades of
sequences containing the motifs should be observed. Alterna-
tively, if the sequences are so highly diverged that phyloge-
netic reconstruction is unreliable (the so-called 'twilight zone'
below 30% conservation [8]), the motif tree may cluster fam-
ily members together when the sequence tree is
uninformative.
Motifs on sequence-based tree (motif regions only)
Similar to 'Sequences on motif-based tree' and 'Motifs on
sequence-based tree (full-length)' formats above: displays
only the sequences of the motifs on the tree built using the
full-length sequences.
Identifying which sequences contain particular motifs
The next group of reports shows which sequences contain
each motif. These reports are useful for evaluating which
motifs are meaningful, and which tend to occur together in
the same sequences.
Statistics by sequence
Displays a table of motifs and associated P-values, grouped by
sequence. For each sequence, motifs are displayed in order of
decreasing significance (ascending P-value). A display under-
neath the sequence indicates conservation: positions anno-
tated with asterisks match the motif consensus at positions
that are not highly conserved (according to a user-defined
threshold, which is set to 90% by default); positions anno-
tated with gray shaded + sighs match the consensus at posi-
tions that are highly conserved, and red positions are
mismatches at positions that are highly conserved. This for-
mat is especially useful for finding systematic differences that
may be functionally important within motifs. For example,
single amino acid changes in a motif conserved in a super-
family may be related to divergence in function in a particular
family.
Statistics by motif
Displays a table of motifs and associated P-values, grouped by
motif. For each motif, an alignment of the motif regions is dis-
played, with the majority consensus of the motif displayed
above the alignment. Highly conserved columns (determined
by the 'conservation threshold' parameter) in the consensus
motif are colored. Positions within individual motifs are high-
lighted in grey if they match the consensus sequence. Like the
'Statistics by sequence' format, this format is useful for find-
ing sequence changes that are potentially associated with
functional changes.
Exploratory analyses
The final group of reports provides tools for exploratory
analysis.
Highlight alignment
Displays an interactive form allowing the user to select spe-
cific motifs to highlight in the alignment. This format is useful
for assisting in decisions about which motifs are likely to be
real and which are false positives, and reduces the visual com-
plexity in the motif- and sequence-based tree formats by
allowing the user to focus on specific motifs of interest.
Network view
Displays all sequences in a network representation, with each
connected component drawn as a separate network. The con-
nected components are determined by the 'edge threshold'
parameter. For example, if this parameter is 1, each con-
nected component consists of all the sequences that share at
least one motif with any other sequence in the connected
component. If the parameter is 2, all sequences in a con-
nected component must share at least two motifs with at least
one other sequence in the same connected component. The
list of IDs for the sequences in each connected component is
displayed, and the actual sequences in each connected com-
ponent can be downloaded as a FASTA file.
Supported motif formats
We currently support motifs generated using either MEME
[5] or the Gibbs sampler [6] so that users can easily compare
the two methods. We plan to add support for other motif def-
initions, including user-supplied weight matrices, and for
other motif finding algorithms.
Distance calculations and clustering
Measuring distance between sequences using motifs
The distance between pairs of sequences based upon the
motifs they contain can be calculated using several methods.
The following distance measures are currently implemented
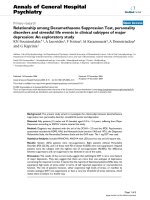
in MotifCluster (Figure 1).
Common fraction score
The Common fraction score method (Figure 1a) calculates the
fraction of motifs shared between each pair of sequences,
ignoring the order in which the motifs occur in the sequence
and the number of times each motif occurs.
Longest common substring score
The Longest common substring (LCS) score method (Figure
1b) finds the longest common substring of motifs that occurs
in both sequences. Instead of using the actual motif
sequences, the substring is constructed by assigning a unique
character to each motif, and then using suffix trees to calcu-
late the longest pattern of motifs that occurs in the same order
in both sequences. This method does not account for differ-
ences in spacing between the motifs. The LCS score is a meas-
ure of similarity, which is converted into a distance metric in
two different ways. LCS (max-actual) scores the distance as
the difference between the best LCS score for any pair of
sequences in the set and the LCS score for the pair of
Genome Biology 2008, Volume 9, Issue 8, Article R128 Hamady et al. R128.5
Genome Biology 2008, 9:R128
sequences under consideration. LCS (1-(actual/max)) scores
the distance based on the ratio between the LCS score for the
pair of sequences under consideration and the best LCS score
for any pair of sequences in the set.
Needleman-Wunsch score
The Needleman-Wunsch (NW) score method (Figure 1c) uses
the NW global pairwise alignment algorithm [10] to align the
two motif strings, converted from the raw sequences to
unique characters as described for LCS scores above. The
method can either be unweighted (all motifs are treated
equally), or weighted (highly significant motifs count for
more than less significant motifs). Like the LCS score, the raw
NW score is a measure of similarity. It is converted into a dis-
tance metric using the same methodology (either (max-
actual) or (1-(actual/max))). Like the LCS score, the NW score
takes into account the order, but not the spacing, between the
motifs. Unlike the LCS score, the NW score is robust to inser-
tions and deletions that disrupt what is otherwise a long,
shared sequence of motifs.
Delta-delta score
The delta-delta score (Figure 1d) measures the distances
between aligned motifs in each pair of sequences, and sums
the differences in distances between each pair of motifs in the
aligned pair of sequences. Aligned motifs with equal spacing
in both sequences have a delta-delta score of zero. When
motif spacing is unequal, the delta-delta score is > 0. The
delta-delta score is thus a distance metric, and does not need
to be converted from a similarity metric as do the LCS and
NW scores.
UPGMA clustering
The UPGMA (Unweighted pair group method with arithmetic
mean) clustering algorithm [11] uses a distance matrix to find
successive nested clusters by identifying the nearest neigh-
bors at each step, then merging these neighbors. When per-
forming motif-based clustering, we generate the distance
matrix using one of the user-specified distance measures, and
use this distance matrix as input into the UPGMA routine,
yielding a tree that clusters the sequences according to the
motifs they contain. To compare the motif-based clustering
with traditional sequence-based clustering, we also generate
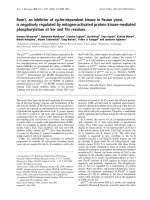
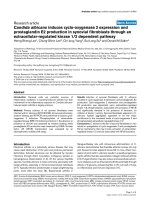
Methods for measuring distances between sequences using motif informationFigure 1
Methods for measuring distances between sequences using motif information. (a) Common fraction score; (b) Longest common substring score; (c)
Needleman-Wunsch alignment score; (d) delta-delta score.
(a) Common fraction score (b) Longest common substring score
(d) Delta-delta score(c) NW alignment score
|| |
|
|
|
|
|
|
|
|
|
|
|
|
|
|
|
|
|
|
|
|
|
|
|
|
|| |
|
|
|
|
|
|
|
|
|
|
|
|
|
|
|
|
|
|
|
|
|
|
|
|
Genome Biology 2008, 9:R128
Genome Biology 2008, Volume 9, Issue 8, Article R128 Hamady et al. R128.6
trees using MUSCLE [12]. MUSCLE groups the sequences
using the fraction of words of a specific length that are shared
between the sequences, and thus estimates the overall dis-
tance between the entire sequences rather than just between
the motifs.
Graphs and connected components
We generate a weighted graph showing the relationships
between all sequences in terms of the motifs they share. Ver-
tices in the graph represent a sequence in the input set, and
each edge in the graph represents a relationship in which two
sequences share one or more motifs. Thus, each sequence is
connected to every other sequence with which it shares at
least one common motif. The weight of each edge in the graph
is calculated as the number of motifs shared by each pair of
sequences. Once the full weighted graph has been generated,
edges whose weight is less than the 'edge threshold' are
removed from the graph. For example, if the edge threshold is
2 (the default), the connection is broken between any two
sequences that share only a single motif.
The display shows a thumbnail of each connected component,
suppressing figures for connected components that consist of
only one sequence. These thumbnails can be expanded into
larger figures, including EPS output for printing or publica-
tion. The graphs are visualized using the random layout
option in NetworkX [13], which we found to be both the fast-
est and most readable option for the highly connected graphs
produced by MotifCluster.
Implementation
Most code described here was written in Python 2.4 and
tested on MacOSX and Linux. The exceptions are the NW
algorithm [10], which we implemented in C for performance
reasons, the MUSCLE [12], MEME [5] and Gibbs Sampler [6]
programs, and the libstree suffix tree library [14], for which
we used the published implementations. The web interface
uses Apache and mod_python (Apache Software Founda-
tion). Motif clustering jobs are submitted to our Beowulf clus-
ter using PBS/TORQUE. NetworkX [13] is used in the graph
calculations. PyMol [9] is used for visualization of protein
structures. Calculation and display code have been contrib-
uted to the PyCogent project [15]. A standalone version of the
program is available for download at the MotifCluster web
site.
Example analyses
We describe the capabilities of MotifCluster using four cases
as examples. First, we use the case of the two convergently
evolved families of ribose 5-phosphate isomerases to show
that structurally distinct proteins that have the same function
can be correctly clustered. Second, we use a set of curated
superfamilies that contains 4,887 sequences in 91 families
divided among 5 superfamilies [16]. These 'gold-standard'
families and superfamilies allow us to test how well we can
recapture known relationships within and between super-
families. Third, we use two families within the haloacid dehal-
ogenase superfamily [17] to illustrate the utility of the
clustering and mapping features of MotifCluster. Finally, we
show how clustering of motifs in a set of proteins from the
highly divergent thioredoxin-fold suprafamily [7] captures
evolutionary relationships between proteins of different func-
tions when standard phylogenetic analyses fail.
MotifCluster distinguishes between unrelated families
when the edge threshold is 2 or greater: RpiA/RpiB as
a case study
Ribose 5-phosphate isomerases catalyze the interconversion
of ribulose 5-phosphate and ribose 5-phosphate. Two struc-
turally distinct families of ribose 5-phosphate isomerases
have been identified, exemplified by RpiA from Escherichia
coli and RpiB from E. coli [18,19]. This is one of many cases of
convergent evolution of the same catalytic activity in the con-
text of different structural folds. It is unlikely that the same
motifs would evolve in different structural contexts. Thus, a
potential application of MotifCluster is the identification of
unrelated families in sets of proteins that have a common
function. In such cases, clustering of sequences into two or
more families does not constitute evidence of convergent evo-
lution in the absence of structural information, but it raises a
possibility that can be further investigated.
RpiA sequences were found using PSI-BLAST [2] with an E-
value of 10
-10
and an H-value of 10
-20
with E. coli ribose 5-
phosphate isomerase (gi 16130815) as the seed. A divergent
set of 41 sequences was picked from the 465 sequences found
by PSI-BLAST using DivergentSet [20] with a 55% identity
threshold cutoff. These sequences range from 218-271 resi-
dues in length (average 235) and have an average pairwise
identity of 47.4%. RpiB sequences were found using PSI-
BLAST with an E-value of 10
-10
and an H-value of 10
-20
with E.
coli ribose 5-phosphate isomerase B (gi 16131916) as the seed.
A divergent set of 39 sequences was chosen from the 412
sequences found by PSI-BLAST search using a 55% identity
threshold cutoff. The RpiB sequences range from 140-187 res-
idues in length (average 153) and have an average pairwise
identity of 46.4%. Motifs in the combined set of sequences
were found by MEME using an E-value threshold of 10
-20
and
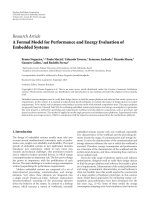
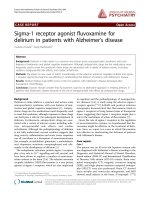
a setting of 10 expected motifs. Figure 2 shows a clustering of
these 80 sequences based on the motifs they contain, using
the NW module alignment 1-(actual/max) distance metric
with weighted motifs. Sequences of RpiA homologs are cir-
cled in red, and sequences of RpiB homologs are circled in
blue. The two families fall into two separate components
when an edge threshold of 2 is chosen. A similar result is
achieved even if the sequences in the set are not pre-ordered
into related groups. Note that several sequences in the set lack
one or more motifs characteristic of the family, but no
sequence is incorrectly placed into the wrong family. If an
edge threshold of 1 is chosen, a single false-positive motif con-
nects the two families into one component.
Genome Biology 2008, Volume 9, Issue 8, Article R128 Hamady et al. R128.7
Genome Biology 2008, 9:R128
Analysis of the gold-standard superfamilies shows that
the sensitivity and specificity of MotifCluster are
excellent
We tested MotifCluster on the gold-standard set of mechanis-
tically diverse superfamilies described by Brown et al. [16],
which contains 4,887 sequences belonging to 91 families, dis-
tributed among 5 superfamilies. This set of sequences has
been carefully curated to provide a reliably clustered set for
testing computational algorithms. Every sequence assigned
to a gold-standard family has either an experimentally deter-
mined function, or is closely related to a protein of known
function (BLAST e-value ≤ 10
-175
). We tested MotifCluster
using different edge threshold settings (that is, the number of
motifs required for a shared connection), and using the Gibbs
sampler and MEME to find the underlying motifs, in order to
test how well it was able to cluster family members within the
same superfamily. Specifically, we expect sequences from the
same superfamily to be connected by multiple motifs, but we
do not expect members of different superfamilies to be
bridged in this manner.
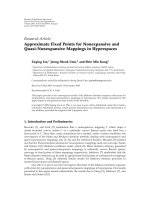
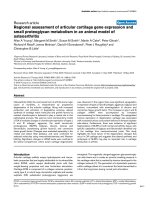
Figure 3a shows graphs of connected components generated
from sequences representing two distinct superfamilies,
using an edge threshold of 2. Dihydroorotases (red) belong to
the amidohydrolase superfamily, and β-phosphogluco-
mutases (blue) to the haloacid dehalogenase superfamily. The
sequences form two connected components, as expected
because only families within the same superfamily should
share homologous motifs. Families from different super-
families should not be connected, except when the signifi-
cance threshold is so low that motifs are found by chance.
Figure 3b shows a graph of a single connected component
that contains sequences from two different families belonging
to the amidohydrolase superfamily. Haloacid dehalogenase
(blue) and β-phosphoglucomutase (red) are divergent mem-
bers of the haloacid dehalogenase superfamily (Figure 3c).
The maximum pairwise identity between members of the two
families is 45.5%. When an edge threshold of 3 or less is used,
all of the sequences are grouped into a single connected
component.
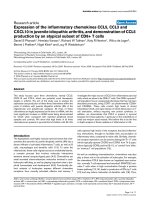
Statistics describing the performance of MotifCluster in anal-
yses of all pairs of the 91 sequence families described by
Brown et al. (a total of 4,186 pairs) are given in Figure 4. In
each case, motifs were found using a combined set of the ref-
erence sequences from the two families by both MEME (using
the following parameters: -protein -minw 8 -maxw 40 -nmo-
tifs 10 -evt 1e-5 -mod anr -maxsize 14173) and the Gibbs sam-
pler (using the following command-line parameters:
14,16,18,20,22,24,26,28,30 10,10,10,10,10,10,10,10,10 -W
0.8 -w 0.1 -p 45 -j 5 -i 500 -S 20 -C 0.5). In this analysis, the
false positive rate is defined as the rate at which a link is incor-
rectly inferred between two families from different super-
families, and the false negative rate is defined as the rate at
which a link between two families from the same superfamily
Clustering of motifs found in 80 members of the RpiA and RpiB families of ribose 5-phosphate isomerasesFigure 2
Clustering of motifs found in 80 members of the RpiA and RpiB families of ribose 5-phosphate isomerases. The blue box encloses RpiAs, and the red box
encloses RpiBs.
Genome Biology 2008, 9:R128
Genome Biology 2008, Volume 9, Issue 8, Article R128 Hamady et al. R128.8
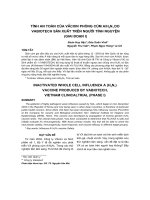
is missed. Using motifs found by MEME, the false positive
rate was 1.3% using an edge threshold of two, and 0.17% using
an edge threshold of three. The corresponding figures for
analyses using motifs found by the Gibbs sampler were 5.2%
and 1.8%, respectively. The false positive rate using an edge
threshold of one was always high (18% and 27% for MEME
and Gibbs, respectively), suggesting that the shared presence
of a single motif is insufficient for the inference of homology
between two families. This result is expected, as a single false-
positive motif occurrence in any member of the set will join
the two components into a single cluster.
The false negative rate in this analysis was essentially zero
(data not shown). No false negatives were found at all except
when an edge threshold of three was used for motifs found by
MEME. In that case, the algorithm failed to find a link
between the deoxy-D-mannose-octulosonate 8-phosphate
phosphatase and P-type ATPase families in the haloacid
dehalogenase superfamily. Thus, the presence of at least two
shared MEME motifs is a strong indicator of shared super-
family membership, whereas absence of at least two shared
MEME motifs is a strong indicator of lack of shared super-
family membership. However, failure to assign all sequences
to a single cluster (for members of the same superfamily) or
to two distinct clusters (for members of different super-
families) is frequent (Figure 4b). The average fraction of
unassigned sequences ranged from 5.2% (Gibbs sampler,
edge threshold of 1, two superfamilies) to 30.4% (MEME,
edge threshold of 3, one superfamily), showing that not all
family members share motifs (at least, as defined by MEME
or the Gibbs sampler), even when homology exists at the pri-
mary sequence level. Thus, the presence or absence of shared
motifs at the whole family level is informative, but the fact
that individual sequences lack motifs shared by the other
sequences in the set does not indicate that they are not
homologous. The error rates were robust to variation in the
degree of divergence between the sequences (average pair-
wise identities between the families ranged from 38.4-
57.9%), the number of sequences in each family (which
ranged from 5-366), and differences between the sample size
in the two families (the fraction of sequences represented by
one of the two families ranged from 0.014-1). No significant
correlations were observed between these variables and false
positive rate, false discovery rate, false negative rate, sensitiv-
ity, or specificity (data not shown).
MotifCluster facilitates identification of conserved and
variable residues in active sites of mechanistically
divergent families
Figure 3c shows that sequences in the haloacid dehalogenase
and β-phosphoglucomutase families can be clustered into a
single connected component by MotifCluster, consistent with
the known evolutionary relationship between these families
[16]. Although the reactions catalyzed by the prototypical
members of these two families are quite different, each reac-
tion involves attack of a nucleophilic Asp residue in the initial
step of the reaction. The reactions differ, though, in the
nature of the atom attacked by the Asp, the mechanism for
stabilization of the leaving group, and the requirement for
Mg
2+
in the β-phosphoglucomutases. Figure 5a shows the
motifs characteristic of the two families; notably, three motifs
are found in most members of both families, suggesting that
these represent regions of the protein responsible for con-
served functions. Within these three motifs, certain positions
stand out as being conserved in both families, or in only one
family (Figure 5b). MotifCluster facilitates analysis of evolu-
tionary relationships among protein families by automati-
cally mapping motifs onto the structures of structurally
characterized members of the set (Figure 6). The blue and
light green motifs contribute to the active site in both pro-
teins. Zooming into the active site structures in PyMol (Figure
7) shows that the nucleophilic Asp residue occupies a compa-
rable position in both structures. Notably, two residues in the
green motif (a Lys and an Asp) are structurally conserved, but
play different roles in the two enzymes. In the β-phosphoglu-
Graph representation of clusters generated from motifs identified in (a) members of the dihydroorotase and (b) β-phosphoglucomutase families, which belong to separate superfamilies, and (c) members of the 2-haloacid dehalogenase (blue) and β-phosphoglucomutase (red) families, which belong to the same superfamilyFigure 3
Graph representation of clusters generated from motifs identified in (a)
members of the dihydroorotase and (b) β-phosphoglucomutase families,
which belong to separate superfamilies, and (c) members of the 2-haloacid
dehalogenase (blue) and β-phosphoglucomutase (red) families, which
belong to the same superfamily. The families can be subdivided further into
additional groups by increasing the edge threshold.
(a)
(b)
(c)
Genome Biology 2008, Volume 9, Issue 8, Article R128 Hamady et al. R128.9
Genome Biology 2008, 9:R128
comutase, Lys145 forms a salt bridge to the phosphate of the
substrate. In the haloacid dehalogenase, the comparable res-
idue (Lys147) forms a salt bridge to the terminal carboxylate
of the haloacid substrate. In the β-phosphoglucomutase,
Asp170 coordinates the active site Mg
++
. The comparable res-
idue in the haloacid dehalogenase (Asp176) forms a hydrogen
bond with Lys147. In addition, an active site Ser forms a
hydrogen bond to the substrate in both cases. Residues in the
other motifs that are conserved only in one of the two families
are identifiable in the active site, as well; these residues con-
tribute to family-specific functions such as stabilization of the
chloride leaving group in the haloacid dehalogenase family.
This type of analysis has traditionally been carried out by
manual mapping of motifs discovered by MEME or the Gibbs
Summary of the performance of MotifCluster using motifs found by MEME and the Gibbs sampler for 741 pairs of families in the gold-standard set of familiesFigure 4
Summary of the performance of MotifCluster using motifs found by MEME and the Gibbs sampler for 741 pairs of families in the gold-standard set of
families. (a) Incorrect inferences of superfamily assignment. (b) Failure to assign sequences to the leading component (for members of the same
superfamily) or to one of the two leading components (for members of two different superfamilies). The numbers 1 and 2 in the legend (for example,
Gibbs 1 and Gibbs 2) refer to the two largest components, which invariably contain most of the sequences from the two distinct families when these
families belong to different superfamilies.
0%
5%
10%
15%
20%
25%
30%
123
u
mber of connecting mo
t
Gibbs
MEME
0%
5%
10%
15%
20%
25%
30%
35%
123
# Connecting Motifs
Gibbs 1
MEME 1
Gibbs 2
MEME 2
Incorrect links
Unassigned sequences
(a) (b)
Number of connection motifs
Number of connection motifs
Analysis of haloacid dehalogenasesFigure 5
Analysis of haloacid dehalogenases. (a) Clustering of motifs in the haloacid dehalogenase and β-phosphoglucomutase families of the haloacid dehalogenase
superfamily. (b) Sequences of the three shared motifs, with highly conserved and mechanistically important residues highlighted by MotifCluster.
(a)
(b)
Genome Biology 2008, 9:R128
Genome Biology 2008, Volume 9, Issue 8, Article R128 Hamady et al. R128.10
sampler onto structures in a separate structure visualization
package. By automating this process, MotifCluster speeds up
the analysis and allows rapid analysis of multiple sets of dif-
ferent composition, which can be important because the
motifs found by MEME and the Gibbs sampler vary some-
what according to the composition of the input set.
The various clustering methods available in
MotifCluster facilitate analysis of extremely distantly
related families
The Trx-fold suprafamily encompasses an extremely diver-
gent set of proteins with a wide range of functions. All mem-
bers of the suprafamily share the canonical Trx-fold
structure, but the ancestral function (reduction of disulfide
bonds using a pair of active site cysteines) has been modified
in some superfamilies. For example, in the peroxiredoxin
family, a cysteine corresponding to the more buried cysteine
in Trxs is involved in reduction of peroxides, but the other
cysteine has been changed to a threonine [7]. In the glutath-
ione transferase superfamily, both cysteines have been lost,
and these enzymes catalyze a completely different reaction:
nucleophilic attack of glutathione upon an electrophilic sub-
strate to form a glutathione conjugate. Analysis of sequence
relationships among such highly divergent proteins is diffi-
cult because the overall pairwise sequence identities fall
within the twilight zone. In such cases, identification of
shared motifs in proteins that share a common structural fold
can provide good evidence for a very distant evolutionary
relationship.
An analysis of the relationship between thioredoxins (Trxs)
and peroxiredoxin (Prxs) was reported in 2004: no signifi-
cant pairwise identity could be demonstrated between
sequences in these two families, but the Shotgun algorithm
[3] identified a family of proteins, the cytochrome maturation
proteins (CMPs), that bridges the Trxs and Prxs [7]. Motifs
found in subsets of these three families were identified by
MEME. The results were clustered manually, a time-consum-
ing and qualitative process. MotifCluster performs a compa-
rable analysis in a few minutes. Here we demonstrate that the
use of different distance metrics produces different clustering
results. Notably, clustering using motifs rather than whole
sequences produces biologically meaningful results even
when standard phylogenetic clustering methods fail due to
the extremely divergent set of proteins in the analysis.
Figure 8a shows that, in the absence of the bridging CMP
sequences, the Trx and Prx families cluster into two compo-
nents, indicating that no evolutionary relationship can be dis-
cerned. (Trxs are circled in blue and Prxs in red.) When motifs
are found using a set of 96 proteins representing Trxs, CMPs
and Prxs [7], MotifCluster clusters the proteins into a single
connected component (Figure 8b) using an edge threshold of
2 and the NW module alignment 1-(actual/max) score, which
considers only the sequences of the motifs. However,
clustering using the phylogenetic tree generated using MUS-
CLE is quite poor (Figure 9). This poor performance is
expected because of the high level of sequence divergence. On
this data set, the other distance metrics give results of inter-
mediate quality, but the motif-based clustering is always bet-
ter than the phylogenetic clustering.
Implications for motif analyses
Motif identification informs functional, mechanistic and evo-
lutionary analyses in several ways. First, the patterns of
motifs observed in subsets of the input set can be used to clus-
ter the proteins into families, a useful tool for prediction of
function for unannotated proteins. Second, motifs indicate
regions of proteins that have been conserved for reasons of
structure and/or function. Changes in a region of a protein
family, either resulting in a different motif or in subtle, fam-
ily-specific changes within a motif, suggest the changes that
have led to emergence of new functions in an ancestral
scaffold.
MotifCluster takes input from motif-finding algorithms such
as MEME or the Gibbs sampler, and the results are therefore
dependent upon the choice of the input set because the char-
acteristics of the input set have a strong effect upon the motifs
that are found. A crucial limitation of existing techniques is
that motif-finding algorithms typically assume that each
sequence is drawn independently from a background distri-
Motifs identified by MEME mapped onto the crystal structures of (a) haloacid dehalogenase [PDB:1QQ7] and (b) β-phosphoglucomutase [PDB:1O03] by MotifClusterFigure 6
Motifs identified by MEME mapped onto the crystal structures of (a)
haloacid dehalogenase [PDB:1QQ7
] and (b) β-phosphoglucomutase
[PDB:1O03
] by MotifCluster.
Active site regions of (a) haloacid dehalogenase and (b) β-phosphoglucomutase, with conserved residues highlighted according to the motif color scheme shown in Figure 6Figure 7
Active site regions of (a) haloacid dehalogenase and (b) β-
phosphoglucomutase, with conserved residues highlighted according to
the motif color scheme shown in Figure 6. Note that the side-chain
coloring was added manually in PyMol.
(a)
(b)
(a)
(b)
Genome Biology 2008, Volume 9, Issue 8, Article R128 Hamady et al. R128.11
Genome Biology 2008, 9:R128
bution, and thus can be biased by the presence of closely
related sequences. We previously addressed this problem
with our software DivergentSet [20], which allows the user to
rapidly select an unbiased sample of divergent sequences
from the starting population. In several sequence families,
our analysis of different divergent sets drawn repeatedly from
each family showed that the motifs found by MEME were
highly dependent on the particular set chosen: the number of
motifs, and the lengths and locations of the motifs, varied
from run to run [20]. Although highly conserved motifs that
Clustering of a divergent set of 96 sequences from the Prx, Trx and CMP familiesFigure 8
Clustering of a divergent set of 96 sequences from the Prx, Trx and CMP families. Prxs are circled in red, Trxs are circled in blue and CMPs are circled in
green. In each case, both the clustering of motifs and the connected components are shown. (a) Clustering of the Prx (top right graph) and Trx (bottom
right graph) families using the NW module alignment 1-(actual/max) score; (b) clustering of the Prx, Trx, and CMP families using the NW module
alignment 1-(actual/max) score. The 34 Trx sequences range from 89-578 residues in length (average 141) and are 48.6% identical on average. The 40 Prx
sequences range from 133-321 residues in length (average 180) and are 43.8% identical on average. The 22 CMP sequences range from 121-403 residues
in length (average 194) and are 44.7% identical on average.
(a)
(b)
Genome Biology 2008, 9:R128
Genome Biology 2008, Volume 9, Issue 8, Article R128 Hamady et al. R128.12
are critical for function are reliably recovered, the robustness
of any motif analysis is enhanced when multiple analyses can
be carried out using divergent sets generated randomly from
a larger set of homologous sequences.
Analysis of the importance of sequence motifs is greatly
enhanced when motifs can be mapped onto the structure of
representative proteins. Such mapping allows visualization of
motifs that are found in the core of the protein and may be
responsible for maintaining the overall structural fold, motifs
that are on the surface and may be involved in interactions
with ligands or other proteins, and motifs that are found in
clefts or crevices that may harbor active sites. The automation
of the clustering of sequences and the mapping of motifs onto
structures substantially reduces the time required to carry out
such analyses, and will provide many new insights into the
relationships among highly divergent protein families.
Abbreviations
CMP: cytochrome maturation protein; IDs: identifiers; LCS:
Longest common substring; MEME: Multiple EM for motif
elicitation; MUSCLE: Multiple sequence comparison by log-
expectation; NW: Needleman-Wunsch; PDB: Protein Data
Bank; Prx: peroxiredoxin; Trx: thioredoxin; UPGMA:
Unweighted pair group method with arithmetic mean.
Authors' contributions
MH and JW developed the software. SDC and RK directed the
research. RK and MH wrote the manuscript, with most fig-
ures provided by JW.
Acknowledgements
This work was funded by a grant from the Air Force Office of Scientific
Research (FA9550-06-0014) to SC and RK. MH was supported by the
National Institutes of Health/University of Colorado at Boulder Molecular
Biophysics Training Program (T32GM065103), NSF EAPSI fellowship
OISE0812861 (MH), and by a gift from the Butcher Foundation.
References
1. Sadreyev R, Grishin N: COMPASS: a tool for comparison of
multiple protein alignments with assessment of statistical
significance. J Mol Biol 2003, 326:317-336.
2. Altschul SF, Madden TL, Schaffer AA, Zhang J, Zhang Z, Miller W, Lip-
man DJ: Gapped BLAST and PSI-BLAST: a new generation of
protein database search programs. Nucleic Acids Res 1997,
25:3389-3402.
3. Pegg SC, Babbitt PC: Shotgun: getting more from sequence
similarity searches. Bioinformatics 1999, 15:729-740.
4. Gerlt JA, Babbitt PC, Rayment I: Divergent evolution in the eno-
lase superfamily: the interplay of mechanism and specificity.
Arch Biochem Biophys 2005, 433:59-70.
5. Bailey TL, Williams N, Misleh C, Li WW: MEME: discovering and
analyzing DNA and protein sequence motifs. Nucleic Acids Res
2006, 34:W369-373.
6. Neuwald AF, Liu JS, Lawrence CE: Gibbs motif sampling: detec-
tion of bacterial outer membrane protein repeats. Protein Sci
1995, 4:1618-1632.
7. Copley SD, Novak WR, Babbitt PC: Divergence of function in the
Phylogenetic tree of 96 sequences from the Prx, Trx and CMP familiesFigure 9
Phylogenetic tree of 96 sequences from the Prx, Trx and CMP families. This figure shows clustering of the Prx, Trx, and Cmp families using the
phylogenetic tree generated by MUSCLE. See legend to Figure 8 for details of the sequence families and display.
Genome Biology 2008, Volume 9, Issue 8, Article R128 Hamady et al. R128.13
Genome Biology 2008, 9:R128
thioredoxin fold suprafamily: evidence for evolution of per-
oxiredoxins from a thioredoxin-like ancestor. Biochemistry
2004, 43:13981-13995.
8. Vogt G, Etzold T, Argos P: An assessment of amino acid
exchange matrices in aligning protein sequences: the twi-
light zone revisited. J Mol Biol 1995, 249:816-831.
9. PyMOL Home Page [ />10. Needleman SB, Wunsch CD: A general method applicable to
the search for similarities in the amino acid sequence of two
proteins. J Mol Biol 1970, 48:443-453.
11. Sokal RR, Sneath PHA: Numerical Taxonomy: the Principles and Practice
of Numerical Classification San Franscisco: WH Freeman & Co; 1973.
12. Edgar RC: MUSCLE: multiple sequence alignment with high
accuracy and high throughput. Nucleic Acids Res 2004,
32:1792-1797.
13. NetworkX [ />14. libstree - A generic suffix tree library [ />christian/libstree/]
15. Knight R, Maxwell P, Birmingham A, Carnes J, Caporaso JG, Easton
BC, Eaton M, Hamady M, Lindsay H, Liu Z, Lozupone C, McDonald D,
Robeson M, Sammut R, Smit S, Wakefield MJ, Widmann J, Wikman S,
Wilson S, Ying H, Huttley GA: PyCogent: a toolkit for making
sense from sequence. Genome Biol 2007, 8:R171.
16. Brown SD, Gerlt JA, Seffernick JL, Babbitt PC: A gold standard set
of mechanistically diverse enzyme superfamilies. Genome Biol
2006, 7:R8.
17. Munro AW, Taylor P, Walkinshaw MD: Structures of redox
enzymes. Curr Opin Biotechnol 2000, 11:369-376.
18. Rangarajan ES, Sivaraman J, Matte A, Cygler M: Crystal structure of
D-ribose-5-phosphate isomerase (RpiA) from Escherichia
coli. Proteins 2002,
48:737-740.
19. Zhang RG, Andersson CE, Skarina T, Evdokimova E, Edwards AM,
Joachimiak A, Savchenko A, Mowbray SL: The 2.2 A resolution
structure of RpiB/AlsB from Escherichia coli illustrates a new
approach to the ribose-5-phosphate isomerase reaction. J
Mol Biol 2003, 332:1083-1094.
20. Widmann J, Hamady M, Knight R: DivergentSet, a tool for picking
non-redundant sequences from large sequence collections.
Mol Cell Proteomics 2006, 5:1520-1532.
21. Bailey TL, Noble WS: Searching for statistically significant reg-
ulatory modules. Bioinformatics 2003, 19(Suppl 2):ii16-25.
22. Frith MC, Li MC, Weng Z: Cluster-Buster: Finding dense clus-
ters of motifs in DNA sequences. Nucleic Acids Res 2003,
31:3666-3668.
23. Papatsenko D: ClusterDraw web server: a tool to identify and
visualize clusters of binding motifs for transcription factors.
Bioinformatics 2007, 23:1032-1034.
24. Frith MC, Spouge JL, Hansen U, Weng Z: Statistical significance of
clusters of motifs represented by position specific scoring
matrices in nucleotide sequences. Nucleic Acids Res 2002,
30:3214-3224.
25. Bellora N, Farre D, Mar Alba M: PEAKS: identification of regula-
tory motifs by their position in DNA sequences. Bioinformatics
2007, 23:243-244.
26. Grskovic M, Chaivorapol C, Gaspar-Maia A, Li H, Ramalho-Santos M:
Systematic identification of cis-regulatory sequences active
in mouse and human embryonic stem cells. PLoS Genet 2007,
3:e145.
27. Sharan R, Ovcharenko I, Ben-Hur A, Karp RM: CREME: a frame-
work for identifying cis-regulatory modules in human-mouse
conserved segments. Bioinformatics 2003, 19(Suppl 1):i283-291.
28. Jensen ST, Shen L, Liu JS: Combining phylogenetic motif discov-
ery and motif clustering to predict co-regulated genes. Bioin-
formatics 2005, 21:3832-3839.
29. Thijs G, Moreau Y, De Smet F, Mathys J, Lescot M, Rombauts S, Rouze
P, De Moor B, Marchal K: INCLUSive: integrated clustering,
upstream sequence retrieval and motif sampling. Bioinformat-
ics 2002, 18:331-332.
30. Ben-Hur A, Brutlag D: Remote homology detection: a motif
based approach. Bioinformatics 2003, 19(Suppl 1):i26-33.
31. Lingner T, Meinicke P: Word correlation matrices for protein
sequence analysis and remote homology detection. BMC
Bioinformatics 2008, 9:259.
32. Lingner T, Meinicke P: Remote homology detection based on
oligomer distances. Bioinformatics 2006, 22:2224-2231.
33. Bhadra R, Sandhya S, Abhinandan KR, Chakrabarti S, Sowdhamini R,
Srinivasan N: Cascade PSI-BLAST web server: a remote
homology search tool for relating protein domains. Nucleic
Acids Res 2006, 34:W143-146.
34. Pipenbacher P, Schliep A, Schneckener S, Schonhuth A, Schomburg D,
Schrader R: ProClust: improved clustering of protein
sequences with an extended graph-based approach. Bioinfor-
matics 2002, 18(Suppl 2):S182-191.
35. Li W, Godzik A: Cd-hit: a fast program for clustering and com-
paring large sets of protein or nucleotide sequences. Bioinfor-
matics 2006, 22:1658-1659.
36. Mahony S, Benos PV: STAMP: a web tool for exploring DNA-
binding motif similarities. Nucleic Acids Res 2007, 35:W253-258.
37. Gordon DB, Nekludova L, McCallum S, Fraenkel E: TAMO: a flexi-
ble, object-oriented framework for analyzing transcriptional
regulation using DNA-sequence motifs. Bioinformatics 2005,
21:3164-3165.
38. Mahony S, Golden A, Smith TJ, Benos PV: Improved detection of
DNA motifs using a self-organized clustering of familial bind-
ing profiles. Bioinformatics 2005, 21(Suppl 1):i283-291.
39. Ausiello G, Gherardini PF, Marcatili P, Tramontano A, Via A, Helmer-
Citterich M: FunClust: a web server for the identification of
structural motifs in a set of non-homologous protein
structures.
BMC Bioinformatics 2008, 9(Suppl 2):S2.