Báo cáo y học: "Changes in protein expression during honey bee larval development" doc
Bạn đang xem bản rút gọn của tài liệu. Xem và tải ngay bản đầy đủ của tài liệu tại đây (503.06 KB, 14 trang )
Genome Biology 2008, 9:R156
Open Access
2008Chan and FosterVolume 9, Issue 10, Article R156
Research
Changes in protein expression during honey bee larval development
Queenie WT Chan and Leonard J Foster
Address: Centre for High-Throughput Biology, Department of Biochemistry and Molecular Biology, University of British Columbia, Vancouver,
BC, V6T 1Z4, Canada.
Correspondence: Queenie WT Chan. Email:
© 2008 Chan and Foster; licensee BioMed Central Ltd.
This is an open access article distributed under the terms of the Creative Commons Attribution License ( which
permits unrestricted use, distribution, and reproduction in any medium, provided the original work is properly cited.
Abstract
Background: The honey bee (Apis mellifera), besides its role in pollination and honey production,
serves as a model for studying the biochemistry of development, metabolism, and immunity in a
social organism. Here we use mass spectrometry-based quantitative proteomics to quantify nearly
800 proteins during the 5- to 6-day larval developmental stage, tracking their expression profiles.
Results: We report that honey bee larval growth is marked by an age-correlated increase of
protein transporters and receptors, as well as protein nutrient stores, while opposite trends in
protein translation activity and turnover were observed. Levels of the immunity factors
prophenoloxidase and apismin are positively correlated with development, while others
surprisingly were not significantly age-regulated, suggesting a molecular explanation for why bees
are susceptible to major age-associated bee bacterial infections such as American Foulbrood or
fungal diseases such as chalkbrood. Previously unreported findings include the reduction of
antioxidant and G proteins in aging larvae.
Conclusion: These data have allowed us to integrate disparate findings in previous studies to build
a model of metabolism and maturity of the immune system during larval development. This publicly
accessible resource for protein expression trends will help generate new hypotheses in the
increasingly important field of honey bee research.
Background
Honey bees (Apis mellifera) have been a subject of scientific
research for more than 2,300 years [1], yet it is only in the
past two decades that bee research has expanded beyond
behavioral or social traits to a molecular level. With the pub-
lication of the honey bee genome in 2006 [2], the basic infor-
mation to enable proteome-level analyses of this organism is
now available. Since then, various groups have published pro-
teomic analyses of whole bees or individual organs/tissues [3-
6] but these studies have focused on adult animals. Larval
development in honey bees is largely unexplored, despite its
significance in caste determination [7] and in the pathogene-
sis of certain economically significant honey bee diseases,
such as American and European Foulbrood.
The larval development of the honey bee, which follows a 3-
day period as an egg, is 5-6 days in duration and precedes the
pupal (metamorphosis) and adult stages. Apart from an
astounding increase in size, larval growth is relatively unre-
markable at the macroscopic level [8]. However, female bees
differentiate into workers or queens (caste differentiation) in
response to diet very early in larval development and the
Published: 29 October 2008
Genome Biology 2008, 9:R156 (doi:10.1186/gb-2008-9-10-r156)
Received: 7 July 2008
Revised: 23 September 2008
Accepted: 29 October 2008
The electronic version of this article is the complete one and can be
found online at /> Genome Biology 2008, Volume 9, Issue 10, Article R156 Chan and Foster R156.2
Genome Biology 2008, 9:R156
acquisition of immunity to certain diseases during this 5- to
6-day period suggests complex molecular biological changes
are taking place.
Insect development has been studied mainly using the fruit
fly as the model system. Drosophila embryogenesis has his-
torically attracted far more attention than any other growth
stage, due to its value for studying the mechanism of spatial
regulation of transcription and translation. With the excep-
tion of the economically important silkworm Bombyx mori,
research on larval development has been slow. For honey
bees, the lack of published works is evident: the article enti-
tled 'Morphology of the Honeybee Larva' published by Nelson
in 1924 [8] still remains today as one of the most cited
resources on this subject. Here we have used mass spectrom-
etry-based proteomics to profile the changing abundance of
individual proteins over the first 5 days of the worker larval
stage and used these data, with the help of sequence-based
function prediction, to build a framework for the develop-
mental processes going on in the maturing larva.
Results
In order to obtain suitably aged larval samples for proteomic
profiling of the first 5 days of development, for each experi-
ment we isolated an open-mated, laying queen on an empty
frame of brood comb for a short period of time to allow her to
lay several hundred eggs (see Materials and methods). The
frame and queen were then separated by a queen excluder
and workers were allowed to tend the brood. Starting on the
day the eggs hatched (day 1, roughly corresponding to first
instar) larvae were collected every day for 5 days. Hemol-
ymph was separated from the remaining tissues (termed
'solid tissues' henceforth) prior to protein extraction (see
Materials and methods) and equal amounts of protein from
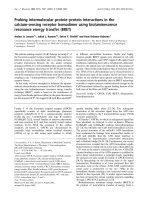
each age were resolved on a reducing SDS polyacrylamide gel
(Figure 1). The protein composition of solid tissues was
grossly consistent across all ages, but varied drastically in the
hemolymph. Hemolymph from 1- to 3-day old larvae show a
staining pattern distinct from that of 4- to 5-day old larvae.
These differences may be partially attributed to slight varia-
tions in collection methods for young and old larvae but it is
more likely that these represent real biological changes occur-
ring as the late larvae prepare for pupation. Most notably, a
70 kDa hexamerin band emerges from day 3 and beyond and
accounts for the majority of the protein in the hemolymph, an
observation that has been made numerous times by other
researchers [9-11]. A second observation that argues against
these dramatic changes around day 3 being simply an artifact
of sample collection is the absence of the major protein bands
in the hemolymph gel in the solid tissue gel, and vice versa.
As a means for identifying and quantifying the expression
profiles of proteins in developing larvae, we used a quantita-
tive proteomics approach employing stable isotope labeling
and liquid chromatography-tandem mass spectrometry. The
labeling method we used employs deuterated and hydrogen-
ated forms of formaldehyde to reductively dimethylate pri-
mary amines in peptides, but since there are only two labeling
conditions possible in this schema, we compared the expres-
sion of protein from days 1, 2, 4 and 5 larvae versus that from
day 3 in order to generate an expression profile spanning the
whole development period. Three biological replicates of each
tissue type were analyzed, which resulted in the detection of
12,421 non-redundant peptides (supplementary Table 10 in
Additional data file 1). After applying the cutoff criteria (see
Materials and methods), 1,333 proteins were identified (sup-
plementary Table 1 in Additional data file 1) with an estimated
false discovery rate of 0.97% (see Materials and methods),
thus providing experimental evidence for 12.7% of the 10,517
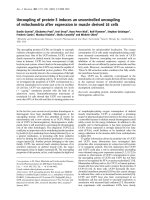
genes in the predicted honey bee gene set. In general, the pep-
tide ratios showed no labeling bias and were approximately
normally distributed (Figure 1). Among these, 790 were
quantified in 2 or more days by averaging the intensity ratio
from at least 2 of the 3 replicates (if more than 5 peptides were
quantified, the top 5 most intense peptides were selected):
378 (48%) of them matched this criterion in both the tissue
and hemolymph, 309 (39%) were specific to solid tissue and
103 (13%) were specific to hemolymph. An example of using
peptide ratios to derive relative protein expression profiles is
shown in Table 1 for the odorant binding protein 14
[GenBank:94158822
].
A major strength of this method is the ability to track the
changing abundances of hundreds of proteins during devel-
opment. Those whose levels can be traced for at least 4 out of
5 days in either the tissue or hemolymph were considered to
have an informative profile, a total of 522 proteins. Approxi-
mately equal numbers of tissue proteins showed an expres-
sion trend either positively or negatively correlated with age,
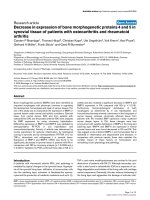
The peptide ratios within an experiment are roughly normally distributed and show no labeling biasFigure 1
The peptide ratios within an experiment are roughly normally distributed
and show no labeling bias. Using replicate number 1 of day 1 versus day 3
solid tissue quantification data as an example, the peptide ratios are
displayed as a histogram, sorted into natural-log unit bins (bin size = 1).
0
200
400
600
800
1000
1200
1400
Less th an -3.501
-3.500 to -2.5 01
-2.500 to -1.5 01
-1.500 to -0.5 0
1
-0.500 to 0.499
0.500 to 1.499
1.500 to 2.499
2.500 to 3.499
Grea ter than 3.500
Genome Biology 2008, Volume 9, Issue 10, Article R156 Chan and Foster R156.3
Genome Biology 2008, 9:R156
but the latter was more common for hemolymph proteins, as
might be expected from the high dynamic range of hemol-
ymph as shown in Figure 2. It is crucial to note that the
decreasing trend likely does not reflect an absolute reduction
in expression levels of most proteins, but is rather a phenom-
enon of analyzing equal amounts of protein between two sam-
ples with a very large difference in absolute protein amounts
caused primarily by drastic increases in secreted hexamerins.
Consequently, lower abundance proteins become harder to
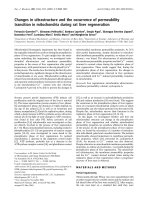
detect in this background. Although the protein concentra-
tion in hemolymph changes only slightly beyond 1 day after
hatching, the total volume, and thus absolute protein content,
increases exponentially with age (Figure 3).
There is no direct functional information available for more
than 99% of honey bee proteins, so to derive some functional
insight from the data acquired here we used BLAST2GO [12]
to systematically predict function based on sequence similar-
ity (supplementary Table 2 in Additional data file 1). After
grouping specific molecular function ontologies into broader
categories until they converged under one term (supplemen-
tary Table 3 in Additional data file 1), the third-level terms
Table 1
An example of using peptide ratios used to derive protein relative expression results (odorant binding protein 14 [GenBank:94158822])
Peptide
SampleLarval ages comparedReplicate (1, 2, or 3)12345Ln (peptide average)Ln (protein average)
H 1, 3 1 -1.26 -1.41 -1.66 -1.82 -2.25 -1.68 -3.01
H 2 -3.29 -3.39 -3.55 -3.68 -3.74 -3.53
H 3 -3.76 -3.82 -3.82 -3.82 -3.82 -3.81
H 2, 3 1 -0.68 -0.93 -1.28 -1.32 -1.77 -1.20 -1.35
H 2 -0.85 -0.97 -1.06 -1.13 -1.62 -1.12
H 3 -1.57 -1.59 -1.69 -2.11 NA -1.74
H 4, 3 1 3.91 3.91 3.91 3.91 NA 3.91 2.22
H 2 -0.10 0.53 0.91 1.94 3.10 1.28
H 3 0.67 1.56 1.60 1.69 1.84 1.47
H 5, 3 1 3.91 3.91 3.91 3.91 3.91 3.91 3.09
H 2 2.16 2.32 2.50 3.04 3.04 2.61
H 3 2.05 2.55 2.57 2.78 3.79 2.75
T 1, 3 1 -1.29 -1.37 -1.57 -1.80 -1.80 -1.57 -0.53
T 2 -1.68 -2.16 -2.16 NA NA -2.00
T 3 1.47 1.83 2.59 NA NA 1.96
T 2, 3 1 -0.55 -0.58 -0.78 -0.91 -0.93 -0.75 -0.72
T 2 -0.34 -0.42 -0.55 -1.04 -1.42 -0.75
T 3 -0.46 -0.66 -0.86 NA NA -0.66
T 4, 3 1 -0.39 -0.40 -0.69 -0.70 -0.76 -0.59 -0.37
T 2 -0.06 0.24 0.38 0.70 0.81 0.41
T 3 -0.65 -0.95 -1.02 -1.07 NA -0.92
T 5, 3 1 -0.02 -0.05 -0.27 -0.31 -0.40 -0.21 0.76
T 2 0.37 0.67 0.90 1.47 NA 0.85
T 3 0.80 1.53 1.67 2.04 2.08 1.62
Both the honey bee larval hemolymph (H) and tissue (T) samples were collected daily for 5 days post-hatching, and peptides from days 1, 2, 4, and 5
were isotopically labeled and mixed at 1:1 (by protein amount) with day 3 peptides, which were labeled differentially from the other days. Relative
peptide intensities were recorded (limited at 50-fold or 3.91 in natural log (Ln)) and proteins with a minimum of 2 quantified peptides were natural
log-transformed and averaged; for proteins with greater than 5 peptides, the top 5 most intense ones were selected for averaging. In samples where
there were less than 5 peptides, their absence is indicated by NA (not available).
Genome Biology 2008, Volume 9, Issue 10, Article R156 Chan and Foster R156.4
Genome Biology 2008, 9:R156
were analyzed in detail. To find whether a given function term
was developmentally regulated, an average expression profile
was generated using data from proteins belonging under each
term and tested for significance at the p < 0.05 level (see
Materials and methods). The slope between day 1 and day 5
was calculated to approximate the directionality and strength
of temporal correlation. In the 34 terms considered, 11 of
them had activity profiles that satisfied the significance crite-
ria in at least one of either the solid tissue or hemolymph
expression profiles (Table 2; details in supplementary Table 4
in Additional data file 1). Gene Ontology (GO) terms 'sub-
strate-specific transporter activity' [GO:0022892] and 'trans-
membrane transporter activity' [GO:0022857], both of which
were tissue-specific activities, were very mildly positively cor-
related with larval age. The majority were negatively corre-
lated with age, with the most statistically significant being
'structural constituent of ribosome' [GO:0003735] and
'nucleic acid binding' [GO:0003676]. Others showing a simi-
lar trend include 'enzyme inhibitor activity' [GO:0004857],
'helicase activity' [GO:0004386], and 'nucleotide binding'
[GO:0000166]. Terms that did not show regulation in either
the tissue or hemolymph tended to be ones with non-specific
participation in different pathways, such as 'transferase activ-
ity' [GO:0016740], 'kinase regulator activity' [GO:0019207]
and 'cofactor binding' [GO:00048037].
With the current lack of a thoroughly curated protein function
database for the honey bee, we manually assigned functional
categories by employing a variety of available bioinformatic
tools (see Materials and methods, and supplementary Table 5
in Additional data file 1). This is necessary because certain
major classes of honey bee proteins, such as hexamerins and
odorant binding proteins, do not have high enough homology
to proteins in other better annotated organisms and would
thus be ignored. Furthermore, most proteins were assigned to
multiple terms, or two very similar proteins were assigned to
different but similar terms ('nucleic acid binding'
[GO:0003676], and 'translation factor activity, nucleic acid
binding' [GO:0008135]), which greatly complicates down-
stream hierarchical clustering and enrichment analysis.
Groups that showed a significant temporal regulation (crite-
ria nearly identical to the analysis of level 3 molecular func-
tion GO terms) are shown in Table 3 (details in
supplementary Table 6 in Additional data file 1). A common
protein expression pattern within a group was frequently
observed. Ribosomal protein levels in the tissue were consist-
ently lowest at day 2 and day 5, but overall decreased in rela-
tive concentration with age (p < 1e-16). Proteasome subunits
and protein-folding chaperones exhibited the same overall
trend (p < 1e-9 and p < 0.005, respectively). Energy storage
proteins, including apolipoproteins and hexamerins,
increased with age throughout the body but the trend was
more dramatic in the hemolymph (p < 0.005). There were no
signs of temporal regulation of enzymes for fatty acid synthe-
sis, beta oxidation, and carbohydrate metabolism. However,
several groups of energy producing proteins showed varying
degrees of positive correlation with time: tricarboxylic acid
cycle proteins (p < 0.05), ATP synthase subunits (p <
0.0005), and electron transport chain enzymes (p <
0.00005). Surprisingly, we observed a decreased expression
of antioxidant proteins, members of the Ras GTPase super-
family, and ubiquitylation enzymes in the solid tissues as
PAGE of honey bee larvae (a) hemolymph and (b) solid tissueFigure 2
PAGE of honey bee larvae (a) hemolymph and (b) solid tissue. Age is
shown in days post-hatching. Molecular weight markers are shown on the
left.
188
62
49
38
28
18
14
6
3
1 2 3 4 5 1 2 3 4 5
(a) (b)
188
62
49
38
28
18
14
6
3
Larval ageLarval age
Developmental changes of larval hemolymphFigure 3
Developmental changes of larval hemolymph. The left axis denotes the
volume of hemolymph per larva (diamonds; μl) or hemolymph protein
concentration (squares; μg/μl), while the right axis describes the mass of
total protein per larva (triangles; μg). Measurements were made by
pooling 5-120 larva (n = 3 separate pools) depending on age (x-axis, in
days) and size. (Error bars represent 2 standard deviations.)
0
5
10
15
20
25
30
35
40
45
0123456
0
100
200
300
400
500
600
Genome Biology 2008, Volume 9, Issue 10, Article R156 Chan and Foster R156.5
Genome Biology 2008, 9:R156
development progressed (p < 0.05, p < 0.01, and p < 0.05,
respectively). Many typically intracellular proteins, such as
ribosomal proteins and proteasome subunits, were found in
hemolymph as we have described previously [3] and as others
have reported in other insects [13,14].
We used hierarchical clustering to further analyze the 522
proteins that were profiled in either or both the solid tissue
(Figure 4a) and hemolymph (Figure 4b), followed by enrich-
ment analysis according to manually assigned groupings.
Clusters that satisfied the criteria (see Materials and meth-
ods) for significant enrichment are shown in Table 4 (com-
plete dataset shown in supplementary Tables 7 and 8 in
Additional data file 1 for tissue and hemolymph, respectively).
Only a few functional classes of proteins were enriched in the
same node, since expression profiles for some proteins
exhibit biological variability that causes apparent inconsist-
ency with the timecourse. Transcription and chromatin-asso-
ciated proteins as well tRNA synthetases - clearly related by
their tasks - shared node 376 (correlation 0.94) with pentose
phosphate pathway and ubiquitylation enzymes. Energy stor-
age and beta-oxidation proteins were both concentrated in
node 434 (correlation 0.86, solid tissue). Protein turnover
machinery, including ribosomes, protein folding, and protea-
some, were all enriched in node 200 (correlation 0.84, hemo-
lymph). Many of these clusters are also protein families
already noted to show significant temporal regulation, such
as energy storage proteins, ATP synthases, antioxidant pro-
teins, and ubiquitylation enzymes. This indirectly suggests
that suitable assignments were made during manual annota-
tion and categorization, since their regulation patterns were
grouped using independent methods.
Automated and semi-automated functional annotation and
categorization effectively highlighted expression trends in
large classes of proteins. With this approach, however, classes
with only a few members or those where particular proteins
have highly specialized function tended to fall below the sig-
nificance threshold unless they were considered individually.
In solid tissues, the levels of 86 proteins changed significantly
(p < 0.05) over the tested period, accounting for 13% of all the
quantifiable proteins in solid tissues. For example, levels of
neuropeptide Y receptor increased 46-fold from day 3 to day
5. In the hemolymph, 66 of 481 (14%) quantified proteins
changed significantly during the larval stage (p < 0.05). Most
of these are intracellular proteins, yet the regulation of truly
secreted proteins is frequently far more dramatic. An imagi-
nal disc growth factor [GenBank:66514614
] increased more
than 13-fold from day 1 to day 5 (Figure 5a). Odorant binding
protein 14 [GenBank:94158822
] levels changed in a similar
fashion, with the former displaying a 40-fold change over 5
days (Figure 5b). Antimicrobial peptide apismin [Gen-
Bank:58585112
] (Figure 5c) and melanization enzyme proph-
enoloxidase [GenBank:58585196
] expression were also
positively correlated with age.
To our knowledge this is the first proteome-level description
of honey bee larval development, so to gain additional insight,
we compared our data with a previously reported develop-
mental study of the fruit fly. While Drosophila and Apis are
Table 2
Expression trends of proteins categorized under Gene Ontology terms
Organ GO ID number GO term Proteins considered t-Test of slope between day 1 and day 5 Slope
H GO:0004857 Enzyme inhibitor activity 6 1.9E-02 -0.19
T GO:0004857 Enzyme inhibitor activity 6 0.007 -0.41
T GO:0004386 Helicase activity 4 0.016 -0.37
T GO:0016787 Hydrolase activity 80 0.002 -0.10
H GO:0003676 Nucleic acid binding 18 7.2E-05 -0.24
T GO:0003676 Nucleic acid binding 38 7.8E-09 -0.33
H GO:0000166 Nucleotide binding 36 4.8E-03 -0.09
T GO:0000166 Nucleotide binding 72 0.022 -0.08
H GO:0016491 Oxidoreductase activity 19 1.8E-02 0.18
H GO:0004871 Signal transducer activity 3 4.7E-02 -0.22
H GO:0003735 Structural constituent of ribosome 18 1.5E-08 -0.41
T GO:0003735 Structural constituent of ribosome 35 8.4E-16 -0.34
T GO:0022892 Substrate-specific transporter activity 34 0.035 0.11
T GO:0008135 Translation factor activity, nucleic acid binding 10 0.037 -0.24
H GO:0022857 Transmembrane transporter activity 4 3.9E-02 -0.11
T GO:0022857 Transmembrane transporter activity 27 0.010 0.12
Proteins were categorized under third-level molecular function terms and were evaluated as a group to assess whether their expression trends were
age-regulated by performing paired t-tests comparing values from day 1 and day 5 of larval development, reporting the average slope between these
two days if p < 0.05 in either the solid tissue (T) or hemolymph (H). The total number of proteins belonging under a particular GO term considered
in the calculation is listed under 'Proteins considered'.
Genome Biology 2008, Volume 9, Issue 10, Article R156 Chan and Foster R156.6
Genome Biology 2008, 9:R156
separated by 300 million years of evolution [2], Drosophila is
nonetheless the closest highly studied phylogenetic neighbor
of the bee. A whole body transcriptome study of the Dro-
sophila melanogaster life cycle was published in 2002 [15],
which included a list of genes that were significantly regulated
during the larval period. After finding the protein homologs
common to our study and the fruit fly larval dataset (34 in
total), we calculated the slope of linear regression of expres-
sion trends for both organisms (the slope of the honey bee tis-
sue and hemolymph profiles were averaged when needed; see
Materials and methods). Slope values that have opposite
signs or an absolute difference in slope of greater than 0.75
were considered dissimilar, amounting to 38% (13 of 34) of
the proteins considered (Table 5; complete dataset with
BLAST homolog search results in supplementary Table 9 in
Additional data file 1). The most extreme slope reported for
both organisms is for the hexamerin 70b protein (1.5 for bees
and 1.6 for flies).
Discussion
The data presented here, at the level of the whole proteome,
documents the dramatic changes occurring in developing
honey bee larvae. The most striking, by far, is the 1,500-fold
increase in weight over just 6 days [16]. In our proteomic
analysis of the solid tissue, the most abundant organs are best
represented, namely the fat body (accounts for 65% of the
mass [17]), followed by the midgut and larval tubules. The
hemolymph fraction reflects the secretory activities of all
these tissues and also the molecules associated with intercel-
lular communication and regulation. The presence of intrac-
ellular proteins suggest that hemolymph plays a major role in
clearing apoptotic cells, in line with observations of the equiv-
alent connective tissue in mammals (that is, blood) [18]. No
dissection of specific larval organs was performed because
many do not develop until the late stages, making direct com-
parisons of organ development by quantitative proteomics
impossible.
We have found both automated (BLAST2GO) and semi-auto-
mated annotation (manual selection of descriptions provided
by automated tools and manual categorization) to be very val-
uable for maximizing available information on an organism
with otherwise very little functional annotation. While auto-
mated ontological methods were reliable and bias-free, out-
puts might be too generic (for example, 'ion binding'
Table 3
Expression trends of manually annotated and categorized proteins
Organ Class Proteins considered t-Test of slope between day 1 and day 5 Slope
T Adaptor 2 0.002 -0.43
T Aldo-keto reductase superfamily 3 0.041 -0.22
T Antioxidant 15 0.017 -0.20
T ATP synthase 10 1.4E-04 0.21
H Carbohydrate metabolism 15 0.003 0.20
T Cuticle 7 0.036 0.19
T Electron transport chain 14 1.1E-05 0.22
H Energy storage 4 0.004 1.20
T Energy storage 5 0.028 0.56
T Kinases or phosphatases 2 0.044 0.24
H Pentose phosphate pathway 4 0.001 0.06
H Peptidase 15 0.045 0.14
H Proteasome 9 1.4E-04 -0.23
T Proteasome 18 8.6E-10 -0.32
T Protein folding 34 0.001 -0.17
T Ras superfamily 10 0.009 -0.27
T Ribonucleoprotein 4 0.024 -0.43
H Ribosome 20 2.1E-09 -0.40
T Ribosome 38 4.7E-17 -0.34
T Tricarboxylic acid cycle 21 0.033 0.10
T Translation 14 0.015 -0.25
T Ubiquitination 3 0.021 -0.35
H Uncategorized 21 0.029 0.18
Proteins were categorized manually by function and evaluated as a group to assess whether their expression trends were age-regulated by
performing paired t-tests to compare values from day 1 and day 5. Significant (p < 0.05) groups in either the solid tissue (T) or hemolymph (H) are
shown.
Genome Biology 2008, Volume 9, Issue 10, Article R156 Chan and Foster R156.7
Genome Biology 2008, 9:R156
[GO:0043167]), or failing to accurately represent several very
important protein families of the honey bee (for example,
hexamerins and odorant binding proteins), highlighting the
need for manual intervention. Cluster analysis is an indispen-
sable tool for spotting expression trends, but given that the
software for rigorous statistical enrichment analysis is
designed specifically for popular model organisms such as
mouse, worm, and yeast, the descriptive statistical approach
used here was nevertheless able to provide credible insights
about larval developmental biology or led to conclusions con-
firmed by other information.
The major behaviour during the larval stage is feeding as it
prepares itself for the subsequent pupal stage when no feed-
ing occurs. Based on various data acquired over the past cen-
tury, it has been proposed that the larval fat body undergoes
two phases, beginning with a high rate of protein synthesis
and poor uptake of hemolymph substances, followed by a
phase of low cellular synthesis and improved uptake and stor-
age of hemolymph proteins [19]. Our data now allows us to
clarify this model and provide molecular-level detail of these
changes. One of the most remarkable events in a growing
larva is the substantial synthesis of hexamerins and lipopro-
teins in the fat body, followed by their appearance in the
Table 4
Enrichment analysis of protein classes following hierarchical clustering
Node number Correlation Proteins in this node Protein class Class total Percent class enrichment
Solid tissue
265 0.98 5 Helicase 3 67
277 0.98 8 Hormone synthesis 4 50
376 0.94 79 Transcription 3 100
376 0.94 79 Chromatin-associated protein 3 67
376 0.94 79 tRNA synthetase 3 67
376 0.94 79 Pentose phosphate pathway 4 50
376 0.94 79 Ubiquitylation 4 50
377 0.94 5 Food 6 50
411 0.90 108 Aldo-keto reductase superfamily 3 67
419 0.89 137 Proteasome 24 67
419 0.89 137 Antioxidant 16 50
419 0.89 137 Protein receptor 4 50
421 0.89 29 ATP synthase 10 60
427 0.88 34 Small molecule receptor 4 50
434 0.86 51 Energy storage 5 80
434 0.86 51 Beta-oxidation 8 50
438 0.83 7 Cuticle 7 57
439 0.83 146 Ras superfamily 10 50
Hemolymph
128 0.97 35 Translation 7 57
150 0.96 6 Short-chain dehydrogenase family 4 50
180 0.93 21 Small molecule receptor 4 50
183 0.92 23 Food 8 63
183 0.92 23 Glycolipid metabolism 3 67
185 0.92 9 Ubiquitylation 4 50
190 0.89 63 Amino acid metabolism 8 50
197 0.86 29 Energy storage 4 100
200 0.84 81 Proteasome 10 90
200 0.84 81 Protein folding 20 60
200 0.84 81 Ribosome 31 81
203 0.82 21 Tricarboxylic acid cycle 4 75
Proteins that were manually categorized by function were subjected to average-linkage clustering (Figure 3). Separate analyses were done for solid
tissue and hemolymph. Only proteins that were quantified for at least 4 out of 5 days and protein classes that had at least 5 members were
considered for enrichment analysis. Classes with at least 50% enrichment in nodes with a correlation of >0.8 are considered significant and shown.
Genome Biology 2008, Volume 9, Issue 10, Article R156 Chan and Foster R156.8
Genome Biology 2008, 9:R156
Average-linkage clustering of proteins quantified in the honey bee larvaeFigure 4
Average-linkage clustering of proteins quantified in the honey bee larvae. Proteins that were quantified in either or both the (a) tissue or (b) hemolymph
for at least four out of five tested days were arranged by hierarchical clustering using software described in [46]. All expression values, shown relative to
day 3 (= 0, black), have been natural log-transformed (>0, red; <0, green; no data, grey). These proteins, which have been manually annotated with a
function and category, are calculated for enrichment within a node (results in Table 3) if the node correlation value is >0.8 (see thick bar on scale).
Correlation
0 0.8
1.0
-1.0
Correlation
0
0.8 1.0-1.0
12345
Days
-4 0 4
(a) (b)
12345
Days
No data
Genome Biology 2008, Volume 9, Issue 10, Article R156 Chan and Foster R156.9
Genome Biology 2008, 9:R156
hemolymph near the end of this developmental stage
(reviewed extensively in [20]). While the age-dependent pro-
duction of these abundant storage proteins is well known,
here we provide evidence of a concomitant up-regulation of
low copy transmembrane transporters [GO:0022857] that
may facilitate the export, including a porin [Gen-
Bank:66521459
]. Paradoxically, this astounding rate of pro-
tein production and export is paired with an opposite trend in
protein synthesis machinery and accessories, which had been
suspected in two reports in the 1960s [21,22]. Now we have
evidence for these previous suggestions, including the clear
age-associated decrease of more than 50 detected ribosomal
subunits, coupled with an increase of two transcription
repressors (although at p < 0.1 these did not satisfy signifi-
cance criteria) to support this former notion.
Fat accumulation is an important purpose of the rapid larval
growth, clearly indicated by the size of the fat body tissue rel-
ative to the whole organism, as well as the buildup of lipo-
phorins. Lipids in larval food is only 4% by weight [23],
meaning that de novo synthesis must account for the bulk of
stored fat. Fatty acid synthase [GenBank:66515350
] was one
of the most abundant proteins throughout the entire tested
period based on absolute protein expression estimates [24],
yet to our surprise we did not observe significant temporal
regulation in the expression of this enzyme with age. It is
worth noting that 'fat body' is somewhat of a misnomer, given
that it is involved in protein and glycogen storage, as well as
fat [19,25]. To drive these endergonic biosynthetic processes,
the demands for ATP must therefore be great. Not only do we
observe significant age-associated increases in ATP synthase
subunits, but also enzymes in energy-producing pathways
such as the tricarboxylic acid cycle and the electron transport
chain components. This may be attributed to an increase in
mitochondria size or numbers; however, there are at least two
reports that claim the number of mitochondria decreases as
the larva approaches pupation in other insects [26,27].
Proteins with high copy number, including the many dis-
cussed above, are always the first to be investigated in any
organism. The difficulties in studying proteins in honey bee
larva have multiple sources: the abundant storage proteins
broaden the dynamic concentration range, obscuring the rare
proteins; the clean dissection of larval organs presents a tech-
nical challenge since the fat body is large and is difficult to
remove; and finally, the lack of available antibodies against
even the most common proteins makes many conventional
biochemistry experiments, such as immunoprecipitation and
western blotting, impossible. These reasons have especially
hindered the study of fine larval organs such as the nervous
system and low abundance proteins related to immunity or
pathway regulation.
The ability of larvae to respond to external stimuli and inter-
nal regulatory cues increases with time, a trend that is clearly
reflected in our data. For example, odorant-based communi-
cation has been observed in old larvae [28,29]. Odorant bind-
ing protein 14 [GenBank:94158822
] was detected even on the
first day after hatching, showing upregulation with age (Fig-
ure 5b). This suggests that younger larvae may have the capa-
Expression profiles of four selected proteins during larval developmentFigure 5
Expression profiles of four selected proteins during larval development.
Expression levels (y-axis, expressed in natural log scale) over 5 days of
larval growth (x-axis) are shown for 3 proteins discussed in the text: (a)
imaginal disc growth factor [GenBank:66514614
], (b) odorant binding
protein 14 [GenBank:94158822
], (c) apismin [GenBank:58585112]. Error
bars represent one standard deviation.
-4
-2
0
2
4
12345
-4
-2
0
2
4
12345
-4
-2
0
2
4
12345
(a)
(b)
(c)
Genome Biology 2008, Volume 9, Issue 10, Article R156 Chan and Foster R156.10
Genome Biology 2008, 9:R156
Table 5
Comparing expression levels in honey bee versus fruit fly larvae
Honey bee accession
number
Protein description Slope difference (honey bee minus
fruit fly)
Expression trend: different or same?
GenBank:48126476 Translation: initiation factor 3f 0.01 Same
GenBank:110749015
Short-chain dehydrogenase family:
oxidoreductase
0.22 Same
GenBank:110756656
Protein methylation: arginine
methyltransferase
0.10 Same
GenBank:110759433
Ribonucleoprotein: ribonucleoprotein 0.10 Same
GenBank:110761364
Cytoskeleton: alpha-actinin 0.19 Same
GenBank:66547531
Pentose phosphate pathway: 6-
phosphogluconate dehydrogenase
0.24 Same
GenBank:66509442
Peptidase: dipeptidyl aminopeptidase 0.02 Same
GenBank:110764347
Amino acid metabolism: enolase-
phosphatase E1 (methionine salvage
pathway)
0.50 Same
GenBank:110762382
Transcription: spermidine synthase 0.51 Same
GenBank:110763730
Antioxidant: glutathione S transferase 0.32 Same
GenBank:66504249
Uncategorized: protein kinase c substrate 0.33 Same
GenBank:110755309
Protein receptor: high density lipoprotein
binding protein
0.33 Same
GenBank:110750855
Unknown function: unknown function 0.36 Same
GenBank:94158626
Electron transport chain: cytochrome
p450
0.51 Same
GenBank:58585148
Energy storage: hexamerin 70b 0.15 Same
GenBank:48095159
Peptidase: serine protease 0.34 Same
GenBank:66524124
Peptidase: carboxypeptidase B 0.07 Same
GenBank:66509812
Peptidase: angiotensin converting enzyme 0.28 Same
GenBank:110762229
Peptidase: chymotrypsin 0.47 Same
GenBank:66510448
Glycolipid metabolism: beta-glucosidase
(glucocerebrosidase)
0.10 Same
GenBank:110766932
Uncategorized: mannosidase, lysosomal 0.50 Same
GenBank:66513481
Ubiquitination: ubiquitin-activating enzyme
E1
0.48 Different
GenBank:66522467
Uncategorized: juvenile hormone
inducible protein
0.95 Different
GenBank:48104663
Protein receptor: protein kinase C
receptor
0.60 Different
GenBank:110758189
Uncategorized: carboxylesterase 0.94 Different
GenBank:110756254
Ribonucleoprotein: ribonucleoprotein 0.67 Different
GenBank:66522232
Uncategorized: isochorismatase 0.43 Different
GenBank:66535270
Uncategorized: oxoacidtransferase 0.42 Different
GenBank:66521459
Membrane transporter: porin 0.59 Different
GenBank:110764660
Helicase: RNA helicase 0.56 Different
GenBank:110762902
ATP synthase: ATP synthase component 0.77 Different
GenBank:66525867
Small molecule carrier: solute carrier 0.82 Different
GenBank:58531215
Membrane transporter: translocase, ATP 0.87 Different
GenBank:110759569
Apoptosis: beta-hexosaminidase 1.14 Different
Genes in a life-cycle transcriptomic analysis of D. melanogaster [15] were compared to honey bee larval proteomics data in this report by finding
homologs common to these studies. Significant matches (see Materials and methods for criteria) were assessed by comparing the slope values
calculated between days 1 and 4: a protein is marked 'same' if the sign of the slope was the same and had a difference no greater than 0.75;
otherwise, they are marked as 'different'.
Genome Biology 2008, Volume 9, Issue 10, Article R156 Chan and Foster R156.11
Genome Biology 2008, 9:R156
bility to bind certain odorant molecules, but whether that
translates into pheromonal communication is entirely specu-
lative. The positive temporal regulation of antimicrobial pep-
tide apismin [GenBank:58585112
] (Figure 5c) and the
melanization enzyme prophenoloxidase [Gen-
Bank:58585196
] in the hemolymph, which have clear roles in
defense [30-33], matches the observed susceptibility to dis-
eases such as foulbroods of the young larvae, suggesting that
one or both of these may be the factor responsible for success-
ful defense against foulbroods in older larvae. However, a C-
lectin [GenBank:110750008
] and a complement factor [Gen-
Bank:66508940] actually have no observable expression
trends, indicating that they may have alternative roles differ-
ent from homology-based function predictions. The 46-fold
increase of a neuropeptide Y receptor [GenBank:110764421
],
which controls appetite and fat storage, is reasonable given
the feeding activity of the larvae. An imaginal disc growth fac-
tor [GenBank:66514614
] increased by 40-fold over the course
of the experiment (Figure 5a) presumably gears the larva for
pupal development where specific limbs and organs will grow
from imaginal discs containing highly differentiated cells.
Proteomics is generally a discovery method and is thus an
excellent mechanism for hypothesis generation. We were able
to find several peculiar proteins supported by a number of
high quality mass spectra but no plausible explanation for its
presence or degree of age-dependent regulation. A protein
annotated as 'PREDICTED: similar to CG15040-PA' [Gen-
Bank:110749732
] was consistently found only in the hemol-
ymph of older larvae (up to 24-fold higher in 5-day old
compared to 3-day old larvae), yet it has no likely homologs
or discernable functional domains, bearing only a vague
resemblance to a protein [GenBank:124512744
] from Plas-
modium falciparum 3D7, found by PSI-BLAST [34,35].
Conclusion
To study honey bees, individual, environmental, and social
factors must be considered. The larval developmental stage
has been shown to be a highly complex period of biochemical
regulation. The proteomics data presented here are able to
support a model for energy metabolism and storage, as well as
reveal unexpected expression trends for proteins that
respond to external and internal stimulus, such as pherom-
ones, pathogens, and oxidants.
Materials and methods
Reagents
All salts and chemicals were of analytical grade or better and
were obtained from Sigma-Aldrich (St. Louis, MO, USA)
unless otherwise indicated. All solvents were of high perform-
ance liquid chromatography grade and were obtained from
ThermoFisher Scientific (Waltham, MA, USA). The following
materials were obtained as indicated: endopeptidase Lys-C
from, Wako Chemicals (Osaka, Japan); porcine modified
trypsin, Promega (Nepean, Ontario, Canada); loose ReproSil-
Pur 120 C
18
-AQ 3 μm, Dr Maisch (Ammerbuch-Entringen,
Germany); 96-well full skirt PCR plates, Axygen (Union City,
CA, USA); fused silica capillary tubing, Polymicro (Phoenix,
AZ, USA); 5 μl Microcap pipettes for hemolymph collection,
Drummond (Broomall, PA, USA); soft forceps for holding
bees, BioQuip (Rancho Dominguez, CA, USA); protease
inhibitor mixture, Roche Applied Science (Basel, Switzer-
land); precast 4-12%, 1 mm thick NuPAGE Novex BisTris2
Gels, Invitrogen (Carlsbad, CA, USA).
Obtaining larvae of known ages
Honey bee (A. mellifera ligustica) larvae were obtained from
colonies kept at the University of British Columbia, Vancou-
ver, BC, Canada. Samples were collected in the summer and
early autumn. To acquire larvae of known ages, a queen was
isolated on an empty frame of dark comb bracketed by two
frames approximately 50% filled with honey and pollen for 16
h inside a nucleus colony with several hundred worker bees.
The brood frame with newly laid eggs was then replaced into
the original hive, along with the queen, workers and two sup-
porting frames. The queen was separated from the newly laid
eggs using a queen excluder to prevent additional eggs from
being deposited. Three days after reintroducing the eggs into
the colonies, larvae were collected for five consecutive days.
In this system the maximum error in larval age would be 16 h.
Empirical testing with shorter times did not yield enough
eggs/larvae to sample the same population over all five days
of development. Before proceeding with protein collection, all
larvae were washed three times in phosphate buffered saline
to reduce royal jelly contamination.
Protein collection
For 1- to 3-day old larvae, hemolymph was collected by pierc-
ing the larval skin, taking care not to cause organ damage by
avoiding deep cuts. For 4- and 5-day old larvae, hemolymph
was collected by inserting a disposable 5 μl glass Microcap
pipette two-thirds of the way down one side of the larva,
drawing liquid by capillary action. All hemolymph samples
were centrifuged for 10 minutes at 16,100 relative centrifugal
force (r.c.f.) at 4°C to pellet cells and debris, which were
added to the tissue samples. The tissues were homogenized by
a bead mill using a tungsten bead in each 2 ml self-locking
tube (Eppendorf, Hamburg, Germany) at 30 Hz for 5 minutes
in 50 μl of phosphate buffered saline containing a protease
inhibitor cocktail tablet solution (Roche) at 8 times the sug-
gested concentration. Lysis buffer (100 μl of NP-40, and so
on) was added before the sample was homogenized by 10
strokes through a syringe tipped with a 25 G needle. The sam-
ple was clarified for 10 minutes at 16,100 r.c.f. at 4°C and the
pelleted debris was discarded. The Coomassie Plus Protein
Assay (Pierce, Rockford, IL, USA) was used to determine pro-
tein concentrations of the tissue lysates and the clarified
hemolymph according to the manufacturer's instructions
before they were stored at -20°C until used.
Genome Biology 2008, Volume 9, Issue 10, Article R156 Chan and Foster R156.12
Genome Biology 2008, 9:R156
Denaturing protein gel electrophoresis
Tissue and hemolymph proteins were resolved on precast
(Invitrogen) 4-12% NuPAGE gels (30 μg/lane) in reducing
conditions with MES buffer according to the manufacturer's
instructions. Blue-silver stain [36] was used to visualize pro-
tein bands.
Sample preparation for mass spectrometry analysis
Larval tissue or hemolymph protein were aliquoted to pro-
vide 20 μg per sample before they were precipitated using the
ethanol/acetate method as described [37]. The insoluble pro-
teins were pelleted and temporarily stored at 4°C after a 10-
minute centrifugation at 16,100 r.c.f. The ethanol superna-
tant was vacuum-dried, solubilized in sample buffer (3% ace-
tonitrile, 1% trifluoroacetic acid, 0.5% acetic acid), and
purified using the C
8
flavor of STop And Go Extraction
(STAGE) tips [38] to remove contaminants such as lipids,
nucleic acids, and protease inhibitors. Bound proteins were
eluted using 100% acetonitrile and vacuum-dried before add-
ing 0.5 μl of 1.5 M Tris-HCl, pH 8.8. The bulk protein pellet
and C
8
purified proteins were digested using LysC and trypsin
as described [37]. Peptides were desalted using C
18
STAGE
tips and the eluted solution was dried by vacuum centrifuga-
tion. For proteome profiling by relative quantification, binary
analysis between timepoints was performed by chemical
dimethylation of peptides from different timepoints using
either light (CH
2
O) or heavy (CD
2
O) isotopologues of formal-
dehyde. For both the hemolymph and tissue samples, 3-day
old larvae were used as a reference for all other timepoints,
such that their peptides were always labeled with the oppos-
ing form of formaldehyde from days 1, 2, 4, and 5 before mix-
ing the differentially labeled samples. Samples were
fractionated on C
18
-SCX-C
18
STAGE tips using a 10-step
ammonium acetate elution gradient [39] and dried peptide
samples were resuspended in 1% trifluoroacetic acid, 3% ace-
tonitrile, 0.5% acetic acid prior to analysis on a linear trap-
ping quadrupole-Orbitrap hybrid mass spectrometry
(ThermoFisher Scientific, Waltham, MA, USA) as described
in [3].
Raw data processing
Following liquid chromatography-mass spectrometry analy-
sis, peak lists were extracted from the raw data using
Extract_MSN.exe (ThermoFisher Scientific) and DTA Super-
charge [40] as described [41]. Results were searched using
Mascot (v2.2) against a database containing the protein
sequences of: Honey Bee Official Gene Set 1 [42], common
exogenous contaminants (human and sheep keratins) and
additives (porcine trypsin, lysyl endopeptidase C), the poly-
protein of the deformed wing virus (common and often
asymptomatic [43]), and the reversed sequences of all of the
above as a decoy for reporting false discovery rates. The fol-
lowing Mascot parameters were used: trypsin (allowing up to
one missed cleavage) or no enzyme specificity (in separate
searches); carbamidomethyl as a fixed modification, variable
modifications of dimethylation by both hydrogen isotopes at
the peptides' amino termini and lysine ε-amino groups, 10
ppm peptide tolerance; 0.8 Da tandem mass spectrometry
tolerance, and electrospray ionization-Trap fragmentation
characteristics. Results were saved in Peptide Summary for-
mat with the 'Require Bold Red' option checked, applying a
score cutoff corresponding to p < 0.05, which is 27 where
results were limited to tryptic peptides, and 47 where no
enzymes were specified. Since each sample was fractioned,
generated files were combined using the in-house script Pick-
letrimmer.pl. MSQuant [40] was used to semi-automatically
extract chromatographic peak volumes in both the light and
heavy isotopologues of each detected peptide. Only peptides
with an absolute calibrated mass error of <5 ppm were con-
sidered further. For protein quantification, the file was parsed
(in-house script: QC_msqfa.pl) to obtain natural logarithm
(Ln)-transformed heavy/light peptide volume ratios, which
were median-normalized before they were averaged to calcu-
late a relative protein ratio of day 3 larvae/day × larvae
(where x = 1, 2, 4, or 5). From the three biological replicates
of each binary comparison, proteins quantified with at least
two quantified peptides from two or more replicates were
averaged. Proteins whose relative quantities could be tracked
for at least 4 of 5 days in either the tissue or hemolymph were
considered to be profiled. For protein identification, the
above peptides and unquantified sequences were extracted
from MSQuant outputs. After removing redundant entries
(in-house script: QC_remduplicate.pl), each was matched to
their respective protein (in-house script: finalist.pl),
excluding hits that were verified by equal to or less than two
peptides of at least six or more residues. The false discovery
rate was estimated by dividing the sequence-reversed pro-
teins that failed to be eliminated after applying the above
criteria.
Automated protein annotation to Gene Ontology
terms
All identified proteins were matched to GO [44] terms using
BLAST2GO [12], following their standard procedure of per-
forming BLAST searches for each protein (BLASTp, nr data-
base, high scoring segment pair (HSP) cutoff length 33, report
20 hits, maximum e-value 1e-10), followed by mapping and
annotation (e-value hit filter 1e-10, annotation cutoff 55, GO
weight 5, HSP-hit coverage cutoff 20). After generating a
directed acyclic graph (sequence filter 2, score alpha 0.6,
node score filter 0) of molecular function terms (not shown),
which groups specific terms into broader categories, ontolo-
gies on the third level of this graph were further analyzed by
statistical testing (see below). The term 'protein binding'
[GO:0005515] was omitted because this included the most
number of proteins, most of which belonged under another
more informative term.
Semi-automated protein annotation and manual
categorization
Protein descriptions were taken from several sources or tools,
all of which are sequence homology-based derivations. Offi-
Genome Biology 2008, Volume 9, Issue 10, Article R156 Chan and Foster R156.13
Genome Biology 2008, 9:R156
cial protein names given in the Official Gene Set 1 [42] were
used if the name was informative. BLAST2GO-derived
descriptions were used where protein function was not clear
from the official name (for example 'hypothetical protein'). If
an appropriate name was still not derived, searches against
the Conserved Domain Database (NCBI) were performed and
considered matched for e-values <1e-10. As a final measure
for matching a protein with a functional name, proteins
descriptions were copied from Blast2seq [45] results
(accessed via BLink in NCBI) if matches had >25% sequence
identity and an e-value of <1e-10 over the aligned region. If
none of these steps provided useful information, the protein
was labeled and categorized with 'unknown function.' Pro-
teins with descriptions but that did not fit under a specific cat-
egory were classified as 'uncategorized' (supplementary Table
5 in Additional data file 1). Proteins that were not manually
annotated are marked with 'NA' in the 'Description' column of
supplementary Table 1 in Additional data file 1.
Statistical analysis
To each class of manually assigned proteins, a pairwise, two-
tailed t-test was performed using each protein in that class by
taking the relative ratio in day 1 and comparing to day 5.
Groups with p < 0.05 were considered to be temporally regu-
lated, and their directionality of regulation was calculated by
averaging the slopes of individual proteins within a group
using day 1 and day 5 timepoints. Third-level GO molecular
function terms were analyzed in the same manner, except all
the proteins considered were quantified over all five days
tested in at least one of the tissue or hemolymph datasets. To
individual proteins, the same criteria for significance was
used, taking values from each biological replicate as a data
point in a pairwise comparison between the earliest and latest
day the protein was quantified. We also performed average
linkage clustering of the protein expression levels for proteins
that were quantified over at least 4 days in either the tissue or
hemolymph using Cluster and visualized by Treeview [46].
The grouping sizes ranged from 2 to 55 proteins. To normal-
ize this variation, the number of proteins in a given class is
reported as a percentage of the total class size (percent
enrichment, using in-house script QC_nodeenrichment.pl).
Only nodes that included at least 50% of all the proteins in
that class and had a Pearson's correlation coefficient of
greater than 0.8 were considered to be within the same clus-
ter. Protein families with three or fewer members were
included as part of the tree diagram, but were not considered
for whether they formed a significant cluster.
Comparison to Drosophila
Proteomic profiles resulting from this work were compared to
the transcriptomic profiles of previously published Dro-
sophila homologs [15] for the timepoints matching most
closely to days 1 to 4 of the honey bee larval stage (h = 24, 49,
72, 96) for genes that were significantly regulated over this
period (the fruit fly larval stage is shorter than that of bee by
1 to 2 days). BLASTp was used to find homologs in the Honey
Bee Official Gene Set 1, which were defined as matches having
e-values <1e-10 with at least 25% identity within the aligned
region. Timepoints of the Drosophila dataset were normal-
ized to the h = 72 timepoint and Ln transformed. To compare
the expression trend between the two organisms, the slope of
the line-of-best-fit for proteins (bees) or genes (flies) was cal-
culated: expression trends with slopes that differed in signage
or had an absolute difference of greater than 0.75 were con-
sidered to be dissimilar. Slopes whose absolute Pearson's cor-
relation coefficient value was <0.5 were considered
insignificant and, therefore, not considered. In instances
where a significant slope could be calculated for a protein in
both the tissue and hemolymph samples, the slopes were
averaged.
Abbreviations
GO: Gene Ontology; Ln: natural logarithm; r.c.f.: relative cen-
trifugal force; STAGE: STop And Go Extraction.
Authors' contributions
QWCT and LJF jointly conceived of the study, authored the
scripts used in the data analysis and wrote the manuscript.
QWCT conducted all the experimental work, mass spectro-
metric analysis and bioinformatics. LJF supervised the work
and helped to troubleshoot throughout.
Additional data files
The following additional data are available with the online
version of this paper. Additional data file 1 includes supple-
mentary Tables 1-10.
Additional data file 1Supplementary Tables 1-10.Supplementary Table 1: relative quantification of bee larval pro-teome. Supplementary Table 2: Gene Ontology terms assigned to honey bee larval proteins. Supplementary Table 3: Gene Ontology categorization of proteins by molecular function using directed acyclic graphs. Supplementary Table 4: Gene Ontology 'molecular function' vocabularies assigned to proteins on level 3 of a directed acyclic graph. Supplementary Table 5: manually assigned protein function and functional class. Supplementary Table 6: average slope values of proteins within manually assigned functional classes. Supplementary Table 7: enrichment analysis of hierarchi-cal clustering of proteins profiled from the honey bee larval solid tissue. Supplementary Table 8: enrichment analysis of hierarchical clustering of proteins profiled from the honey bee larval hemol-ymph. Supplementary Table 9: enrichment analysis of hierarchical clustering of proteins profiled from the honey bee larval hemol-ymph. Supplementary Table 10: peptide sequence data.Click here for file
Acknowledgements
The authors wish to thank Nikolay Stoynov for technical assistance. Oper-
ating funds for this work came from the Natural Sciences and Engineering
Research Council (NSERC) of Canada. The mass spectrometry hardware
and software were funded by the Canadian Foundation for Innovation and
the Michael Smith Foundation for Health Research through the British
Columbia Proteomics Network. QWTC is supported by an NSERC PGS-
D award and LJF is the Canada Research Chair in Organelle Proteomics and
a Michael Smith Foundation Scholar.
References
1. Haldane JBS: Aristotle's account of bees' 'dances'. J Hellenic
Studies 1955, 75:24-25.
2. Consortium THGS: Insights into social insects from the
genome of the honeybee Apis mellifera. Nature 2006,
443:931-949.
3. Chan QW, Howes CG, Foster LJ: Quantitative comparison of
caste differences in honeybee hemolymph. Mol Cell Proteomics
2006, 5:2252-2262.
4. Scharlaken B, de Graaf DC, Goossens K, Peelman LJ, Jacobs FJ: Dif-
ferential gene expression in the honeybee head after a bac-
terial challenge. Dev Comp Immunol 2008, 32:883-889.
5. Wolschin F, Amdam GV: Comparative proteomics reveal char-
acteristics of life-history transitions in a social insect. Pro-
teome Sci 2007, 5:10.
6. Wolschin F, Amdam GV: Plasticity and robustness of protein
patterns during reversible development in the honey bee
Genome Biology 2008, Volume 9, Issue 10, Article R156 Chan and Foster R156.14
Genome Biology 2008, 9:R156
(Apis mellifera). Anal Bioanal Chem 2007, 389:1095-1100.
7. Patel A, Fondrk MK, Kaftanoglu O, Emore C, Hunt G, Frederick K,
Amdam GV: The making of a queen: TOR pathway is a key
player in diphenic caste development. PLoS ONE 2007, 2:e509.
8. Nelson JA: Morphology of the honeybee larva. J Agricult Res
1924, 28:1167-1229.
9. Cunha AD, Nascimento AM, Guidugli KR, Simoes ZL, Bitondi MM:
Molecular cloning and expression of a hexamerin cDNA
from the honey bee, Apis mellifera. J Insect Physiol 2005,
51:1135-1147.
10. Danty E, Arnold G, Burmester T, Huet JC, Huet D, Pernollet JC, Mas-
son C: Identification and developmental profiles of hexamer-
ins in antenna and hemolymph of the honeybee, Apis
mellifera. Insect Biochem Mol Biol 1998, 28:387-397.
11. Korochkina SE, Gordadze AV, York JL, Benes H: Mosquito hexam-
erins: characterization during larval development. Insect Mol
Biol 1997, 6:11-21.
12. Conesa A, Gotz S, Garcia-Gomez JM, Terol J, Talon M, Robles M:
Blast2GO: a universal tool for annotation, visualization and
analysis in functional genomics research. Bioinformatics 2005,
21:3674-3676.
13. Guedes Sde M, Vitorino R, Tomer K, Domingues MR, Correia AJ,
Amado F, Domingues P: Drosophila melanogaster larval hemol-
ymph protein mapping. Biochem Biophys Res Commun 2003,
312:545-554.
14. Li XH, Wu XF, Yue WF, Liu JM, Li GL, Miao YG: Proteomic analy-
sis of the silkworm (Bombyx mori L.) hemolymph during
developmental stage. J Proteome Res 2006, 5:2809-2814.
15. Arbeitman MN, Furlong EE, Imam F, Johnson E, Null BH, Baker BS,
Krasnow MA, Scott MP, Davis RW, White KP: Gene expression
during the life cycle of Drosophila melanogaster. Science 2002,
297:2270-2275.
16. Snodgrass RE: The feeding and growth of the larvae. In Anatomy
and Physiology of the Honeybee Edited by: Piper CV. New York:
McGraw-Hill; 1925:172.
17. Bishop GH: Cell metabolism in the insect fat body. J Morph
1923, 37:533-553.
18. Omenn GS, States DJ, Adamski M, Blackwell TW, Menon R, Hermja-
kob H, Apweiler R, Haab BB, Simpson RJ, Eddes JS, Kapp EA, Moritz
RL, Chan DW, Rai AJ, Admon A, Aebersold R, Eng J, Hancock WS,
Hefta SA, Meyer H, Paik YK, Yoo JS, Ping P, Pounds J, Adkins J, Qian
X, Wang R, Wasinger V, Wu CY, Zhao X, et al.: Overview of the
HUPO Plasma Proteome Project: results from the pilot
phase with 35 collaborating laboratories and multiple analyt-
ical groups, generating a core dataset of 3020 proteins and a
publicly-available database. Proteomics 2005, 5:3226-3245.
19. de Oliveira VTP, Cruz-Landim C: Morphology and function of
insect fat body cells: a review. Biociencias 2003, 11:195-205.
20. Price GM: Protein and nucleic acid metabolism in insect fat
body. Biol Rev 1973, 48:333-375.
21. Ruegg MK: Untersuchungen zum Proteinstoffwechsel des
Wildtyps und der Letalmutante (Itr) von Drosophila melu-
nogaster. vergl Physiol 1968, 60:275-307.
22. Martin MD, Kinnear JF, Thomson JA: Developmental changes in
the late larva of Calliphora stygia. II. Protein synthesis. Aust J
Biol Sci 1969, 22:935-945.
23. Antinelli JF, Davico R, Rognone C, Faucon JP, Lizzani-Cuvelier L:
Application of solid/liquid extraction for the gravimetric
determination of lipids in royal jelly. J Agric Food Chem 2002,
50:2227-2230.
24. Lu P, Vogel C, Wang R, Yao X, Marcotte EM: Absolute protein
expression profiling estimates the relative contributions of
transcriptional and translational regulation. Nat Biotechnol
2007, 25:
117-124.
25. Coupland RE: Observations on the normal histology and histo-
chemistry of the fat body of the locust (Schistocerca gregaria).
J Exp Biol 1957, 34:290-296.
26. Benson KA: An investigation of some developmental changes
in the larval fat body of Sarcophaga bullata prior to
metamorphosis. In PhD thesis University of Virgina; 1965.
27. Walker PR: An electrom microscope study of the fat body of
the moth, Philosamiu, during growth and metamorphosis. J
Insect Physiol 1966, 12:1009-1018.
28. Laurent S, Masson C, Jakob I: Whole-cell recording from honey-
bee olfactory receptor neurons: ionic currents, membrane
excitability and odourant response in developing workerbee
and drone. Eur J Neurosci 2002, 15:1139-1152.
29. Le Conte Y, Becard JM, Costagliola G, de Vaublanc G, El Maataoui M,
Crauser D, Plettner E, Slessor KN: Larval salivary glands are a
source of primer and releaser pheromone in honey bee (Apis
mellifera L.). Naturwissenschaften 2006, 93:237-241.
30. Bilikova K, Hanes J, Nordhoff E, Saenger W, Klaudiny J, Simuth J: Api-
simin, a new serine-valine-rich peptide from honeybee (Apis
mellifera L.) royal jelly: purification and molecular
characterization. FEBS Lett 2002, 528:125-129.
31. Tang H, Kambris Z, Lemaitre B, Hashimoto C: Two proteases
defining a melanization cascade in the immune system of
Drosophila. J Biol Chem 2006, 281:28097-28104.
32. Marmaras VJ, Charalambidis ND, Zervas CG: Immune response in
insects: the role of phenoloxidase in defense reactions in
relation to melanization and sclerotization. Arch Insect Biochem
Physiol 1996, 31:119-133.
33. Ling E, Yu XQ: Prophenoloxidase binds to the surface of
hemocytes and is involved in hemocyte melanization in Man-
duca sexta. Insect Biochem Mol Biol 2005, 35:1356-1366.
34. Altschul SF, Madden TL, Schaffer AA, Zhang J, Zhang Z, Miller W, Lip-
man DJ: Gapped BLAST and PSI-BLAST: a new generation of
protein database search programs. Nucleic Acids Res 1997,
25:3389-3402.
35. Altschul SF, Wootton JC, Gertz EM, Agarwala R, Morgulis A, Schaffer
AA, Yu YK: Protein database searches using compositionally
adjusted substitution matrices. Febs J 2005, 272:5101-5109.
36. Candiano G, Bruschi M, Musante L, Santucci L, Ghiggeri GM,
Carnemolla B, Orecchia P, Zardi L, Righetti PG: Blue silver: a very
sensitive colloidal Coomassie G-250 staining for proteome
analysis. Electrophoresis 2004, 25:1327-1333.
37. Foster LJ, De Hoog CL, Mann M: Unbiased quantitative pro-
teomics of lipid rafts reveals high specificity for signaling
factors. Proc Natl Acad Sci USA 2003, 100:5813-5818.
38. Rappsilber J, Ishihama Y, Mann M: Stop and go extraction tips for
matrix-assisted laser desorption/ionization, nanoelectro-
spray, and LC/MS sample pretreatment in proteomics. Anal
Chem 2003, 75:663-670.
39. Ishihama Y, Rappsilber J, Mann M: Modular stop and go extraction
tips with stacked disks for parallel and multidimensional
Peptide fractionation in proteomics. J Proteome Res 2006,
5:988-994.
40. MSQuant []
41. Kwok MC, Holopainen JM, Molday LL, Foster LJ, Molday RS: Pro-
teomics of photoreceptor outer segments identifies a subset
of SNARE and rab proteins implicated in membrane vesicle
trafficking and fusion. Mol Cell Proteomics 2008, 7:1053-1066.
42. Elsik CG, Mackey AJ, Reese JT, Milshina NV, Roos DS, Weinstock
GM: Creating a honey bee consensus gene set. Genome Biol
2007, 8:R13.
43. Yue C, Genersch E: RT-PCR analysis of Deformed wing virus in
honeybees (Apis mellifera) and mites (Varroa destructor). J
Gen Virol 2005, 86:3419-3424.
44. Ashburner M, Ball CA, Blake JA, Botstein D, Butler H, Cherry JM,
Davis AP, Dolinski K, Dwight SS, Eppig JT, Harris MA, Hill DP, Issel-
Tarver L, Kasarskis A, Lewis S, Matese JC, Richardson JE, Ringwald M,
Rubin GM, Sherlock G: Gene Ontology: tool for the unification
of biology. The Gene Ontology Consortium. Nat Genet 2000,
25:25-29.
45. Tatusova TA, Madden TL: BLAST 2 Sequences, a new tool for
comparing protein and nucleotide sequences. FEMS Microbiol
Lett 1999, 174:247-250.
46. Eisen MB, Spellman PT, Brown PO, Botstein D: Cluster analysis
and display of genome-wide expression patterns. Proc Natl
Acad Sci USA 1998, 95:14863-14868.