Báo cáo y học: " EpiGRAPH: user-friendly software for statistical analysis and prediction of (epi)genomic data" pps
Bạn đang xem bản rút gọn của tài liệu. Xem và tải ngay bản đầy đủ của tài liệu tại đây (777.41 KB, 14 trang )
Genome Biology 2009, 10:R14
Open Access
2009Bocket al.Volume 10, Issue 2, Article R14
Software
EpiGRAPH: user-friendly software for statistical analysis and
prediction of (epi)genomic data
Christoph Bock, Konstantin Halachev, Joachim Büch and
Thomas Lengauer
Address: Max-Planck-Institut für Informatik, Campus E1.4, 66123 Saarbrücken, Germany.
Correspondence: Christoph Bock. Email:
© 2009 Bock et al.; licensee BioMed Central Ltd.
This is an open access article distributed under the terms of the Creative Commons Attribution License ( which
permits unrestricted use, distribution, and reproduction in any medium, provided the original work is properly cited.
EpiGRAPH<p>EpiGRAPH is a genome-scale data-mining software tool that enables users to identify epigenetic and gene regulatory features in large datasets of genomic regions.</p>
Abstract
The EpiGRAPH web service enables biologists to uncover hidden
associations in vertebrate genome and epigenome datasets. Users can upload sets of genomic
regions and EpiGRAPH will test multiple attributes (including DNA sequence, chromatin structure,
epigenetic modifications and evolutionary conservation) for enrichment or depletion among these
regions. Furthermore, EpiGRAPH learns to predictively identify similar genomic regions. This paper
demonstrates EpiGRAPH's practical utility in a case study on monoallelic gene expression and
describes its novel approach to reproducible bioinformatic analysis.
Rationale
EpiGRAPH addresses two tasks that are common in genome
biology: discovering novel associations between a set of
genomic regions with a specific biological role (for example,
experimentally mapped enhancers, hotspots of epigenetic
regulation or sites exhibiting disease-specific alterations) and
the bulk of genome annotation data that are available from
public databases; and assessing whether it is possible to pre-
dictively identify additional genomic regions with a similar
role without the need for further wet-lab experiments.
The increasing relevance of analyzing sets of genomic regions
arises from technical innovations such as tiling microarrays
and next-generation sequencing [1-5], which can be used to
scan the genome for specific types of regions (for example,
transcription factor binding sites or cancer-specific genomic
alterations). The resulting datasets are difficult to analyze
with existing toolkits for genomic data mining - such as GSEA
[6] and DAVID [7] - because most existing tools are gene-cen-
tric and cannot easily account for genomic regions that are
located outside of (protein-coding) genes. In the absence of a
suitable tool for statistical analysis and prediction of genomic
region data, researchers have performed the necessary steps
by hand, downloading relevant datasets from existing reposi-
tories and writing one-time-use scripts for data integration,
statistical analysis and prediction (for example, [8-19]). Such
manual analyses are time-consuming to perform, difficult to
reproduce and require bioinformatic skills that are beyond
the reach of most biologists. Hence, these studies support
demand for a software toolkit that facilitates statistical analy-
sis and prediction of region-based genome and epigenome
data.
With the development of EpiGRAPH, we have pulled together
our experiences and established workflows from several stud-
ies [10,20-23] and incorporated them into a powerful and
easy-to-use web service. In the remainder of this paper, we
sketch the basic concepts of EpiGRAPH, demonstrate its
practical use and utility in a case study on monoallelic gene
expression, and outline how the UCSC Genome Browser [24],
Published: 10 February 2009
Genome Biology 2009, 10:R14 (doi:10.1186/gb-2009-10-2-r14)
Received: 18 June 2008
Revised: 3 December 2008
Accepted: 10 February 2009
The electronic version of this article is the complete one and can be
found online at /> Genome Biology 2009, Volume 10, Issue 2, Article R14 Bock et al. R14.2
Genome Biology 2009, 10:R14
Galaxy [25,26] and EpiGRAPH integrate into a comprehen-
sive pipeline for (epi)genome analysis and prediction. Finally,
the Methods section provides extensive bioinformatic back-
ground on EpiGRAPH's software architecture and describes
how the software can be extended and customized. This paper
is supplemented by a step-by-step, tutorial-style description
of two example analyses [27] and by three tutorial videos that
demonstrate EpiGRAPH 'in action' [28].
Concept
EpiGRAPH is designed to facilitate complex bioinformatic
analyses of genome and epigenome datasets. Such datasets
frequently consist of sets of genomic regions that share cer-
tain properties, for example, being bound by a specific tran-
scription factor or exhibiting characteristic patterns of
evolutionary conservation. Typically, these genomic regions
fall into opposing classes, for example, transcription factor
bound versus unbound promoter regions or significantly con-
served versus nonconserved regulatory elements. Even when
this convenient situation does not emerge by default, it is
straightforward and common practice to establish it artifi-
cially, by generating a randomized set of control regions to
complement a given set of genomic regions. EpiGRAPH thus
focuses on the analysis of sets of genomic regions that fall into
two classes, which we denote as 'positives' (cases) and 'nega-
tives' (controls).
EpiGRAPH provides four analytical modules (see Figures 1, 2,
3 for screenshots of illustrative results and Figure 4 for an
overview of EpiGRAPH's software architecture). The statisti-
cal analysis module identifies attributes that differ signifi-
cantly between the sets of positives and negatives, based on
an attribute database comprising a broad range of genome
and epigenome datasets. The diagram generation module
draws boxplots that visualize the distribution of a selected
attribute among the sets of positives versus negatives. The
machine learning analysis module evaluates how well predic-
tion algorithms - such as support vector machines - can dis-
criminate between positives and negatives in the input
dataset, based on different combinations of (epi)genomic
attributes from the database. The prediction analysis module
predicts whether a genomic region that is not contained in the
input dataset belongs to the set of positives or negatives, thus
exploiting any correlations detected by the machine learning
analysis module for the prediction of new data.
Typical EpiGRAPH analyses follow a defined workflow. The
starting point is a dataset of genomic regions, which the user
may have obtained through wet-lab analysis (for example,
ChIP-seq analysis of transcription factor binding) or bioinfor-
matic calculations (for example, computational screening for
regions that are under evolutionary constraint). This dataset
is uploaded to the EpiGRAPH web service as a table of
genomic regions with separate columns for chromosome
name, start position, end position, and a binary class value
specifying for each region whether it belongs to the positives
or negatives. (When no class value is provided, EpiGRAPH
regards all genomic regions of the input dataset as positives
and assists the user with calculating a set of random control
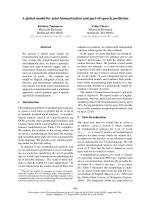
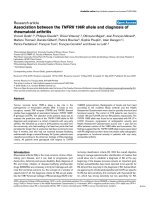
Results screenshot of EpiGRAPH's statistical analysis identifying significant differences between the promoter regions of monoallelically versus biallelically expressed genesFigure 1
Results screenshot of EpiGRAPH's statistical analysis identifying significant differences between the promoter regions of monoallelically versus biallelically
expressed genes. Comparing the promoter regions of monoallelically expressed genes (class = 1) with those of biallelically expressed genes (class = 0),
EpiGRAPH's statistical analysis detects highly significant differences in terms of chromatin structure and transcriptional activity. P-values in this table are
based on the nonparametric Wilcoxon rank-sum test ('method' column). Multiple hypothesis testing was accounted for with both the highly conservative
Bonferroni method ('sig bonf' column) and the false discovery rate method ('sig fdr' column). A global significance threshold of 5% was used in both cases.
Attributes highlighted in red are discussed in the main text. An explanation of attribute names is available from the EpiGRAPH website [29].
Genome Biology 2009, Volume 10, Issue 2, Article R14 Bock et al. R14.3
Genome Biology 2009, 10:R14
regions to be used as negatives.) Next, EpiGRAPH calculates
a large number of potentially relevant attributes for each
genomic region in the input dataset. Most of these attributes
represent overlap frequencies or score values, quantifying the
co-localization of the genomic regions in the input dataset
with publicly available annotation data for the respective
genome. Upon completion of the attribute calculation (which
can take several hours or even days when the input dataset is
large), EpiGRAPH's statistical and machine learning modules
test for significant differences between the positives and neg-
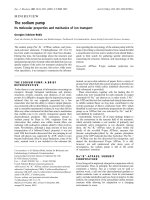
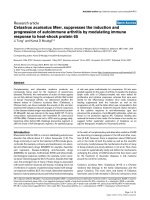
EpiGRAPH-generated diagrams highlighting differential histone modification patterns for the promoters of monoallelically versus biallelically expressed genesFigure 2
EpiGRAPH-generated diagrams highlighting differential histone modification patterns for the promoters of monoallelically versus biallelically expressed
genes. This figure displays EpiGRAPH-generated boxplots comparing the promoter regions of genes exhibiting monoallelic (red boxplots) versus biallelic
gene expression (yellow boxplots) with respect to their enrichment for two histone modifications, (a) H3 lysine 4 trimethylation and (b) H3 lysine 27
trimethylation. The y-axis plots the frequency of overlap with ChIP-seq tags [37], which is indicative of the strength of enrichment of the corresponding
histone modification. Boxplots are in standard format (boxes show center quartiles, whiskers extend to the most extreme data point, which is no more
than 1.5 times the interquartile range from the box) and outliers are shown as crosses.
Attribute name: Epigenome_and_Chromatin_Structure.NIH_Chromatin_Blood.chromMod_H3K4me3_overlapRegionsCount
Feature value
Left window (−2): −50 kb to −10 kb Center window (0): 0 bp to 0 bp Right window (2): 10 kb to 50 kb
0 200 400 600 800
Monoallelic_vs_biallelic_gene_expression.monoallelically_expressed = 0
Monoallelic_vs_biallelic_gene_expression.monoallelically_expressed = 1
Attribute name: Epigenome_and_Chromatin_Structure.NIH_Chromatin_Blood.chromMod_H3K27me3_overlapRegionsCount
Feature value
Left window (−2): −50 kb to −10 kb Center window (0): 0 bp to 0 bp Right window (2): 10 kb to 50 kb
0 200 400 600 800
Monoallelic_vs_biallelic_gene_expression.monoallelically_expressed = 0
Monoallelic_vs_biallelic_gene_expression.monoallelically_expressed = 1
(b) Boxplot diagram for (repressive) histone H3 lysine 27 trimethylation
(a) Boxplot diagram for (open-chromatin associated) histone H3 lysine 4 trimethylation
Genome Biology 2009, Volume 10, Issue 2, Article R14 Bock et al. R14.4
Genome Biology 2009, 10:R14
atives in the input dataset and perform an initial assessment
of whether or not these differences are sufficient for bioinfor-
matic prediction. Based on an inspection of these results, the
user can request follow-up analyses utilizing the pre-calcu-
lated data. In particular, the diagram generation module can
be used to visualize interesting differences between positives
and negatives as detected by the statistical analysis, and the
prediction analysis module lets the user predict the class
value of new genomic regions - for example, in order to
extrapolate experimental data to regions that were not cov-
ered by wet-lab experiments.
The key to EpiGRAPH's practical utility is its database, for
which we collected a large number of attributes that are likely
to play a role in genome function and epigenetic regulation.
For the most thoroughly annotated human genome, Epi-
GRAPH currently includes almost a thousand attributes (see
Table 1 for an overview and the attribute documentation web-
site [29] for details). These attributes fall into ten groups:
DNA sequence; DNA structure; repetitive DNA; chromosome
organization; evolutionary history; population variation;
genes; regulatory regions; transcriptome; and epigenome and
chromatin structure. EpiGRAPH also incorporates the
genomes of chimp, mouse and chicken (with slightly lower
numbers of attributes) and can easily be extended to support
genomes of other species. In addition to using EpiGRAPH's
default attributes, researchers can upload their own datasets
and incorporate them as custom attributes in subsequent
analyses. This is particularly useful because problem-relevant
experimental data - such as chromatin structure data for the
cell type of interest - often boost EpiGRAPH's prediction
accuracy.
Application
The best starting point for getting acquainted with the practi-
cal use of EpiGRAPH are the tutorial videos [28] and the step-
by-step guide [27], which is available online. In the following
case study, we take a slightly more high-level view, focusing
on how to plan and interpret an EpiGRAPH analysis and
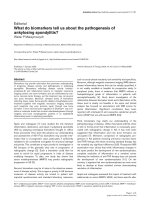
Results screenshots of EpiGRAPH's machine learning module predicting monoallelic gene expressionFigure 3
Results screenshots of EpiGRAPH's machine learning module predicting monoallelic gene expression. (a-c) These screenshots display the results of
machine learning analyses comparing the promoter regions of monoallelically expressed genes (class = 1) with those of biallelically expressed genes (class
= 0), each panel being based on different EpiGRAPH settings. The table values in the tables summarize the average performance of a linear support vector
machine or alternative machine learning algorithms (c) that were trained and evaluated in ten repetitions of a tenfold cross-validation. Performance
measures include mean correlation ('mean corr' column), prediction accuracy ('mean acc' column), sensitivity ('sens' column) and specificity ('spec'
column). Additional columns display standard deviations observed among the repeated cross-validations with random partition assignment ('corr sd' and
'acc sd'), the number of variables in each attribute group ('#vars') and the total number of genomic regions included in the analysis ('#cases').
(a) Initial results using EpiGRAPH’s default settings
(b) Follow-up analysis for all possible combinations of attribute groups
(c) Follow-up analysis with all implemented machine learning algorithms
Genome Biology 2009, Volume 10, Issue 2, Article R14 Bock et al. R14.5
Genome Biology 2009, 10:R14
highlighting potential sources of misinterpretation. All raw
data, settings and results of this case study are available
online [30], and readers are encouraged to download the
analysis description file, upload it into their own EpiGRAPH
accounts, reproduce the results and perform follow-up analy-
ses.
Monoallelic gene expression - the focus of our case study - is
a common phenomenon in vertebrate genomes. While the
majority of human genes are expressed from both alleles, a
sizable proportion is expressed exclusively from a single
allele, with important biological consequences. Genomic
imprinting - that is, parent-specific monoallelic gene expres-
sion - plays a critical role in normal development and gives
rise to non-Mendelian patterns of inheritance [31]. X-chro-
mosome inactivation leads to mitotically heritable silencing
of the surplus X chromosome in females [32]. And random
monoallelic gene expression, which is common among odor-
ant receptor genes and immune-system related genes,
increases the phenotypic diversity among clonal cells [33].
In an attempt to identify potential determinants of monoal-
lelic gene expression, several bioinformatic studies compared
DNA sequence properties of monoallelically versus bialleli-
cally expressed genes. These studies reproducibly found
enrichment of long interspersed nuclear element (LINE)
repeats and depletion of short interspersed nuclear element
(SINE) repeats to be associated with monoallelic gene expres-
sion [8,34-36]. Encouraged by this finding, attempts have
been made to predict - based on the genomic DNA sequence -
which genes are subject to imprinting and X-chromosome
inactivation [16,17,19]. However, the conclusiveness of these
prior studies is somewhat diminished by the fact that most of
them relied on small gene lists curated from the literature and
that none took epigenome data into account.
Here, we revisit the relationship between DNA characteristics
and monoallelic gene expression based on genome-scale
datasets, including a recent assessment of monoallelic versus
biallelic gene expression for about 4,000 genes in human
lymphoblastic cells [33] and extensive epigenome maps of
human T-cell lymphocytes [37]. To start with, we obtain a list
of monoallelically and biallelically expressed genes from the
supplementary material of the corresponding paper [33], and
we map these to a non-redundant set of RefSeq gene promot-
ers (this step is performed using Galaxy [38]). As the result,
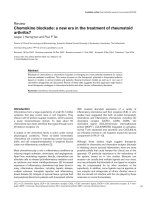
Outline of EpiGRAPH's software architectureFigure 4
Outline of EpiGRAPH's software architecture. This figure displays a schematic overview of EpiGRAPH's software components, and it describes their
interaction in a typical analysis workflow. The red numbers indicate the key component(s) for each step of the workflow description outlined in the
bottom left of the figure. JSF, Java Server Faces (which is a Java-based web application framework).
Common tasks
(use cases)
Task 1.
Define EpiGRAPH
analysis step-by-step via the
user-friendly web interface
Task 2. Inspect results of
a completed analysis and
request follow-up analyses
Task 3.
Upload and execute
a previously defined or cust-
omized EpiGRAPH analysis
Task 4. Upload custom
attribute for use in future
EpiGRAPH analyses
JSF-based user interface
provides functionality to:
Interactively define
EpiGRAPH analyses in
a step-by-step way
Browse results and
calculate diagrams
Start follow-up analyses
based on previous results
Submit and access pre-
defined XML analyses
and attributes
Log in and out, access
and manage EpiGRAPH
analyses, share results
with colleagues
Web-based interface
(frontend)
Process control
(middleware)
Analysis calculation
(backend)
Java-based middleware
implements database access
and management functions:
Provides the single point
of access to the XML
database
Saves and retrieves Epi-
GRAPH attributes and
analyses using unique
identifiers
Checks user login and
enforces access control
Keeps track of the states of
all analyses in the system
Attribute calculation
Derives new attributes
required by other module
Machine learning analysis
Derives and evaluates
prediction models
Prediction analysis
Predicts the class attri-
bute for new data
Attribute access. Encapsu-
lates access to permanent
and temporary attributes
XML database
Stores analysis descriptions,
results as well as custom
and temporary attributes
Relational database
Stores the default
genomic attributes for
maximum performance
Data storage
(database)
Job management. Controls
the execution of all analyses
by several Python modules
Analysis calculation
(backend)
XML-based
communication
Interactive
communication
SQL-based
communication
XML-based
communication
XML-based
communication
SQL-based
communication
Internal workflow of an EpiGRAPH analysis
1. The user uploads a set of genomic regions and interactively specifies an
EpiGRAPH analysis request using the web frontend
2. Based on the user input, the web frontend constructs a valid XML analysis
request file and submits it to the
middleware
3. The middleware processes the XML file
(e.g. adding unique attribute identifiers),
saves it into the XML database and notifies the backend
4. The backend job management retrieves all pending analyses from the XML
database and initiates the required attribute calculations
5. Upon completion, the attribute calculation submits its results to the middleware,
which updates the XML database
and informs the
job management
6. The job management calls any analyses that are waiting
for calculated attributes
and notifies the user by e-mail when all analyses are completed
7. The user views the results and specifies follow-up analyses by the
web frontend
1. 2. 3.
4.
5.
6.
6.
7.
Diagram generation
Draws boxplots for user-
selected attributes
6.
Statistical analysis
Performs statistical com-
parison between classes
6.
Genome Biology 2009, Volume 10, Issue 2, Article R14 Bock et al. R14.6
Genome Biology 2009, 10:R14
we obtain a total of 464 positives (monoallelically expressed
genes) as well as a substantially longer list of negatives (bial-
lelically expressed genes), from which we randomly select
464 genes to match the number of positives. Random down-
sampling of the set of negatives is performed in order to limit
bias toward predicting the majority class, which is a common
issue in machine learning. In general, we recommend that the
number of positives should never exceed twice the number of
negatives, and vice versa. EpiGRAPH automatically enforces
this upper limit for the class imbalance, unless the user dese-
lects the corresponding option.
Before we can submit our dataset to EpiGRAPH, we have to
decide exactly which regions we want to analyze, that is,
whether we expect DNA signals relating to monoallelic gene
expression distributed throughout the gene or preferentially
located in specific regions, such as promoters, exons or
introns. Since monoallelic gene expression appears to be con-
trolled by the transcriptional machinery, we believe that pro-
moter regions have the highest probability of containing
relevant regulatory elements. For the purpose of this analysis,
we define the putative promoter region as the sequence win-
dow ranging from 1,250 bp upstream to 250 bp downstream
of the annotated transcription start site. We calculate the cor-
responding region of interest for each gene in our dataset, giv-
ing rise to the input file that can be uploaded to EpiGRAPH.
However, as we cannot exclude that important regulatory ele-
ments might be located further upstream or downstream, we
activate EpiGRAPH's option to cover four additional
sequence windows ranging from -50 kilobases to +50 kilo-
bases around the region of interest.
Next, we have to decide which groups of attributes from Epi-
GRAPH's database to include in our analysis. While it is
always possible to perform hypothesis-free screening by
selecting all default attributes, focusing the analysis only on
promising attribute groups can significantly increase statisti-
cal power and also decreases computation time. Based on
prior knowledge, we choose four attribute groups that are
likely to be related to monoallelic gene expression, namely
'repetitive DNA', 'regulatory regions', 'transcriptome', and
'epigenome and chromatin structure'.
Having made all relevant decisions, we can now start the
analysis, log out of the web service and wait for EpiGRAPH to
perform the necessary calculations. Assuming that email
notification has been enabled, EpiGRAPH will inform us as
soon as it has completed an initial analysis. At that point, we
can log into the web service again, review the results and
define follow-up analyses.
Our inspection of the results starts with the statistical analysis
table (Figure 1). This table summarizes pairwise statistical
comparisons between positives and negatives, which were
performed for each attribute using Wilcoxon's rank-sum test
(for numerical attributes) and Fisher's exact test (for categor-
ical attributes). Focusing on the 1.5 kilobase core promoter
region (the main window of our analysis), a total of 72 out of
Table 1
List of default attributes included in EpiGRAPH
Total number of attributes
Attribute groups hg18 hg17 mm9 panTro2 galGal3 Attributes (examples)
DNA sequence 178 178 178 178 178 Frequency of 'TATA' pattern, cytosine content, CpG frequency
DNA structure 21 21 21 21 21 Predicted DNA helix twist, predicted solvent accessibility
Repetitive DNA 95 95 91 94 94 Overlap with Alu elements, LINEs and tandem repeats
Chromosome organization 18 29 15 - - Overlap with chromosomal bands and isochors
Evolutionary history 94 101 - - 86 Overlap with evolutionarily conserved regions
Population variation 75 75 - - - SNP density and overlap with specific SNP types
(for example, non-synonymous exonic or splice site)
Genes 37 60 20 10 10 Overlap with annotated genes, pseudogenes and predicted
microRNA genes
Regulatory regions 249 259 5 5 5 Overlap with CpG islands and predicted transcription factor binding
sites
Transcriptome 49 65 9 9 9 Overlap with ESTs and mRNA sequences
Epigenome and chromatin structure 80 17 114 - - Overlap with ChIP-seq tags indicating enrichment for specific
histone modifications
Sum 896 900 453 317 403
This table summarizes the collection of default attributes that are currently included in EpiGRAPH. Due to different degrees of annotation, the
numbers differ between the genomes of human (hg18 and hg17), mouse (mm9), chimp (panTro2) and chicken (galGal3). EST, expressed sequence tag;
SNP, single nucleotide polymorphism.
Genome Biology 2009, Volume 10, Issue 2, Article R14 Bock et al. R14.7
Genome Biology 2009, 10:R14
563 attributes differ significantly between monoallelically
and biallelically expressed genes, at a false discovery rate of
5%. Furthermore, similar but weaker differences are
observed for four additional sequence windows upstream and
downstream of the promoter region (data not shown), indi-
cating that the contrasting genomic properties of monoalleli-
cally versus biallelically expressed genes are strong for the
core promoter, but also present in a wider genomic region
surrounding the genes.
In their core promoter regions, biallelically expressed genes
exhibit, on average, twice the amount of histone H3 lysine 4
trimethylation (which is indicative of open chromatin) as the
promoters of monoallelically expressed genes. Conversely,
the latter are almost threefold enriched in terms of repressive
histone H3 lysine 27 trimethylation. Consistent with the
interpretation that promoters of monoallelically expressed
genes generally exhibit a more repressed chromatin state
than their biallelic counterparts, we also observe significant
under-representation of their associated transcripts in
expressed sequence tag (EST) libraries and decreased expres-
sion according to microarray data (Figure 1). Interestingly,
out of the 28 tissues covered by EpiGRAPH, the difference in
gene expression is most significant for thymus, consistent
with the fact that monoallelic gene expression is prominent
among genes related to the immune system.
To illustrate the distinct chromatin structure at the core pro-
moters of monoallelically versus biallelically expressed genes,
we select H3 lysine 4 trimethylation and H3 lysine 27 trimeth-
ylation for visualization using EpiGRAPH's diagram genera-
tion module (Figure 2). Boxplots confirm that the differences
are not only significant, but also substantial in quantitative
terms. This confirmation is an important first step toward
establishing the biological relevance of our finding, given that
even minor and biologically irrelevant differences can
become highly significant when sample sizes are large. In
general, to demonstrate both significance and strength of an
observed difference, we recommend that EpiGRAPH users
should report not only P-values, but also the corresponding
boxplot diagrams or at least separate mean values for the sets
of positives and negatives.
Further support for a strong association between (repressive)
chromatin structure and monoallelic gene expression comes
from EpiGRAPH's machine learning analysis. Based on the
values of 83 chromatin-related attributes measured across
the core promoter regions and four adjacent windows (415
variables in total), EpiGRAPH could predict with an accuracy
of 73.8% (sensitivity, 73.4%; specificity, 74.2%; correlation,
0.47) whether a gene is monoallelically or biallelically
expressed (Figure 3a). Substantially lower prediction per-
formance was observed for the other attribute groups, namely
repetitive DNA (accuracy, 58.3%; correlation, 0.17), regula-
tory regions (accuracy, 51.2%; correlation, 0.03) and the tran-
scriptome (accuracy, 66.5%; correlation, 0.33). We thus
conclude that attributes relating to epigenome and chromatin
structure are among the most significant predictors of
monoallelic gene expression. Importantly, all measures of
prediction performance reported by EpiGRAPH are calcu-
lated exclusively based on test set results in a cross-validation
design, thereby minimizing the risk of overtraining and irre-
producibly optimistic performance evaluations that is inher-
ent in the use of machine learning methods [39].
Due to the complex structure of mammalian genomes, the
attribute groups included in our analysis are not statistically
independent. On the contrary, strong biological interdepend-
encies exist between different attribute groups - for example,
between chromatin structure and the transcriptome (open
chromatin structure facilitates transcription), between regu-
latory regions and repetitive DNA (regulatory regions are
preferentially located in non-repetitive regions), and between
repetitive DNA and chromatin structure (repetitive regions
most commonly exhibit repressive chromatin structure).
Therefore, the predictiveness of some attribute groups
included in our analysis could be indirect and mediated by
their correlation with other, more predictive attributes. Epi-
GRAPH helps us better understand such relationships by
measuring whether any combination of two or more attribute
groups gives rise to higher prediction performance than each
attribute group on its own right (which indicates that all
attribute groups contribute to the overall prediction perform-
ance) or whether a single attribute group dominates the other
attribute groups (in which case the other attribute groups are
likely to 'borrow' predictiveness from the former, rather than
being independently predictive). To perform such an analy-
sis, we restart the machine learning analysis with custom set-
tings, requesting EpiGRAPH to account for all possible
combinations of attribute groups while focusing on the puta-
tive promoter regions (that is, ignoring the four additional
sequence windows upstream and downstream). The results
table lists prediction performance separately for linear sup-
port vectors trained on each of the 15 possible combinations
of attribute groups (Figure 3b). These data clearly indicate
that a single attribute group - epigenome and chromatin
structure - is more predictive than all others. In fact, there is
no evidence of complementarity for any combination of
attribute groups (that is, no set of attribute groups outper-
forms the single highest-scoring attribute group contained in
the set). In the light of these results, it seems unlikely that
repetitive elements are directly causal for monoallelic gene
expression, at least on a genomic scale. Rather, the predic-
tiveness of specific repetitive elements observed in prior stud-
ies as well as in this analysis appears to be largely due to the
fact that certain types of repeats (such as LINEs) are enriched
in regions that exhibit repressive chromatin structure, while
other types of repeats (such as SINEs) are depleted in such
regions.
In a final step, we want to use EpiGRAPH to predict for all
genes in the human genome whether their tendency is toward
Genome Biology 2009, Volume 10, Issue 2, Article R14 Bock et al. R14.8
Genome Biology 2009, 10:R14
monoallelic or biallelic gene expression. To that end, we first
verify that a linear support vector machine (EpiGRAPH's
default prediction algorithm) indeed provides competitive
prediction performance when compared to other machine
learning algorithms. Such benchmarking is achieved by
restarting the machine learning analysis with custom settings
and selecting all available machine learning algorithms for
inclusion (Figure 3c). EpiGRAPH's cross-validation results
indicate that linear support vector machines perform on par
with the best method, an ensemble learning algorithm (Ada-
Boost on tree stumps). We thus conclude that a linear support
vector machine trained on epigenome and chromatin struc-
ture data provides a suitable setup for genome-wide predic-
tion of monoallelic gene expression. Next, we obtain a list of
RefSeq-annotated genes from the UCSC Genome Browser,
calculate the 1.5 kilobase promoter regions for all genes and
submit this dataset to EpiGRAPH's prediction analysis. Upon
submission of the analysis, EpiGRAPH starts to calculate the
relevant attributes and predicts the expression status of all
25,419 RefSeq-annotated genes in the human genome. The
results - which are available online [30] - provide a first
genome-wide prediction of monoallelic gene expression in
the human genome. Although the accuracy of our predictions
is far from perfect (Figure 3c) and further experimental anal-
ysis is clearly warranted, these predictions could be useful for
identifying new candidate genes that contribute to the many
biological roles of monoallelic gene expression.
In summary, this case study illustrates how EpiGRAPH can
be applied to analyzing a genomic feature of interest (in this
case, monoallelic gene expression) in the context of publicly
available genome annotations and epigenome data. Two main
conclusions emerge from our analysis. First, monoallelically
expressed genes exhibit a substantially more repressed chro-
matin structure in their promoter regions than biallelically
expressed genes. This observation is consistent with a model
in which monoallelic gene expression is the direct conse-
quence of opposing chromatin states at the two alleles of a
gene within a diploid cell. Indeed, Wen et al. [40] recently
showed that an experimental search for genomic regions that
exhibit activating as well as repressive chromatin marks can
identify monoallelically expressed genes. Second, chromatin
structure clearly emerges as the strongest predictor of
monoallelic gene expression, outperforming attributes such
as the overall level of gene expression or the enrichment/
depletion of specific types of repeats and regulatory regions.
In fact, none of the other attribute groups included in our
analysis could increase prediction performance after chroma-
tin structure had been accounted for. This observation is not
necessarily in contradiction with an (indirectly) causal model
in which local enrichment of LINEs fosters repressive chro-
matin structure, which in turn facilitates random silencing of
a single allele. However, the weak predictiveness of attributes
relating to repetitive DNA suggests that such a model omits
important additional drivers of monoallelic gene expression.
Integration
EpiGRAPH integrates well with existing bioinformatics
resources and infrastructure. It can be regarded as part of a
three-step data analysis pipeline involving genome browsers,
genome calculators and tools for genome data analysis (Fig-
ure 5). First, researchers typically start the analysis of new
genome-scale datasets by uploading pre-processed and qual-
ity-controlled data into a genome browser, which facilitates
data visualization and manual inspection. The UCSC Genome
Browser [24] is popular for this task, due to the ease with
which custom data tracks can be displayed alongside public
genome annotations, and Ensembl is an alternative option
[41]. Second, based on initial observations, it is usually neces-
sary to pick a subset of genomic regions for further analysis -
for example, all promoter regions that are bound by a specific
transcription factor. The Galaxy web service [25,26] imple-
ments a wide range of calculations and filtering methods that
facilitate the selection of biologically interesting regions for
further analysis. Finally, it is often desirable to perform statis-
tical analysis and data mining on the potentially large set of
interesting regions in order to discover, test and interpret cor-
Workflow for web-based analysis of large genome and epigenome datasetsFigure 5
Workflow for web-based analysis of large genome and epigenome datasets. This figure outlines a workflow for the analysis of genome and epigenome data
using publicly available web services. Initially, the user uploads a newly generated dataset into a genome browser, which visualizes the data and facilitates
hypothesis generation by manual inspection (left box). Next, data can be processed with a genome calculator such as Galaxy, in order to extract
interesting regions for in-depth analysis (center box). Finally, genome analysis tools such as EpiGRAPH facilitate the search for significant associations with
genome annotation data and enable bioinformatic prediction of genomic regions with similar characteristics as the input dataset (right box).
Genome Browsers
Data visualization
Hypothesis generation by
manual inspection
Retrieval of genome annotations
Example: UCSC Genome Browser
Genome Analysis Tools
Data mining
Testing for statistically significant
associations
Bioinformatic prediction
Example: EpiGRAPH
Genome Calculators
Data processing
Filtering of genomic regions
Calculation of derived
attributes
Example: Galaxy
Genome Biology 2009, Volume 10, Issue 2, Article R14 Bock et al. R14.9
Genome Biology 2009, 10:R14
relations with other genomic data. For this step, a compre-
hensive and easy-to-use toolkit has been lacking. We
developed EpiGRAPH to fill this gap, thereby enabling biolo-
gists to perform advanced bioinformatic analysis and predic-
tion with little need for bioinformatic support. We
demonstrate the interplay of UCSC Genome Browser, Galaxy
and EpiGRAPH in a case study focusing on the (epi)genomic
characteristics of highly polymorphic promoter regions in the
human genome [27,28].
In the future, we anticipate that the three layers of genome
browsing, calculation and analysis tools will increasingly
merge into a single application, for which 'statistical genome
browser' might be an appropriate term. To that end, it will be
neither necessary nor beneficial to integrate all functionality
and underlying databases into a single monolithic tool.
Instead, a distributed network of interoperable web services
for genome analysis is likely to emerge. Genome browsers
could act as single points of entry, from which the user initi-
ates a complex analysis. The analysis is then split into sepa-
rate subtasks, encoded in an XML-based analysis description
language (such as the XML genomic relationship analysis for-
mat (X-GRAF) prototyped in EpiGRAPH) and distributed
over the Internet to calculation servers at which all relevant
datasets and software components for a specific type of anal-
ysis are available. Finally, the decentrally calculated results
are merged and displayed to the user at the central genome
browser front-end. EpiGRAPH was developed with this sce-
nario in mind and prototypes software paradigms required
for distributed genome analysis by concerted action of spe-
cialized tools.
Conclusion
The EpiGRAPH web service enables biologists to perform
complex bioinformatic analyses online - without having to
learn a programming language or to download and manually
process large datasets. Compared to related tools such as Gal-
axy [25,26] and Taverna [42,43], its main emphasis lies in
exploratory statistical analysis, hypothesis generation and
bioinformatic prediction, based on large datasets of genomic
regions. EpiGRAPH facilitates reproducibility and data shar-
ing by encoding all analyses in standardized analysis descrip-
tion files that can be re-run by other users. We highlighted
EpiGRAPH's utility by a case study on monoallelic gene
expression, and we provide extensive additional material
online (including tutorial videos and a step-by-step guide
[27,28]).
Methods
EpiGRAPH's software architecture and analysis
workflow
The key design decision underlying EpiGRAPH's software
architecture is to store each EpiGRAPH analysis in a single
XML file. This XML file contains not only a detailed specifica-
tion of the analysis and its supplementary attributes, but also
its current processing status and, upon completion, its
results. All XML files processed by EpiGRAPH conform to the
standardized X-GRAF format (discussed in more detail
below) and are stored in an XML database.
EpiGRAPH's XML-based, analysis-centric design offers a
number of advantages over alternative architectures, includ-
ing reproducibility, parallel processing and interoperability
and error checking. Reproducibility: all information relevant
to an analysis, including its specifications and results, are
bundled in a single file, which provides a complete documen-
tation of the analysis. The same analysis can be rerun at any
time simply by uploading its XML file back to the EpiGRAPH
web service. Parallel processing: because the different analy-
sis modules operate on different parts of the XML tree, they
can work in parallel without generating write-write conflicts.
Interoperability and error checking: the use of XML files
facilitates data exchange with other software systems, and the
X-GRAF format provides error checking when XML files are
constructed manually or exchanged between different soft-
ware systems.
Internally, the EpiGRAPH web service consists of three soft-
ware components and two logical databases (Figure 4). The
web-based front-end provides user-friendly access to Epi-
GRAPH's functionality over the internet. The front 0 end is
implemented in Java [44], utilizing the JavaServer Faces
framework for its user interface and Java servlets as well as
JavaServer Pages for operating as a web application. The
process control middleware provides a single point of access
to the analyses and custom attributes stored in the XML data-
base, and it enforces compliance with the X-GRAF XML for-
mat. The middleware is implemented as a Java servlet and
makes its services available via XML-RPC [45]. The analysis
calculation back-end performs all attribute calculations and
bioinformatic analyses required to execute an EpiGRAPH
analysis request. It submits its results to the middleware,
which stores them in the XML database. The back-end is
implemented in Python [46], using the R package [47] for sta-
tistical analysis and diagram generation, and the Weka pack-
age [48] for machine learning and prediction analysis. The
relational database stores EpiGRAPH's default attributes.
Oracle Database 11 g [49] is used with pre-calculated indices
in order to achieve high-performance database retrieval. The
XML database provides central storage of all XML files and
enables parallelized access to the XML files as a whole as well
as to specific subnodes. EpiGRAPH makes use of Oracle XML
DB [50], which is an XML database extension of the Oracle
database. Technically, Oracle XML DB decomposes all XML
files into relational database tables, based on the X-GRAF
schema definition and object-relational mapping. Hence,
while the relational database and the XML database behind
EpiGRAPH are logically distinct and used for different types
of data (default attributes versus analysis requests and cus-
Genome Biology 2009, Volume 10, Issue 2, Article R14 Bock et al. R14.10
Genome Biology 2009, 10:R14
tom attributes), both types of data are ultimately stored in the
same database management system.
Importantly, the choice of technologies for each component
reflects the specific requirements of the tasks they perform.
The front-end has to present a user-friendly interface in a
variety of web browsers, which is facilitated by a web applica-
tion framework such as JavaServer Faces. The middleware
makes connections with the XML database and performs
extensive XML processing; hence, Java, with its well-estab-
lished libraries for Oracle XML DB access [50], StAX [51] and
JAXB processing [52], is an appropriate choice. The back-end
implements most of EpiGRAPH's application logic and is
likely to be extended by other researchers, therefore Python
[46] was selected due to its proven track record for fast and
robust software engineering in scientific applications, its plat-
form independence and its wide acceptance within the bioin-
formatics community.
The internal workflow of an EpiGRAPH analysis is depicted
in Figure 4, illustrating how the different components inter-
act when fulfilling an EpiGRAPH analysis request.
Genomes, annotations and attributes included in
EpiGRAPH
EpiGRAPH currently supports five genome assemblies from
four species: hg18, the latest assembly of the human genome
(NCBI36.1); hg17, the genome assembly used for the
ENCODE project pilot phase (NCBI35); mm9, the latest
assembly of the mouse genome (NCBI37); panTro2, the latest
assembly of the chimp genome; and galGal3, the latest
assembly of the chicken genome. For each of these genomes,
we manually selected a large number of genomic attributes
that are likely to be predictive of interesting genomic phe-
nomena (see Table 1 for an overview and the attribute docu-
mentation website [29] for details). When calculated for a
specific genomic region, most of these attributes take the
form of overlap frequencies (for example, how many exons
overlap with the genomic region?), overlap lengths (for exam-
ple, how many base-pairs of exonic DNA overlap with the
genomic region?) or DNA sequence pattern frequencies (for
example, how many times does the pattern 'TATA' appear in
the genomic region?). All of these attributes are standardized
to a default region size of one kilobase in order to be compa-
rable between genomic regions of different size. In addition,
EpiGRAPH uses score attributes, which are averaged across
all overlapping regions of a specific type (for example, what is
the average exon number of all genes overlapping with the
genomic region?), and category attributes, which split up an
attribute into subattributes (for example, how many synony-
mous versus non-synonymous single nucleotide polymor-
phisms overlap with the genomic region?).
The datasets underlying most of these attributes were col-
lected from annotation tracks of the UCSC Genome Browser
[24], using an automated data retrieval pipeline. In addition,
published genomic datasets that appear to be of particular
interest are imported into the database on a regular basis.
Currently, this includes data on histone modifications [37],
DNA methylation [53,54], regulatory CpG islands [20], DNA
helix structure [55], DNA solvent accessibility [56], tissue-
specific gene expression [57], isochores [58] and transcrip-
tion initiation events [59]. Finally, users can upload custom
datasets into the database, making them available for inclu-
sion in further analyses by the same user.
Attribute calculation
The basic functionality of EpiGRAPH's attribute calculation
module is to calculate a large number of genomic attributes
(such as frequency and length of overlap with EpiGRAPH's
default attributes) for any set of genomic regions submitted to
the web service. This step is a prerequisite for all further anal-
yses, and it is typically the most computationally intensive
and time-consuming part of an EpiGRAPH analysis. The
attribute calculation makes extensive use of multithreading
in order to increase performance.
Beyond its core task of deriving hundreds or even thousands
of different attribute values for each genomic region in the
input dataset, the attribute calculation module provides three
additional features that increase its utility as a general
genome calculator. First, the user can define derived
attributes, thus augmenting genomic attributes that are
already contained in the database (for example, deriving a set
of putative promoter regions from a gene attribute). Second,
random control regions can be calculated such that they
match a given set of genomic regions in terms of chromosome
and length distribution, GC content, repeat content and/or
exon overlap. Technically, this is achieved by repeatedly sam-
pling random genomic regions of a given length from a spe-
cific chromosome and retaining a region only if its GC
content, repeat content and/or exon overlap are within a
user-specified interval around the corresponding value of the
source region. Third, attributes can be calculated not only for
the genomic regions provided in the input dataset, but also for
fixed sequence windows left and right of these regions, in
order to capture significant differences in the upstream or
downstream neighborhood of a given set of genomic regions.
All results calculated by the attribute calculation module can
be used as the basis for further EpiGRAPH analyses or down-
loaded in tab-separated value format for analysis outside Epi-
GRAPH.
Statistical analysis and diagram generation
Two of EpiGRAPH's four analytical modules - statistical anal-
ysis and diagram generation - help the user identify individ-
ual attributes that differ between two sets of genomic regions,
which we denote as 'positives' and 'negatives'. The statistical
analysis module calculates pairwise statistical tests between
the positives and negatives separately for each genomic
attribute. The nonparametric Wilcoxon rank-sum test is used
for numeric attributes and Fisher's exact test is used for dis-
Genome Biology 2009, Volume 10, Issue 2, Article R14 Bock et al. R14.11
Genome Biology 2009, 10:R14
crete attributes. P-values are adjusted for multiple testing by
the highly conservative Bonferroni method, which controls
the family-wise error rate, and by a more recent and usually
preferred method that controls the false discovery rate [60].
While EpiGRAPH applies an overall significance threshold of
5% by default, the user is free to select different values. If mul-
tiple windows around the genomic regions of interest are
taken into account and tested simultaneously, the user can
specify weights to control how the P-value threshold is dis-
tributed when testing for significant attributes in each of
these windows. A typical choice is to use a relatively high P-
value of, say, 3% for the central window (that is, the regions
provided by the input dataset), while distributing the remain-
ing 2% equally among the upstream and downstream win-
dows. This way, the additional testing for strong effects in the
upstream and downstream neighborhoods comes at the cost
of only a limited decrease in statistical power for the genomic
regions of interest.
While the statistical analysis module focuses on the question
of whether or not a specific attribute differs significantly
between the sets of positives and negatives, the diagram gen-
eration module can help assess the effect size, that is, the
quantitative difference between positives and negatives. For
any selected attribute, this module derives boxplots contrast-
ing the attribute's distribution among the positives with that
among the negatives.
Machine learning analysis and prediction analysis
In contrast to the statistical analysis module, which focuses
on individual attributes, the machine learning analysis mod-
ule assesses how well attribute groups collectively differenti-
ate between the sets of positives and negatives. We treat this
question as a machine learning task, predicting for each
genomic region whether it is likely to belong to the set of pos-
itives or to the set of negatives and interpreting the prediction
performance achieved for a specific attribute group as a meas-
ure of how well this group discriminates between positives
and negatives.
Technically, a machine learning algorithm (for example, a
support vector machine) is repeatedly trained and tested on
partitions of the training dataset following a four-step proce-
dure (all parameters mentioned below are default values and
can be changed by the user). First, if the set of positives con-
tains more than twice as many genomic regions as the set of
negatives (or vice versa), the larger set is randomly downsam-
pled such that the class imbalance never exceeds 67% versus
33%, thus limiting potential prediction bias toward the
majority class. Second, using tenfold cross-validation, the
machine learning algorithm is repeatedly trained on 90% of
the genomic regions and tested on the remaining 10%. Third,
cross-validation is repeated ten times with random partition
assignments. Fourth, the overall prediction performance is
measured by the correlation coefficient between the predic-
tions and the correct values on the cross-validation test sets,
as well as by the corresponding values for percent accuracy,
sensitivity and specificity, averaged over all cross-validation
runs.
During prediction analysis, a machine learning algorithm is
trained as described above, but now on a bootstrapped sam-
ple drawn from the entire training dataset (downsampling is
used if necessary to enforce a maximum class imbalance of
67% versus 33%). The trained prediction model is then
applied to predict the likelihood of belonging to the set of pos-
itives for all genomic regions in a user-supplied set of target
regions. The resulting quantitative prediction for each region
can assume values between zero and one, with a value of zero
corresponding to a high-confidence negative prediction, a
value of 0.5 to a borderline case, and a value of one to a high-
confidence positive prediction. This process is repeated ten
times with different bootstrapped samples in order to obtain
an additional criterion for the reliability of the predictions.
Finally, the consensus prediction, the mean confidence value
and the standard deviation of the confidence values are calcu-
lated for each genomic region and each prediction setup.
For both machine learning analysis and prediction analysis,
EpiGRAPH currently supports the use of seven different
machine learning methods/configurations: support vector
machine with linear kernel; support vector machine with RBF
kernel; AdaBoost on tree stumps; logistic regression; random
forest; C4.5 tree generator; and naïve Bayes. All of these are
implemented using functions from the Weka package [48]
with default parameters. For comparison and to give a base-
line for the expected accuracy, we also include a trivial algo-
rithm that always predicts the majority class.
X-GRAF format
Throughout EpiGRAPH's workflow (Figure 4), analyses and
custom attributes are stored in XML files. In order to stand-
ardize the format of these XML files and to facilitate interop-
erability between the front-end, middleware and back-end
components, we defined the X-GRAF format. X-GRAF con-
sists of an XML schema, against which any X-GRAF-compat-
ible XML file has to validate in order to be regarded as
syntactically correct, and a set of rules that describe the
semantic interpretation of X-GRAF-compliant XML files
(detailed documentation is available online [61]). X-GRAF-
compatible XML files can incorporate two major subtrees,
'attribute definition' and 'analysis' (an illustration is available
online [62]). The attribute definition section keeps track of
genomic attributes, which are organized in attribute groups
and can be defined by embedded tab-separated tables or by
referring to external data sources (such as a database or a
URL). The analysis section documents all analysis steps,
including attribute calculation, statistical analysis, diagram
generation, machine learning analysis and prediction analy-
sis. Each of these subsections comprises an analysis configu-
ration (a description of what is to be calculated), analysis
tracking information (for example, submission data, current
Genome Biology 2009, Volume 10, Issue 2, Article R14 Bock et al. R14.12
Genome Biology 2009, 10:R14
state and error messages) and the results of the analysis (in
the form of tables and diagrams that are directly embedded in
the XML file).
Although X-GRAF was created for EpiGRAPH, it is designed
with additional applications in mind. Being both formalized
and sufficiently easy to understand, X-GRAF may provide a
suitable basis for analysis specification, results documenta-
tion and data exchange of future genome analysis tools and
statistical genome browsers.
Adapting and extending EpiGRAPH
EpiGRAPH provides multiple options for customization,
adaptation and extension, which are outlined below in
increasing order of complexity and power.
First, it is possible to use EpiGRAPH for attribute calculation
only, thus profiting from EpiGRAPH's large and carefully
selected set of default attributes, while performing follow-up
analyses offline (for example, with the R statistics package).
To that end, the user performs a normal EpiGRAPH analysis
and presses the 'Download Data Table' button on the results
page to obtain a tab-separated data file that contains all
attribute values for all genomic regions in the input dataset.
Second, the user can add custom genomic attributes to Epi-
GRAPH, using the 'Upload Custom Attribute Dataset' button
on the overview page. A new custom attribute can be defined
in three ways: by uploading a set of genomic regions; by spec-
ifying how the attribute can be calculated from other
attributes that are already present in the database (for exam-
ple, filtering rows that match a specific condition or defining
additional columns); and by deriving a randomized control
attribute that matches an existing attribute in terms of its GC
content, repeat content and/or exon overlap. Custom
attributes can be included in EpiGRAPH analyses in the same
way as the default attributes, but they are exclusively accessi-
ble to the user who created them.
Third, the user can specify advanced analysis requests and
attribute calculations directly in EpiGRAPH's internal X-
GRAF format. Any XML file that adheres to the X-GRAF for-
mat can be uploaded through the 'Execute Analysis Based on
Existing XML File' button, bypassing the interactive 'Define
New Analysis' pages. This can be useful for several reasons:
when running the same analysis on different datasets, it is
often convenient to design the analysis once using the web
front-end, then download its specifications in X-GRAF for-
mat and use a text editor or a custom script to produce sepa-
rate versions for each dataset; sharing X-GRAF files with
other researchers (for example, by inclusion in the supple-
mentary material of a paper) will enable them to reproduce
the analysis by simply submitting the X-GRAF files back to
the EpiGRAPH web service, thus contributing to reproducible
research [63]; and some of the more advanced features (for
example, calculated attributes with multiple new columns)
are supported by the calculation engine but cannot be speci-
fied easily using the web front-end.
Fourth, the user can download a 'light' version of the Epi-
GRAPH calculation engine for local installation, which runs
on any computer with recent versions of Python [46], the R
statistics package [47] and the Weka data mining package
[48], after a few additional libraries have been installed. The
'light' version (source code available online [64]) is particu-
larly useful for researchers developing new bioinformatic
methods for genome analysis, such as new flavors of the sta-
tistical analysis, diagram generation, machine learning anal-
ysis and prediction analysis, but who do not want to spend
their time writing code for attribute calculation. The main
disadvantage of the 'light' version is that in the absence of a
relational database all genomic attributes have to be stored in
flat files. However, the 'light' version is code-compatible with
the full version of EpiGRAPH. Hence it is possible to develop
and test new modules using the 'light' version and to incorpo-
rate the completed modules into the EpiGRAPH web service.
Fifth, the user can obtain and install the full version of Epi-
GRAPH (release package and source code available on
request), which includes the process control middleware and
the web front-end components as well as a version of the cal-
culation engine that provides full database support. While
running a full-blown EpiGRAPH server locally is a non-trivial
task and requires both a Java application server (for example,
Apache Tomcat) and an Oracle 11 g database server [49], this
setting gives the user full flexibility for customizing Epi-
GRAPH and a powerful infrastructure for genome analysis.
Abbreviations
LINE: long interspersed nuclear element; SINE: short inter-
spersed nuclear element; X-GRAF: XML genomic relation-
ship analysis format.
Competing interests
The authors declare that they have no competing interests.
Authors' contributions
CB initiated the project, conceptualized the software, imple-
mented the front-end, middleware and database components
as well as an early back-end prototype, performed the case
study and drafted the paper. KH designed and implemented
a substantially enhanced version of the back-end, performed
extensive testing and contributed important ideas to all
aspects of the project. JB set up and maintained the technical
infrastructure. All authors provided relevant input at differ-
ent stages of the project and contributed to the writing of the
paper.
Genome Biology 2009, Volume 10, Issue 2, Article R14 Bock et al. R14.13
Genome Biology 2009, 10:R14
Acknowledgements
We would like to thank Jörn Walter, Martina Paulsen, Eivind Hovig and the
Galaxy team for helpful discussions, Yassen Assenov, Barbara Hutter and
Fang Liu for testing earlier versions of EpiGRAPH, and Holger Jung for con-
tributing source code to the attribute calculation module. This work was
partially funded by the European Union through the CANCERDIP project
(HEALTH-F2-2007-200620).
References
1. Bock C, Lengauer T: Computational epigenetics. Bioinformatics
2008, 24:1-10.
2. Mardis ER: The impact of next-generation sequencing tech-
nology on genetics. Trends Genet 2008, 24:133-141.
3. Bernstein BE, Meissner A, Lander ES: The mammalian epige-
nome. Cell 2007, 128:669-681.
4. Schones DE, Zhao K: Genome-wide approaches to studying
chromatin modifications. Nat Rev Genet 2008, 9:179-191.
5. van Steensel B: Mapping of genetic and epigenetic regulatory
networks using microarrays. Nat Genet 2005, 37(Suppl):S18-24.
6. Subramanian A, Kuehn H, Gould J, Tamayo P, Mesirov JP: GSEA-P:
a desktop application for gene set enrichment analysis. Bioin-
formatics 2007, 23:3251-3253.
7. Huang DW, Sherman BT, Tan Q, Collins JR, Alvord WG, Roayaei J,
Stephens R, Baseler MW, Lane HC, Lempicki RA: The DAVID gene
functional classification tool: a novel biological module-cen-
tric algorithm to functionally analyze large gene lists. Genome
Biol 2007, 8:R183.
8. Allen E, Horvath S, Tong F, Kraft P, Spiteri E, Riggs AD, Marahrens Y:
High concentrations of long interspersed nuclear element
sequence distinguish monoallelically expressed genes. Proc
Natl Acad Sci USA 2003, 100:9940-9945.
9. Berry C, Hannenhalli S, Leipzig J, Bushman FD: Selection of target
sites for mobile DNA integration in the human genome. PLoS
Comput Biol 2006, 2:e157.
10. Bock C, Paulsen M, Tierling S, Mikeska T, Lengauer T, Walter J: CpG
island methylation in human lymphocytes is highly corre-
lated with DNA sequence, repeats, and predicted DNA
structure. PLoS Genet 2006, 2:e26.
11. Cohen SM, Furey TS, Doggett NA, Kaufman DG: Genome-wide
sequence and functional analysis of early replicating DNA in
normal human fibroblasts. BMC Genomics 2006, 7:301.
12. Das R, Dimitrova N, Xuan Z, Rollins RA, Haghighi F, Edwards JR, Ju J,
Bestor TH, Zhang MQ: Computational prediction of methyla-
tion status in human genomic sequences. Proc Natl Acad Sci USA
2006, 103:10713-10716.
13. Derti A, Roth FP, Church GM, Wu CT: Mammalian ultracon-
served elements are strongly depleted among segmental
duplications and copy number variants. Nat Genet 2006,
38:1216-1220.
14. Fang F, Fan S, Zhang X, Zhang MQ: Predicting methylation status
of CpG islands in the human brain. Bioinformatics 2006,
22:2204-2209.
15. Guelen L, Pagie L, Brasset E, Meuleman W, Faza MB, Talhout W, Eus-
sen BH, de Klein A, Wessels L, de Laat W, van Steensel B: Domain
organization of human chromosomes revealed by mapping
of nuclear lamina interactions. Nature 2008, 453:948-951.
16. Luedi PP, Dietrich FS, Weidman JR, Bosko JM, Jirtle RL, Hartemink AJ:
Computational and experimental identification of novel
human imprinted genes. Genome Res 2007, 17:1723-1730.
17. Luedi PP, Hartemink AJ, Jirtle RL: Genome-wide prediction of
imprinted murine genes. Genome Res 2005, 15:875-884.
18. Montgomery SB, Griffith OL, Schuetz JM, Brooks-Wilson A, Jones SJ:
A survey of genomic properties for the detection of regula-
tory polymorphisms. PLoS Comput Biol 2007, 3:e106.
19. Wang Z, Willard HF, Mukherjee S, Furey TS: Evidence of influence
of genomic DNA sequence on human X chromosome inacti-
vation. PLoS Comput Biol 2006, 2:e113.
20. Bock C, Walter J, Paulsen M, Lengauer T: CpG island mapping by
epigenome prediction. PLoS Comput Biol 2007, 3:e110.
21. Bock C, Walter J, Paulsen M, Lengauer T: Inter-individual varia-
tion of DNA methylation and its implications for large-scale
epigenome mapping. Nucleic Acids Res 2008, 36:e55.
22. Liu F, Tostesen E, Sundet JK, Jenssen TK, Bock C, Jerstad GI, Thilly
WG, Hovig E: The human genomic melting map. PLoS Comput
Biol 2007, 3:e93.
23. Moser D, Ekawardhani S, Kumsta R, Palmason H, Bock C, Athanassi-
adou Z, Lesch KP, Meyer J:
Functional analysis of a potassium-
chloride co-transporter 3 (SLC12A6) promoter polymor-
phism leading to an additional DNA methylation site. Neu-
ropsychopharmacology 2008, 34:458-467.
24. Karolchik D, Kuhn RM, Baertsch R, Barber GP, Clawson H, Diekhans
M, Giardine B, Harte RA, Hinrichs AS, Hsu F, Kober KM, Miller W,
Pedersen JS, Pohl A, Raney BJ, Rhead B, Rosenbloom KR, Smith KE,
Stanke M, Thakkapallayil A, Trumbower H, Wang T, Zweig AS, Haus-
sler D, Kent WJ: The UCSC Genome Browser Database: 2008
update. Nucleic Acids Res 2008, 36:D773-779.
25. Blankenberg D, Taylor J, Schenck I, He J, Zhang Y, Ghent M, Veerar-
aghavan N, Albert I, Miller W, Makova KD, Hardison RC, Nekrutenko
A: A framework for collaborative analysis of ENCODE data:
making large-scale analyses biologist-friendly. Genome Res
2007, 17:960-964.
26. Giardine B, Riemer C, Hardison RC, Burhans R, Elnitski L, Shah P,
Zhang Y, Blankenberg D, Albert I, Taylor J, Miller W, Kent WJ,
Nekrutenko A: Galaxy: a platform for interactive large-scale
genome analysis. Genome Res 2005, 15:1451-1455.
27. EpiGRAPH Tutorial [ />tion/EpiGRAPH_tutorial.pdf]
28. EpiGRAPH Videos [ />29. EpiGRAPH Attribute Documentation [-
inf.mpg.de/attributes/]
30. EpiGRAPH Case Study on Monoallelic Gene Expression
[ />31. Reik W: Stability and flexibility of epigenetic gene regulation
in mammalian development. Nature 2007, 447:425-432.
32. Heard E: Recent advances in X-chromosome inactivation.
Curr Opin Cell Biol 2004, 16:247-255.
33. Gimelbrant A, Hutchinson JN, Thompson BR, Chess A: Widespread
monoallelic expression on human autosomes. Science 2007,
318:1136-1140.
34. Bailey JA, Carrel L, Chakravarti A, Eichler EE: Molecular evidence
for a relationship between LINE-1 elements and X chromo-
some inactivation: the Lyon repeat hypothesis. Proc Natl Acad
Sci USA 2000, 97:6634-6639.
35. Greally JM: Short interspersed transposable elements (SINEs)
are excluded from imprinted regions in the human genome.
Proc Natl Acad Sci USA 2002, 99:327-332.
36. Ke X, Thomas NS, Robinson DO, Collins A: A novel approach for
identifying candidate imprinted genes through sequence
analysis of imprinted and control genes. Hum Genet 2002,
111:511-520.
37. Barski A, Cuddapah S, Cui K, Roh TY, Schones DE, Wang Z, Wei G,
Chepelev I, Zhao K: High-resolution profiling of histone meth-
ylations in the human genome. Cell 2007, 129:823-837.
38. Galaxy Genome Analysis Website [ />39. Tarca AL, Carey VJ, Chen XW, Romero R, Draghici S: Machine
learning and its applications to biology. PLoS Comput Biol 2007,
3:e116.
40. Wen B, Wu H, Bjornsson H, Green RD, Irizarry R, Feinberg AP:
Overlapping euchromatin/heterochromatin-associated
marks are enriched in imprinted gene regions and predict
allele-specific modification. Genome Res 2008, 18:1806-1813.
41. Flicek P, Aken BL, Beal K, Ballester B, Caccamo M, Chen Y, Clarke L,
Coates G, Cunningham F, Cutts T, Down T, Dyer SC, Eyre T, Fitzger-
ald S, Fernandez-Banet J, Gräf S, Haider S, Hammond M, Holland R,
Howe KL, Howe K, Johnson N, Jenkinson A, Kähäri A, Keefe D,
Kokocinski F, Kulesha E, Lawson D, Longden I, Megy K, Meidl P, et al.:
Ensembl 2008. Nucleic Acids Res 2008, 36:D707-714.
42. Hull D, Wolstencroft K, Stevens R, Goble C, Pocock MR, Li P, Oinn
T: Taverna: a tool for building and running workflows of serv-
ices. Nucleic Acids Res 2006, 34:W729-732.
43. Oinn T, Addis M, Ferris J, Marvin D, Senger M, Greenwood M, Carver
T, Glover K, Pocock MR, Wipat A, Li P: Taverna: a tool for the
composition and enactment of bioinformatics workflows.
Bioinformatics 2004, 20:3045-3054.
44. Java [ />45. XML-RPC [ />46. Python Programming Language [ />47. R Project for Statistical Computing [ />48. Weka Data Mining [ />49. Oracle Database [ />50. Oracle XML DB [ />xmldb/index.html]
51. Streaming API for XML [ /> Genome Biology 2009, Volume 10, Issue 2, Article R14 Bock et al. R14.14
Genome Biology 2009, 10:R14
52. Java Architecture for XML Binding [ />53. Meissner A, Mikkelsen TS, Gu H, Wernig M, Hanna J, Sivachenko A,
Zhang X, Bernstein BE, Nusbaum C, Jaffe DB, Gnirke A, Jaenisch R,
Lander ES: Genome-scale DNA methylation maps of pluripo-
tent and differentiated cells. Nature 2008, 454:766-770.
54. Rollins RA, Haghighi F, Edwards JR, Das R, Zhang MQ, Ju J, Bestor TH:
Large-scale structure of genomic methylation patterns.
Genome Res 2006, 16:157-163.
55. Gardiner EJ, Hunter CA, Packer MJ, Palmer DS, Willett P: Sequence-
dependent DNA structure: a database of octamer structural
parameters. J Mol Biol 2003, 332:1025-1035.
56. Greenbaum JA, Pang B, Tullius TD: Construction of a genome-
scale structural map at single-nucleotide resolution. Genome
Res 2007, 17:947-953.
57. Su AI, Wiltshire T, Batalov S, Lapp H, Ching KA, Block D, Zhang J,
Soden R, Hayakawa M, Kreiman G, Cooke MP, Walker JR, Hogenesch
JB: A gene atlas of the mouse and human protein-encoding
transcriptomes. Proc Natl Acad Sci USA 2004, 101:6062-6067.
58. Costantini M, Clay O, Auletta F, Bernardi G: An isochore map of
human chromosomes. Genome Res 2006, 16:536-541.
59. Carninci P, Sandelin A, Lenhard B, Katayama S, Shimokawa K, Ponjavic
J, Semple CA, Taylor MS, Engström PG, Frith MC, Forrest AR, Alkema
WB, Tan SL, Plessy C, Kodzius R, Ravasi T, Kasukawa T, Fukuda S,
Kanamori-Katayama M, Kitazume Y, Kawaji H, Kai C, Nakamura M,
Konno H, Nakano K, Mottagui-Tabar S, Arner P, Chesi A, Gustincich
S, Persichetti F, et al.: Genome-wide analysis of mammalian
promoter architecture and evolution. Nat Genet 2006,
38:626-635.
60. Benjamini Y, Hochberg Y: Controlling the false discovery rate: a
practical and powerful approach to multiple testing. J R Statist
Soc B 1995, 57:289-300.
61. X-GRAF XML Format Documentation [-
inf.mpg.de/xml/]
62.
Illustration of the X-GRAF File Format [-
inf.mpg.de/documentation/X-GRAF_Format_Illustration.pdf]
63. Gentleman R: Reproducible research: a bioinformatics case
study. Stat Appl Genet Mol Biol 2005, 4:.
64. EpiGRAPH Source Code [ />code/]