Báo cáo y học: "Improved base calling for the Illumina Genome Analyzer using machine learning strategies" pps
Bạn đang xem bản rút gọn của tài liệu. Xem và tải ngay bản đầy đủ của tài liệu tại đây (224.09 KB, 9 trang )
Genome Biology 2009, 10:R83
Open Access
2009Kircheret al.Volume 10, Issue 8, Article R83
Software
Improved base calling for the Illumina Genome Analyzer using
machine learning strategies
Martin Kircher, Udo Stenzel and Janet Kelso
Address: Department of Evolutionary Genetics, Max Planck Institute for Evolutionary Anthropology, Deutscher Platz, 04103 Leipzig, Germany.
Correspondence: Janet Kelso. Email:
© 2009 Kircher et al.; licensee BioMed Central Ltd.
This is an open access article distributed under the terms of the Creative Commons Attribution License ( which
permits unrestricted use, distribution, and reproduction in any medium, provided the original work is properly cited.
Ibis<p>Ibis is an accurate, fast and easy-to-use base caller for the Illumina Genome Analyzer that reduces error rates and increases output of usable reads.</p>
Abstract
The Illumina Genome Analyzer generates millions of short sequencing reads. We present Ibis
(Improved base identification system), an accurate, fast and easy-to-use base caller that significantly
reduces the error rate and increases the output of usable reads. Ibis is faster and more robust with
respect to chemistry and technology than other publicly available packages. Ibis is freely available
under the GPL from />Rationale
Recent advances in high-throughput sequencing have revolu-
tionized genomics, making it possible for even single research
groups to generate large amounts of sequence data very rap-
idly and at substantially lower costs than traditional Sanger
sequencing. This puts the ability to perform deep transcrip-
tome sequencing and transcript quantification, whole
genome sequencing and resequencing into the hands of many
more researchers. However, while cost and time have been
greatly reduced, the error profiles of next-generation plat-
forms differ significantly to those of previous approaches. By
addressing this issue, the number of sequences and the qual-
ity of the data can be optimized.
The Illumina Genome Analyzer is based on parallel, fluores-
cence-based readout of millions of immobilized sequences
that are iteratively sequenced using reversible terminator
chemistry [1]. In brief, up to eight DNA libraries are hybrid-
ized to an eight-lane flow cell. In each of the lanes, single-
stranded library molecules hybridize to complementary oli-
gos that are covalently bound to the flow cell surface. Using
the double stranded duplex, the reverse strand of each library
molecule is synthesized and the now covalently bound mole-
cule is then further amplified in a process called bridge ampli-
fication. This generates clusters each containing more than
1,000 copies of the starting molecule. One strand is then
selectively removed, free ends are subsequently blocked and
a sequencing primer is annealed onto the adapter sequences
of the cluster molecules.
Starting from the sequencing primers, 3' terminated and flu-
orescence-labeled nucleotides are incorporated using a mod-
ified polymerase. Base incorporation ceases after the addition
of a single base due to the 3' termination of the incorporated
nucleotides. The fluorophores attached to the nucleotides are
illuminated using a red and a green laser, and imaged through
different filters, yielding four images per tile. The number of
tiles varies; for Genome Analyzer I it is typically 300 tiles per
lane, for Genome Analyzer II it is 100 tiles per lane. After an
imaging cycle, the fluorescent labels as well as the 3' termina-
tors are chemically removed and the next incorporation cycle
is started. Incorporation and imaging cycles are repeated up
to a designated number of cycles, defining the read length for
all clusters.
Published: 14 August 2009
Genome Biology 2009, 10:R83 (doi:10.1186/gb-2009-10-8-r83)
Received: 9 April 2009
Revised: 9 July 2009
Accepted: 14 August 2009
The electronic version of this article is the complete one and can be
found online at /> Genome Biology 2009, Volume 10, Issue 8, Article R83 Kircher et al. R83.2
Genome Biology 2009, 10:R83
After sequencing, images are analyzed and intensities
extracted for each cluster. The Illumina base caller, Bustard,
has to handle two effects of the four intensity values extracted
for each cycle and cluster: first, a strong correlation of the A
and C intensities as well as of the G and T intensities due to
similar emission spectra of the fluorophores and limited sep-
aration by the filters used; and second, dependence of the sig-
nal for a specific cycle on the signal of the cycles before and
after, known as phasing and pre-phasing, respectively. Phas-
ing and pre-phasing are caused by incomplete removal of the
3' terminators and fluorophores, sequences in the cluster
missing an incorporation cycle, as well as by the incorpora-
tion of nucleotides without effective 3' terminators. Phasing
and pre-phasing cause the extracted intensities for a specific
cycle to consist of the signal of the current cycle as well as
noise from the preceding and following cycles. As the number
of cycles increases, the fraction of sequences per cluster
affected by phasing increases, hampering the identification of
the correct base.
Technical improvements in the filters and camera of the
Genome Analyzer II have helped with distinguishing the A
and C as well as G and T fluorophores. Phasing and pre-phas-
ing was addressed by an improvement of the sequencing
chemistry kit that became publically available in the late sum-
mer of 2008. This new sequencing chemistry preparation
(order numbers FC-204-20xx) reduced the phasing rates
determined by Bustard from, on average, 0.8% per cycle to
0.5%, and pre-phasing from 0.6% to 0.4% per cycle. In 2009,
Illumina introduced a new chemistry (FC-103-300x) and fur-
ther updates are expected within the year. Both improve-
ments reduced the overall error rate and allow more
sequencing cycles. Here, we present an improvement for the
base calling on the Illumina Genome Analyzer platform that
can be used for all versions of the Genome Analyzer platforms
and chemistries to further decrease the overall error rate.
Two publications [2,3] addressed the base calling of the Illu-
mina platform, both using statistical learners trained on
sequences called by the standard base caller, Bustard. Statis-
tical learners, also called machine-learning approaches,
describe a wide range of mathematical models and algorithms
used to extract patterns and rules from huge data sets. In gen-
eral, statistical learning can facilitate a better understanding
of the basics underlying data or can be applied for predicting
both qualitative (that is, discrete labels) and quantitative
descriptors (that is, values out of a continuous range) from
data. In this context, base calling can be seen as predicting
discrete labels, finding the correct nucleotide label given the
intensity values observed for a specific cycle (that is, a four-
class classification problem).
Erlich et al. [2] published AltaCyclic, the first machine-learn-
ing based approach to base calling for the Genome Analyzer.
Their approach applies support vector machines (SVMs)
trained for each individual cycle. Rolexa [3], a base caller for
the statistical software package R [4], applies Gaussian mix-
ture models, similar to the approach used by Cokus et al. [5]
for the analysis of bisulphite sequencing data. The two base
callers differ further in that Rolexa generates ambiguity codes
for potential erroneous base calls, while AltaCyclic produces
unambiguous bases with quality scores.
We present Ibis (Improved base identification system), an
accurate, fast and easy-to-use base caller for the Illumina
sequencing system, which aims to significantly reduce the
error rate and increase the output of usable reads. Our goal is
to provide sequences with a lower number of base calling
errors and better quality scores with each base. This will facil-
itate quality filtering of the data, sequence read mapping, de
novo assembly and further data analysis like single nucleotide
polymorphism (SNP) calling.
Results
Intensity files and the Illumina standard base caller
Briefly described before, the Genome Analyzer takes four
images per tile and cycle during the sequencing run. The
image analysis software of the IPAR (Integrated Primary
Analysis and Reporting) machine, the RTA (Real Time Anal-
ysis) software or the Firecrest program of the Analysis Pipe-
line registers the four images, which are slightly scaled and
shifted due to the different filters used, and identifies the
clusters in the images. The images are then further registered
between cycles and the intensity values extracted from the
four images for each of the clusters identified. This results in
four floating point numbers per clusters and cycle. A cluster is
identified by the quadruple of lane number, tile number and
x-y coordinates of the cluster in the superimposed reference
image. Depending on the image analysis software (IPAR,
Firecrest, RTA) the created output files vary, but otherwise
provide the same input for the base calling process.
As shown previously [2,3], the intensities of the A and C chan-
nels are highly correlated as are those of the G and T channels
due to similar emission spectra of the fluorophores used for A
and C and G and T. In order to separate these channels and
normalize their individual intensities, the Illumina base caller
(Bustard) uses a so-called crosstalk matrix estimated from
the first or second imaging cycle. This estimate, however, is
based on the assumption that the four nucleotides are almost
equally frequent at each sequence position in the library being
sequenced. If this assumption is violated, the inaccurate esti-
mates can lead to incorrect base calling. To prevent this, the
crosstalk matrix is commonly estimated using a control lane
in which a variant of PhiX 174 (GC content of 44.7%) is
sequenced. This PhiX variant RF1 also allows for different
quality control measures, and is therefore widely used as con-
trol lane to track run quality and to facilitate base calling.
Bustard estimates the phasing and pre-phasing as two chan-
nel-independent parameters from the increasing correlation
Genome Biology 2009, Volume 10, Issue 8, Article R83 Kircher et al. R83.3
Genome Biology 2009, 10:R83
of intensities in the first few cycles of the sequencing run.
Using the crosstalk matrix and the two phasing parameters,
Bustard creates corrected intensity values and calls the base
with the highest corrected intensity for each cluster and cycle.
In the case of equal intensity values or small intensity differ-
ences an 'N' is called. Further, a trust value is assigned to each
intensity value. If a FastQ file is created, the trust value of the
called base is transformed to an ASCII character (using an off-
set of 64).
The Bustard base calling process described here is based on
two additional assumptions: first, that the crosstalk matrix
can be considered constant over the run; and second, that
phasing affects all nucleotides in the same way. Erlich et al.
[2] have previously shown that this first assumption is vio-
lated. Another argument for this is the commonly observed
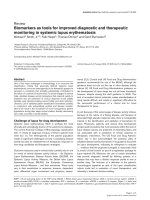
decrease in intensities over the course of the run (Figure 1).
This is likely to be a result of degradation of the fluorophores,
or the effect of a decreasing number of sequences being elon-
gated in each cluster when nucleotides for which the termina-
tion cannot be removed are incorporated (as also suggested
by Erlich et al. [2]). Further, we see that phasing does not
affect all nucleotides equally. With the chemistries FC-104-
100x or FC-204-20xx, the fluorophores used for thymine
show a lower removal rate after treatment with TCEP (tris-(2-
carboxyethyl)-phosphine) [1] and accumulate over the
sequencing run (T accumulation; Figures 1 and 2).
The effects of crosstalk, declining intensities, pre-phasing and
phasing, as well as T accumulation complicate the identifica-
tion of the correct base, especially in later sequencing cycles.
When mapping raw reads of PhiX 174 RF1 sequenced with 51
cycles, 79.4% map to the corresponding reference genome
allowing up to 5 mismatches. Only 39.8% map without any
mismatches. Analyzing the different types of mismatches, we
observe a non-random distribution (Figure 2a). Starting
around cycle 25, guanine is increasingly confused with thym-
ine (illuminated using the same laser); in later cycles adenos-
ine and cytosine show also a high rate of erroneous thymine
calls due to increasing T accumulation. The error rate of the
first base is especially high due to the higher handling time
when starting the sequencing run (for example, focusing and
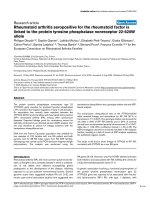
Intensity values for one tile of a 51-cycle PhiX 174 RF1 run before and after correction by BustardFigure 1
Intensity values for one tile of a 51-cycle PhiX 174 RF1 run before and after correction by Bustard. On this tile 115,288 clusters were
identified by the image analysis software Firecrest. Shown are the 95
th
percentile for the signal intensities in each channel and cycle. The raw intensities are
shown with dashed lines, the intensities after transformation by Bustard are shown with solid lines. Intensities for A, C, and G decline over the run while
the intensities for T stay nearly constant. Both effects can be explained by degradation of the fluorophores or non-reversible termination of sequences
over the run as well as the accumulation of T fluorophores on the synthesized strand. Intensities for the first cycle are lower than in other cycles due to
dimming and bleaching caused by longer handling times before imaging of the first cycle. Corrected intensities for the last and first cycle do not follow the
normal trend, since full phasing correction cannot be applied.
cycle run
0 1020304050
600 800 1,000
Cycle number
95th percentile intensity value
Developing of intensity values for one tile with 115, 288 clusters in a 51-
Raw
Bustard
A
C
G
T
Genome Biology 2009, Volume 10, Issue 8, Article R83 Kircher et al. R83.4
Genome Biology 2009, 10:R83
first cycle report); the last base is especially high due to the
inability to correct phasing completely.
Statistical learner for Illumina base calling
When designing a base caller that can cope with the cycle-
dependent problems discussed above, we considered con-
structing a more complex model of the sequencing chemistry
than is currently available in Bustard - including T accumula-
tion, declining intensities and the specific characteristics of
the first and last cycle. All currently available base callers fol-
low this general approach, although the complexity of the
model and the modeled parameters differ. However, this
approach has two major disadvantages. First, building a cor-
rect model for the Illumina sequencing platform requires a
deep understanding of the causes for sequencing error and is
likely to be incomplete. Secondly, a sufficiently complex
model will depend on the chemistry or platform version used
and has to be adjusted when either one changes. We instead
chose to estimate the sequencing chemistry model as a
parameter directly from the data using statistical learners and
a training data set derived from the Bustard output.
Previous approaches [2,3] corrected raw intensities prior to
the application of the statistical learner and used only the
intensities of one cycle as input. This causes these approaches
to be highly dependent on a correct modeling, or at least very
good modeling, of the sequencing process. We bypassed this
problem by directly basing our training on the raw cluster
intensities. To identify the correct number of cycles as input
for the statistical learner, we first simulated clusters of a thou-
sand sequences and the fluorophore attachment over several
sequencing cycles using the model of the sequencing process
described above with pre-phasing, phasing and T accumula-
tion. We used a symmetric phasing and pre-phasing rate of
0.4% and a T accumulation rate of 3.8% per cycle (for a
detailed description see Additional data file 1).
Simulating up to 150 cycles, we observed that, for a typical
read length of 50 cycles, 59.5% of the fluorophores reflect the
current cycle, 17.4% are exactly one cycle behind and the same
fraction is one cycle ahead, and 33.9% of the measured cluster
intensity is caused by T accumulation. Even after 150 cycles,
85.1% of the fluorophores account for the previous, the cur-
rent or the next base to be sequenced (Figure S2 and Table S2
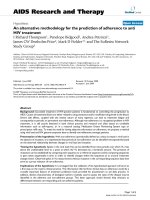
Analysis of mismatchesFigure 2
Analysis of mismatches. Analysis of mismatches seen for (a) Bustard raw reads and (b) Ibis raw reads of a lane with 11,478,043 PhiX 174 RF1 raw
reads sequenced with 51 cycles and mapped to the corresponding reference genome allowing up to 5 mismatches (including N characters). For Bustard
9,110,666 (79.4%) raw reads can be mapped, and for Ibis 9,695,354 (84.5%) raw reads. The sequencing error, measured as the mismatch rate, increases
with cycle number. For Bustard, starting around cycle 25, guanine is mistaken as thymine. In later cycles adenosine and cytosine are also mistaken as
thymine, due to increasing T accumulation. The error rate of the last base is especially high due to incomplete phasing correction. The patterns of specific
base mismatches are not observed when Ibis is used.
0 10203040500 1020304050
0.00 0.01 0.02 0.03
Position in read
Mismatch rate
A/C
A/G
A/T
C/A
C/G
C/T
G/A
G/C
G/T
T/A
T/C
T/G
N
(a) (b)
Mismatches to PhiX reference sequence by substitution (51nt GAII)
Genome Biology 2009, Volume 10, Issue 8, Article R83 Kircher et al. R83.5
Genome Biology 2009, 10:R83
in Additional data file 1). From this simulation, we conclude
that most of the signal to be captured by a statistical learner is
contained in the raw intensities of the previous, the current
and the next cycle.
We therefore implemented a base caller with SVM classifiers
for each cycle that have the intensity values of the current
cycle and its two neighbors as input. The exceptions are the
first and last cycle, where we can only include one of the
neighbors. For the SVM classifiers of each cycle, we use a
computationally fast implementation of multiclass SVMs
with polynomial kernels, called SVM
multiclass
[6]. A putative
training data set is created by aligning the Bustard raw reads
with mismatches for a fraction of the tiles to an appropriate
reference sequence (for example, PhiX 174 RF1) using SOAP
[7]. We keep half of this data set as a test data set and use the
other half for training the classifiers separating all four nucle-
otide classes (A, C, G, and T) in each cycle.
We verify the result of the training by using the test data set
with the trained models and comparing the predicted labels
with the ones obtained from the reference sequence. Evaluat-
ing this information, we can also estimate parameters for cal-
culating a quality score for each called base given the class
assignment and the distances to the classification/decision
boundary reported by SVM
multiclass
. Based on this measure,
we use the density distributions for the four distances to the
decision boundary seen for each correct class label (16 in
total, each following a normal distribution based on Shapiro
Wilk Normality test). Given the four distances d
Z
(z
∈
{A, C,
G, T}) and the parameters estimated from the test data set, we
define the likelihood of the called base being wrong as:
We extended the SVM
multiclass
C/C++ package by routines that
are able to handle several classifiers in parallel for the individ-
ual cycles, parse Firecrest, RTA and IPAR output files, calcu-
late quality scores and create Sanger-like (using an offset of
33) FastQ output files. Applying this approach to the lane
shown in Figure 2a increases the number of perfectly mapped
sequences from 39.8% to 60.2% (from 4,564,039 to
6,908,856) and shows an error profile of all mapped
sequences (9,695,354 out of 11,478,043) as depicted in Figure
2b.
Discussion
Other systems for base calling
Applying statistical learning for the base calling of Illumina
sequences is not novel. However, Ibis differs significantly in
its concept and its performance. AltaCyclic [2] uses a model of
phasing/pre-phasing, fluorescent decay and cycle-dependent
crosstalk to correct raw intensities before classification, using
SVM classifiers trained individually for every cycle. The Alta-
Cyclic model does not include base-specific phasing parame-
ters and, therefore, cannot correct raw intensities for the
observed T accumulation effect. Similarly, the Rolexa pack-
age [3] corrects the raw intensities prior to the application of
Gaussian mixture models as classifiers. In contrast to the
models of sequencing chemistry implemented in AltaCyclic,
Rolexa models only crosstalk and single-parameter phasing
(pre-phasing is not modeled). In contrast to AltaCyclic, Bus-
tard and Ibis, Rolexa applies a transformation to the intensi-
ties within each tile to correct for differences in the
illumination of clusters. Further Rolexa uses IUPAC ambigu-
ity codes to encode uncertainty in base calling, while AltaCy-
clic, Bustard and Ibis try to call one correct base and reflect
the associated uncertainty in the quality scores. The latter
approach is superior when the sequences are mapped and
analyzed with software that is unable to handle ambiguity
codes (like most currently available fast mappers or SNP call-
ing software). Unlike AltaCyclic and Bustard, Ibis does not
call an 'N' character for low quality bases, as the most likely
base can still be informative and the uncertainty is already
captured in the quality score.
Performance test
The difference in introducing IUPAC ambiguity codes com-
plicates the direct comparison of AltaCyclic, Bustard, Ibis and
Rolexa. We therefore forced Rolexa to call sequences without
using ambiguity codes, and we specifically consider 'N' char-
acters for a direct comparison. We tested the performance of
the four different base callers on five data sets of which we
present two data sets in the main text and the others in Addi-
tional data file 1: a 26 cycle Genome Analyzer I run of which
we analyzed the PhiX control lane (A1) and one lane with
human shotgun sequences (A2); and a 51 cycle Genome Ana-
lyzer II run of which we only analyzed the PhiX control lane
(B). For lanes A1 and B we mapped all control lane sequences
to the PhiX reference sequence allowing up to five mis-
matches but no gaps using SOAP v1.11 [7]. For the lane with
human shotgun sequences (A2), we mapped the sequences to
the human reference genome (hg18/NCBI Build 36.1) allow-
ing five mismatches without any gaps. However, for this data
set we restricted the further analysis to sequences mapping
with at most two mismatches to reduce the number of false
positive placements expected when using a genome with
almost three billion bases and short reads.
The fraction of mapped raw reads and corresponding number
of mismatches for the three lanes is shown in Figure 3. The
number of correct reads when using Ibis compared to Bustard
increased about 2.1-fold in A1 (11.3% to 23.4%), 1.8-fold in A2
(21.2% to 37.4%), and 1.5-fold in C (39.8% to 60.2%). When
comparing the error profiles in B (Figure 2), we see that Ibis
was able to correct for the T accumulation pattern seen in Fig-
ure 1. Assuming that all reads belong to the corresponding
reference, we can give a (lower) estimate of the error rate in
the run (assuming the remaining reads would be matched
when allowing one more mismatch). For A1 these are 15.2%,
pbase
pZbase
Zbase
pZbase
ZACGT
pZbase()
()
()
,,,
()¬=
≠
∑
∈
{}
∑
with ==∧ ⋅pZ base cdf d
ZZZ
()(,,)
μσ
Genome Biology 2009, Volume 10, Issue 8, Article R83 Kircher et al. R83.6
Genome Biology 2009, 10:R83
16.4%, 12.3% and 16.0% for AltaCyclic, Bustard, Ibis and Rol-
exa, respectively. For A2 (assuming to match the rest with 3
mismatches) these are 7.1%, 7.6%, 5.5%, and 7.4%. In the
third lane (B), the 51 cycle PhiX control, the error rate is much
lower (due to the better quality of the run as well as technical
improvements of the Genome Analyzer II instrument and
chemistry); the rates for AltaCyclic, Bustard, Ibis and Rolexa
are 3.0%, 4.0%, 2.8% and 4.3%, respectively. The develop-
ment of the mismatch rates per cycle observed in the mapping
for each of the three other data sets is available in Additional
data file 1. Summarizing the results of all five data sets, Ibis
outperforms the other programs in base calling accuracy.
Similarly, we see improved performance of Ibis over other
base callers when comparing the performance of Bustard,
AltaCyclic and Ibis for longer Genome Analyzer II runs (76, 77
and 101 cycles) using different chemistries (Figures S6, S7
and S8 in Additional data file 1, respectively).
For B, we also compared the quality scores reported by Bus-
tard, Alta-Cyclic and Ibis. While Ibis provides PHRED-like
quality scores, Bustard and AltaCyclic use the Illumina-spe-
cific encoding of quality scores with a different offset and a
different formula (Illumina Analysis Pipeline 1.0 and earlier
versions). Therefore, quality scores from AltaCyclic and Bus-
tard were converted to PHRED-like quality scores and com-
pared in PHRED scale. The results are available in Figure 4.
When measuring the deviation from the optimal line, Bustard
has a root mean square deviation of 84.9, AltaCyclic of 19.3
and Ibis of 0.9. Hence, Ibis provides useful quality scores for
further analyses.
As is the case for Bustard, AltaCyclic and Rolexa, the results
of A1 and A2 support the assumption that training on the
PhiX extends well to the prediction of other lanes using the
same estimated models. To further verify this, we also tested
with several other sequencing runs (Figures S7 and S8 in
Additional data file 1) and did a specific test for overtraining
(for example, learning base composition) and undertraining
on PhiX for another 51 cycle run (data not shown). We trained
several models from the PhiX lane using different numbers of
tiles for training and predicted with the resulting models the
PhiX lane as well as one of the other lanes. We then examined
Fraction of mapped reads and corresponding number of mismatches for the three tested lanesFigure 3
Fraction of mapped reads and corresponding number of mismatches for the three tested lanes. (a) The result for one lane of human shot
gun sequence analyzed on a 26 cycle Genome Analyzer I run (A1); (b) the PhiX control lane of the very same 26 cycle Genome Analyzer I run (A2); (c)
the PhiX control lane of a 51 cycle Genome Analyzer II (B). The raw sequences of all three lanes were mapped to the corresponding reference genome
(hg18/NCBI Build 36.1 and PhiX 174 RF1) with up to five mismatches but no gaps using SOAP v1.11. For A1, further analyses were restricted to sequences
mapping with at most two mismatches to reduce the number false positive placements expected when mapping short reads to a large genome sequence.
Bustard Rolexa AltaCyclic Ibis
Fraction mapped raw reads
0.0 0.2 0.4
0.6 0.8 1.0
not mapped
5 mismachtes
4 mismatches
3 mismatches
2 mismatches
1 mismatch
0 mismatches
Bustard Rolexa AltaCyclic Ibis Bustard Rolexa AltaCyclic Ibis
PhiX control (51nt GAII)PhiX control (26nt GAI)Human (26nt GAI)
not mapped
5 mismachtes
4 mismatches
3 mismatches
2 mismatches
1 mismatch
0 mismatches
Not mapped
5 mismatches
4 mismatches
3 mismatches
2 mismatches
1 mismatch
0 mismatches
(a) (b) (c)
Genome Biology 2009, Volume 10, Issue 8, Article R83 Kircher et al. R83.7
Genome Biology 2009, 10:R83
the number of sequences mapped to the two different refer-
ence genomes and the number of mismatches observed. We
found no evidence for overtraining; however, we did observe
undertraining affecting the prediction of both lanes. In our
test, undertraining resulted in 3 to 5% fewer perfect reads and
only up to 1% less mappable raw reads than obtained when
using at least 1,000,000 sequences for training (about 10 to
15 tiles).
To compare the computational resources required for base
calling, we measured the time for training and predicting the
51 cycle PhiX control lane (B) with each of the base callers.
Base calling this lane using Bustard on an eight core system
took 50 minutes (including estimation of crosstalk and phas-
ing parameters) and created the input needed for all three
other base callers. AltaCyclic needs a cluster system to run.
Using about 80 cores of our cluster system, AltaCyclic took
about 5.5 hours for the parameter estimation and 40 minutes
for the base calling. On an eight core system these would cor-
respond to at most 61 hours in total. Running Rolexa on an
eight core machine took 17.5 hours. Ibis took 89 minutes for
parameter estimation and 12 minutes for prediction, in total
about 1.7 hours. In other words, using Ibis one has to invest
three times more time for base calling, for Rolexa 21-fold
more time and for AltaCyclic 73-fold more time compared to
Bustard.
Ibis is not dependent on the inclusion of the PhiX control
lane. In the case of resequencing projects or projects where
some subset of the sequences generated comes from a previ-
ously characterized genome (for example, mitochondrial
sequences) it is possible to use these data as a training dataset
for Ibis. We have shown that it is possible to use the mito-
chondrial sequences generated as part of a shotgun sequenc-
ing experiment as an alternative training set (Figures S7 and
S8 in Additional data file 1). Further, the raw Bustard output
can be used as training data in cases where there is no refer-
ence set available (Additional data file 1), although the reduc-
tion in error rate is less than can be obtained when a reference
is available.
Further applications
Even though Ibis was originally developed to handle the T
accumulation in a sequencing chemistry that has been
replaced by a new version (FC-103-300x), its application is
not limited to the reprocessing of data created with the older
chemistries (FC-104-100x or FC-204-20xx). We have shown
that Ibis improves the output of sequencing runs from the
Genome Analyzer I, which due to their short read length are
barely affected by T accumulation but by a generally lower
image and sequencing quality. The reason is the sequencing
model independent training process of Ibis, which only relies
on the assumption that the vast majority of the signal needed
for base calling is captured by the intensity values of the pre-
vious, the current and the next cycle. When using Ibis on data
from experiments with the new sequencing chemistry (data
shown in Additional data file 1), we also observe an improve-
ment in base calling accuracy over Bustard. We are confident,
therefore, that there is a benefit in investing a little more com-
putational time in re-base-calling sequencing runs of all
chemistry and Genome Analyzer versions.
Conclusions
We were able to show that Ibis improves base calling accuracy
compared to other Illumina base callers. Our approach is
unique in that the causes of sequencing error are not modeled
separately, but captured by incorporating neighboring signals
in the statistical learning procedure. Due to this design, Ibis
works on a wide range of different sequencing chemistries
and platform versions. The performance of Ibis on standard
hardware is significantly better than existing base callers,
enabling it to be run by research laboratories without access
to large computational clusters. The increase in mappable
sequences, without ambiguity codes and improved quality
scores, enables direct use of the sequences in other software
packages. Ongoing development of the chemistry and hard-
ware of the Illumina next-generation sequencing platforms
will undoubtedly mean increases in read length and quality.
We believe that our general approach will be applicable to fur-
ther generations of the Illumina platform and provide
improvements in sequence quality and confidence measures
required for applications such as SNP calling and assembly.
Comparison of quality scores for the 51 cycle PhiX control lane dataFigure 4
Comparison of quality scores for the 51 cycle PhiX control lane
data. Quality scores reported by Bustard, AltaCyclic and Ibis are
compared in PHRED scale. For all three base callers, we considered only
quality scores reported with 100,000 and more observations. Calculating
the deviation from the optimal line, Bustard has a root mean square
deviation of 84.9, AltaCyclic of 19.3 and Ibis of 0.9.
Reported vs. observed quality scores
0 10203040
010203040
PHRED score reported by base caller
PHRED score in mapping
Bustard
AltaCyclic
Ibi s
Genome Biology 2009, Volume 10, Issue 8, Article R83 Kircher et al. R83.8
Genome Biology 2009, 10:R83
Materials and methods
Sequencing
Sequencing was performed on Genome Analyzer I and
Genome Analyzer II machines. Where not stated otherwise,
standard protocols and kits available from Illumina, Inc. [1]
were used for library preparation and sequencing. In the case
of the runs with 51 and 77 bases, shorter sequencing protocol
files for Genome Analyzer II available from Illumina, Inc. [1]
were extended by duplication of cycles up to the designated
number of cycles. In the case of the 51 cycle run, one 36 cycle
sequencing kit (FC-104-1003) was prepared to yield the vol-
ume needed for 51 cycles. For the 77 cycle run, two 36 cycle
sequencing kits (FC-204-2036) were pooled to yield the vol-
ume needed, and for the 76 cycle run two 36 cycle sequencing
kits (FC-103-3003) were used. For the 101 cycle run, three 36
cycle sequencing kits (FC-103-3003) and a new polymerase
provided by Illumina within an early access program were
used.
Ibis base caller
Ibis applies the SVM
multiclass
package by Thorsten Joachims,
which is an implementation of multi-class SVMs described by
Crammer et al. [8]. As described in the main text, we added
routines for processing IPAR, Firecrest and RTA files,
extracting training and test data sets, training models for each
individual cycle, fitting an error model to the test data and
applying the trained models to the intensity files of each indi-
vidual tile of the sequencing run. Ibis has been tested on Illu-
mina pipeline versions 0.3.0, 1.0, 1.3.2 and 1.4.0.
The training and test data sets are created based on mapping
sequences extracted from the Bustard base caller (for the 26
cycle and 51 cycle data sets presented, Bustard v1.9.5; for the
77 cycle data set, Bustard v1.3.2; and for the 76 and 101 cycle
runs, Bustard v1.4.0) to a reference genome using SOAP v1.11
[7]. For each mapped sequence, we consider the sequence of
the reference to be the correct one. For each cycle/position of
the read, one SVM multiclass model is trained using
svm_multiclass_learn. After training, the misclassification
rate of each model and class is assessed using the test data set
and svm_multiclass_classify. The models are then applied to
the data of the complete run using a custom C++ interface to
the SVM
multiclass
package. For each cluster in the intensity files
an entry in a FastQ file is created, containing the sequence
and PHRED-like quality scores [9] in the Sanger encoding
(with a quality score offset of 33).
Other base callers
In addition to the Illumina standard base caller Bustard
v1.9.5, we used AltaCyclic v0.1.1 and Rolexa v1.1.6 (with R
v2.8.0). Standard parameters were used where applicable.
For Rolexa three parameters were set to turn off ambiguity
codes: Rolexa.env$HThresholds <- c(2.0,2.0,2.0); Rol-
exa.env$IThresholds <- (log2(41:nrcycles/6)); Rol-
exa.env$iupac <- c("A", "C", "G", "T", "N", "N", "N", "N", "N",
"N", "N", "N", "N", "N").
AltaCyclic and Bustard quality scores were converted to
PHRED-like quality scores by back calculating the probably P
= 1/(1 + pow(10, Q
S
/10)) from the reported quality scores and
PHRED log transformation Q
P
= ROUND(-10*log
10
(p)).
Abbreviations
GA: Genome Analyzer; Ibis: Improved base identification
system; IPAR: Integrated Primary Analysis and Reporting;
nt: nucleotide; RTA: Real Time Analysis; SNP: single nucle-
otide polymorphism; SVM: support vector machine.
Authors' contributions
Programming and analyses were performed by MK with input
by US and JK. The manuscript was written by MK and JK. All
authors read and approved the final manuscript.
Additional data files
The following additional data are available with the online
version of this paper: a PDF document containing all addi-
tional supplementary figures (Figures S1 to S8) and Tables
(Tables S1 to S2) (Additional data file 1).
Additional data file 1Figures S1 to S8 and Tables S1 to S2Figures S1 to S8 and Tables S1 to S2.Click here for file
Acknowledgements
We thank Knut Finstermeier for suggesting the current name of the pro-
gram, Patricia Heyn, Kay Prüfer, Knut Finstermeier, Mathias Stiller, Ed
Green and the members of the Evolutionary Genetics group for helpful dis-
cussions and suggestions. Further we thank the MPI-EVA sequencing group,
all those who provided Illumina data for analysis, and Thorsten Joachims for
providing the SVM
multiclass
package. The project was funded by a grant of the
Max Plank Society.
References
1. Bentley DR, Balasubramanian S, Swerdlow HP, Smith GP, Milton J,
Brown CG, Hall KP, Evers DJ, Barnes CL, Bignell HR, Boutell JM, Bry-
ant J, Carter RJ, Keira Cheetham R, Cox AJ, Ellis DJ, Flatbush MR,
Gormley NA, Humphray SJ, Irving LJ, Karbelashvili MS, Kirk SM, Li H,
Liu X, Maisinger KS, Murray LJ, Obradovic B, Ost T, Parkinson ML,
Pratt MR, et al.: Accurate whole human genome sequencing
using reversible terminator chemistry. Nature 2008,
456:53-59.
2. Erlich Y, Mitra PP, delaBastide M, McCombie WR, Hannon GJ: Alta-
Cyclic: a self-optimizing base caller for next-generation
sequencing. Nat Methods 2008, 5:679-682.
3. Rougemont J, Amzallag A, Iseli C, Farinelli L, Xenarios I, Naef F: Prob-
abilistic base calling of Solexa sequencing data. BMC Bioinfor-
matics 2008, 9:431.
4. R Development Core Team: R: A Language and Environment for Statis-
tical Computing Vienna, Austria: R Foundation for Statistical Comput-
ing; 2008.
5. Cokus SJ, Feng S, Zhang X, Chen Z, Merriman B, Haudenschild CD,
Pradhan S, Nelson SF, Pellegrini M, Jacobsen SE: Shotgun bisulphite
sequencing of the Arabidopsis genome reveals DNA methyl-
ation patterning. Nature 2008, 452:215-219.
6. Tsochantaridis I, Joachims T, Hofmann T, Altun Y: Large margin
methods for structured and interdependent output varia-
bles. J Machine Learning Res 2006, 6:1453.
7. Li R, Li Y, Kristiansen K, Wang J: SOAP: short oligonucleotide
alignment program. Bioinformatics 2008, 24:713-714.
8. Crammer K, Singer Y: On the algorithmic implementation of
multiclass kernel-based vector machines. J Machine Learning
Res 2002, 2:265-292.
Genome Biology 2009, Volume 10, Issue 8, Article R83 Kircher et al. R83.9
Genome Biology 2009, 10:R83
9. Ewing B, Green P: Base-calling of automated sequencer traces
using phred. II. Error probabilities. Genome Res 1998,
8:186-194.