advances in Investment Analysis and Portfolio Management phần 3 docx
Bạn đang xem bản rút gọn của tài liệu. Xem và tải ngay bản đầy đủ của tài liệu tại đây (242.55 KB, 16 trang )
Investment Analysis and Portfolio Management
34
But both holding period returns and sample mean of returns are calculated
using historical data. However what happened in the past for the investor is not as
important as what happens in the future, because all the investors‘decisions are
focused to the future, or to expected results from the investments. Of course, no one
investor knows the future, but he/ she can use past information and the historical data
as well as to use his knowledge and practical experience to make some estimates about
it. Analyzing each particular investment vehicle possibilities to earn income in the
future investor must think about several „scenarios“ of probable changes in macro
economy, industry and company which could influence asset prices ant rate of return.
Theoretically it could be a series of discrete possible rates of return in the future for the
same asset with the different probabilities of earning the particular rate of return. But
for the same asset the sum of all probabilities of these rates of returns must be equal to
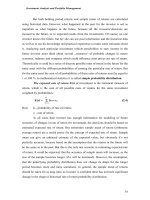
1 or 100 %. In mathematical statistics it is called simple probability distribution.
The expected rate of return E(r) of investment is the statistical measure of
return, which is the sum of all possible rates of returns for the same investment
weighted by probabilities:
n
E(r) = ∑
∑∑
∑ h
i
×
××
× r
i
, (2.4)
i = 1
Here h
i
- probability of rate of return;
r
i
- rate of return.
In all cases than investor has enough information for modeling of future
scenarios of changes in rate of return for investment, the decisions should be based on
estimated expected rate of return. But sometimes sample mean of return (arithmetic
average return) are a useful proxy for the concept of expected rate of return. Sample
mean can give an unbiased estimate of the expected value, but obviously it‘s not
perfectly accurate, because based on the assumption that the returns in the future will
be the same as in the past. But this is the only one scenario in estimating expected rate
of return. It could be expected, that the accuracy of sample mean will increase, as the
size of the sample becomes longer (if n will be increased). However, the assumption,
that the underlying probability distribution does not change its shape for the longer
period becomes more and more unrealistic. In general, the sample mean of returns
should be taken for as long time, as investor is confident there has not been significant
change in the shape of historical rate of return probability distribution.
Investment Analysis and Portfolio Management
35
2.1.2. Investment risk
Risk can be defined as a chance that the actual outcome from an investment
will differ from the expected outcome. Obvious, that most investors are concerned that
the actual outcome will be less than the expected outcome. The more variable the
possible outcomes that can occur, the greater the risk. Risk is associated with the
dispersion in the likely outcome. And dispersion refers to variability. So, the total risk
of investments can be measured with such common absolute measures used in
statistics as
• variance;
• standard deviation.
Variance can be calculated as a potential deviation of each possible investment
rate of return from the expected rate of return:
n
δ
δδ
δ²(r) = ∑
∑∑
∑ h
i
×
××
× [
[[
[ r
i
- E
(r)
]
]]
]²
(2.5)
i=1
To compute the variance in formula 2.5 all the rates of returns which were
observed in estimating expected rate of return (r
i
) have to be taken together with their
probabilities of appearance (h
i).
The other an equivalent to variance measure of the total risk is standard
deviation which is calculated as the square root of the variance:
______________
δ
δδ
δ(r) = √ ∑
∑∑
∑ h
i
×
××
×[r
i
- E
(r)
]² (2.6)
In the cases than the arithmetic average return or sample mean of the returns
(ř) is used instead of expected rate of return, sample variance (δ
δδ
δ²
r )
can be calculated:
n
∑
∑∑
∑ (r
t
- ř) ²
t=1
δ
δδ
δ²
r
= (2.7)
n– 1
Sample standard deviation (δ
δδ
δ
r
) consequently can be calculated as the square
root of the sample variance:
____
δ
δδ
δ
r
=
√
δ
δδ
δ²
r
(2.8)
Investment Analysis and Portfolio Management
36
Variance and the standard deviation are similar measures of risk and can be
used for the same purposes in investment analysis; however, standard deviation in
practice is used more often.
Variance and standard deviation are used when investor is focused on
estimating total risk that could be expected in the defined period in the future. Sample
variance and sample standard deviation are more often used when investor evaluates
total risk of his /her investments during historical period – this is important in
investment portfolio management.
2.2. Relationship between risk and return
The expected rate of return and the variance or standard deviation provide
investor with information about the nature of the probability distribution associated
with a single asset. However all these numbers are only the characteristics of return
and risk of the particular asset. But how does one asset having some specific trade-off
between return and risk influence the other one with the different characteristics of
return and risk in the same portfolio? And what could be the influence of this
relationship to the investor’s portfolio? The answers to these questions are of great
importance for the investor when forming his/ her diversified portfolio. The statistics
that can provide the investor with the information to answer these questions are
covariance and correlation coefficient. Covariance and correlation are related and they
generally measure the same phenomenon – the relationship between two variables.
Both concepts are best understood by looking at the math behind them.
2.2.1. Covariance
Two methods of covariance estimation can be used: the sample covariance
and the population covariance.
The sample covariance is estimated than the investor hasn‘t enough
information about the underlying probability distributions for the returns of two assets
and then the sample of historical returns is used.
Sample covariance between two assets - A and B is defined in the next
formula (2.9):
n
Investment Analysis and Portfolio Management
37
∑
∑∑
∑ [( r
A,t
- ŕ
A
) ×
××
× ( r
B,t
- ŕ
B
)]
t=1
Cov (ŕ
A
, ŕ
B
) = , (2.9)
n – 1
here r
A,t ,
r
B,t
- consequently, rate of return for assets A and B in the time period t,
when t varies from 1 to n;
ŕ
A,
ŕ
B -
sample mean of rate of returns for assets A and B consequently.
As can be understood from the formula, a number of sample covariance can
range from “–” to “+” infinity. Though, the covariance number doesn’t tell the
investor much about the relationship between the returns on the two assets if only this
pair of assets in the portfolio is analysed. It is difficult to conclud if the relationship
between returns of two assets (A and B) is strong or weak, taking into account the
absolute number of the sample variance. However, what is very important using the
covariance for measuring relationship between two assets – the identification of the
direction of this relationship. Positive number of covariance shows that rates of return
of two assets are moving to the same direction: when return on asset A is above its
mean of return (positive), the other asset B is tend to be the same (positive) and vice
versa: when the rate of return of asset A is negative or bellow its mean of return, the
returns of other asset tend to be negative too. Negative number of covariance shows
that rates of return of two assets are moving in the contrariwise directions: when return
on asset A is above its mean of return (positive), the returns of the other asset - B is
tend to be the negative and vice versa. Though, in analyzing relationship between the
assets in the same portfolio using covariance for portfolio formation it is important to
identify which of the three possible outcomes exists:
positive covariance (“+”),
negative covariance (“-”) or
zero covariance (“0”).
If the positive covariance between two assets is identified the common
recommendation for the investor would be not to put both of these assets to the same
portfolio, because their returns move in the same direction and the risk in portfolio will
be not diversified.
If the negative covariance between the pair of assets is identified the common
recommendation for the investor would be to include both of these assets to the
Investment Analysis and Portfolio Management
38
portfolio, because their returns move in the contrariwise directions and the risk in
portfolio could be diversified or decreased.
If the zero covariance between two assets is identified it means that there is no
relationship between the rates of return of two assets. The assets could be included in
the same portfolio, but it is rare case in practice and usually covariance tends to be
positive or negative.
For the investors using the sample covariance as one of the initial steps in
analyzing potential assets to put in the portfolio the graphical method instead of
analytical one (using formula 2.9) could be a good alternative. In figures 2.1, 2.2 and
2.3 the identification of positive, negative and zero covariances is demonstrated in
graphical way. In all these figures the horizontal axis shows the rates of return on asset
A and vertical axis shows the rates of return on asset B. When the sample mean of
return for both assets is calculated from historical data given, the all area of possible
historical rates of return can be divided into four sections (I, II, III and IV) on the basis
of the mean returns of two assets (ŕ
A,
ŕ
B
consequently). In I section both asset A and
asset B have the positive rates of returns above their means of return; in section II the
results are negative for asset A and positive for asset B; in section III the results of
both assets are negative – below their meansof return and in section IV the results are
positive for asset A and negative for asset B.
When the historical rates of return of two assets known for the investor are
marked in the area formed by axes ŕ
A,
ŕ
B,
it is very easy to identify what kind of
relationship between two assets exists simply by calculating the number of
observations in each:
if the number of observations
in sections I and III prevails over the
number of observations in sections II and IV, the covariance between two
assets is positive (“+”);
if the number of observations
in sections II and IV prevails over the
number of observations in sections I and III, the covariance between two
assets is negative(“-”);
if the number of observations
in sections I and III equals the number
of observations in sections II and IV, there is the zero covariance between
two assets (“0”).
Investment Analysis and Portfolio Management
39
Figure 2.1. Relationship between two assets: positive covariance.
Figure 2.2. Relationship between two assets: negative covariance.
Figure 2.3. Relationship between two assets: zero covariance.
Rate of return
on security B
2
1
IV
r
A
II
I
III
Rate of return on security A
r
A
r
B
4
5
3
r
B
IV
r
B
Rate of return
on security B
r
A
II
I
II
Rate of return
on security A
r
A
r
B
IV
r
B
Rate of return
on security B
r
A
II
I
II
Rate of return
on security A
r
A
r
B
Investment Analysis and Portfolio Management
40
The population covariance is estimated when the investor has enough
information about the underlying probability distributions for the returns of two assets
and can identify the actual probabilities of various pairs of the returns for two assets at
the same time.
The population covariance between stocks A and B:
m
Cov (r
A
, r
B
) = ∑
∑∑
∑ h
i
×
××
× [
[[
[r
A,i
- E(r
A
) ]
]]
] ×
××
× [
[[
[r
B,i
- E(r
B
)]
]]
]
(2.10)
i=1
Similar to using the sample covariance, in the population covariance case the
graphical method can be used for the identification of the direction of the relationship
between two assets. But the graphical presentation of data in this case is more
complicated because three dimensions must be used (including the probability).
Despite of it, if investor observes that more pairs of returns are in the sections I and III
than in II and IV, the population covariance will be positive, if the pairs of return in II
and IV prevails over I and III, the population covariance is negative.
2.2.2. Correlation and Coefficient of determination.
Correlation is the degree of relationship between two variables.
The correlation coefficient between two assets is closely related to their
covariance. The correlation coefficient between two assets A and B (k
AB
) can be
calculated using the next formula:
Cov(r
A
,r
B
)
k
A,B
= , (2.11)
δ
δδ
δ (r
A
) ×
××
× δ
δδ
δ(r
B
)
here δ (r
A
) and δ(r
B
) are standard deviation for asset A and B consequently.
Very important, that instead of covariance when the calculated number is
unbounded, the correlation coefficient can range only from -1,0 to +1,0. The more
close the absolute meaning of the correlation coefficient to 1,0, the stronger the
relationship between the returns of two assets. Two variables are perfectly positively
correlated if correlation coefficient is +1,0, that means that the returns of two assets
have a perfect positive linear relationship to each other (see Fig. 2.4), and perfectly
negatively correlated if correlation coefficient is -1,0, that means the asset returns
have a perfect inverse linear relationship to each other (see Fig. 2.5). But most often
correlation between assets returns is imperfect (see Fig. 2.6). When correlation
coefficient equals 0, there is no linear relationship between the returns on the two
Investment Analysis and Portfolio Management
41
assets (see Fig. 2.7). Combining two assets with zero correlation with each other
reduces the risk of the portfolio. While a zero correlation between two assets returns
is better than positive correlation, it does not provide the risk reduction results of a
negative correlation coefficient.
Fig. 2.4. Perfect positive correlation Fig. 2.5. Perfect negative correlation
between returns of two assets. between returns of two assets.
.
Fig. 2.6. Imperfect positive correlation Fig. 2.7. Zero correlation between
between returns on two assets. returns on two assets.
r
B
r
A
r
B
r
A
r
B
r
A
r
B
r
A
Investment Analysis and Portfolio Management
42
It can be useful to note, that when investor knows correlation coefficient, the
covariance between stocks A and B can be estimated, because standard deviations of
the assets’ rates of return will already are available:
Cov(r
A
, r
B
) = k
A,B
×
××
× δ
δδ
δ(r
A
) ×
××
× δ
δδ
δ (r
B
) (2.12)
Therefore, as it was pointed out earlier, the covariance primarily provides
information to the investor about whether the relationship between asset returns is
positive, negative or zero, because simply observing the number itself without any
context with which to compare the number, is not very useful. When the covariance is
positive, the correlation coefficient will be also positive, when the covariance is
negative, the correlation coefficient will be also negative. But using correlation
coefficients instead of covariance investor can immediately asses the degree of
relationship between assets returns.
The coefficient of determination (Det.
AB
) is calculated as the square of
correlation coefficient:
Det.
A, B
= k²
A,B
(2.13)
The coefficient of determination shows how much variability in the returns of
one asset can be associated with variability in the returns of the other. For example, if
correlation coefficient between returns of two assets is estimated + 0,80, the coefficient
of determination will be 0,64. The interpretation of this number for the investor is that
approximately 64 percent of the variability in the returns of one asset can be explained
by the returns of the other asset. If the returns on two assets are perfect correlated, the
coefficient of determination will be equal to 100 %, and this means that in such a case
if investor knows what will be the changes in returns of one asset he / she could predict
exactly the return of the other asset.
2.3. Relationship between the returns on stock and market portfolio
When picking the relevant assets to the investment portfolio on the basis of
their risk and return characteristics and the assessment of the relationship of their
returns investor must consider to the fact that these assets are traded in the market.
How could the changes in the market influence the returns of the assets in the
investor’s portfolio? What is the relationship between the returns on an asset and
returns in the whole market (market portfolio)? These questions need to be answered
Investment Analysis and Portfolio Management
43
when investing in any investment environment. The statistics can be explored to
answer these questions as well.
2.3.1. The characteristic line and the Beta factor
Before examining the relationship between a specific asset and the market
portfolio the concept of “market portfolio” needs to be defined. Theoretical
interpretation of the market portfolio is that it involves every single risky asset in the
global economic system, and contains each asset in proportion to the total market value
of that asset relative to the total value of all other assets (value weighted portfolio). But
going from conceptual to practical approach - how to measure the return of the market
portfolio in such a broad its understanding - the market index for this purpose can be
used. Investors can think of the market portfolio as the ultimate market index. And if
the investor following his/her investment policy makes the decision to invest, for
example, only in stocks, the market portfolio practically can be presented by one of the
available representative indexes in particular stock exchange.
The most often the relationship between the asset return and market portfolio
return is demonstrated and examined using the common stocks as assets, but the same
concept can be used analyzing bonds, or any other assets. With the given historical
data about the returns on the particular common stock (r
J
) and market index return (r
M
)
in the same periods of time investor can draw the stock’s characteristic line (see Fig.
2.8.).
Figure 2.8. Stock’s J characteristic line.
2
1
Rate of return
on security J
Rate of return on market portfolio
r
M
4
5
3
Y
X
A
J
Ε
J,3
= r
J,3
– (A
J
+ β
J
r
M,3
)
r
J
β
J
= y/x =slope
Investment Analysis and Portfolio Management
44
Stock’s characteristic line:
describes the relationship between the stock and the market;
shows the return investor expect the stock to produce, given that a
particular rate of return appears for the market;
helps to assess the risk characteristics of one stock relative to the market.
Stock’s characteristic line as a straight line can be described by its slope and
by point in which it crosses the vertical axis - intercept (point A in Fig. 2.8.).
The slope of the characteristic line is called the Beta factor. Beta factor for
the stock J and can be calculated using following formula:
Cov (r
J,
r
M
)
β
ββ
β
J
= , (2.14)
δ
δδ
δ²(r
M)
here: Cov(r
J
,r
M
) – covariance between returns of stock J and the market portfolio;
δ²(r
M)
- variance of returns on market portfolio.
The Beta factor of the stock is an indicator of the degree to which the stock
reacts to the changes in the returns of the market portfolio. The Beta gives the answer
to the investor how much the stock return will change when the market return will
change by 1 percent. Further in Chapter 3 the use of Beta factor in developing capital
asset pricing model will be discussed.
Intercept A
J
(the point where characteristic line passes through the vertical
axis) can be calculated using following formula:
A
J
= r
J
- β
ββ
β
J
×
××
× r
M,
(2.15)
here: r
J
- rate of return of stock J;
β
J -
Beta factor for the stock J;
r
M -
rate of return of the market.
The intercept technically is a convenient point for drawing a characteristic line.
The interpretation of the intercept from the investor’s point of view is that it shows
what would be the rate of return of the stock, if the rate of return in the market is zero.
2.3.2. Residual variance
The characteristic line is a line-of-best-fit through some data points. A
characteristic line is what in statistics is called as time-series regression line. But in
Investment Analysis and Portfolio Management
45
reality the stock produce returns that deviate from the characteristic line (see Fig. 2.8).
In statistics this propensity is called the residual variance.
Residual variance is the variance in the stock’s residuals and for the stock J
can be calculated using formula:
n
Σ ε
εε
ε²
J,t
t =1
δ
δδ
δ²ε
εε
ε,t = , (2.15)
n - 2
here ε
J,t
- residual of the stock J in period t;
n - number of periods observed.
To calculate residual variance the residual in every period of observations
must be identified. Residual is the vertical distance between the point which reflect
the pair of returns (stock J and market) and the characteristic line of stock J. The
residual of the stock J can be calculated:
ε
εε
ε
J,t
= r
J,t
- ( A
J
+ β
ββ
β
J
×
××
× r
M
,
t
) (2.16)
c.1 c.2
It is useful for the interpretation of residual to investor to accentuate two
components in formula of residual (see 2.16):
• Component 1 reflects the return actually generated by the stock J during
period t;
• Component 2 (in the bracket) represents investor’s expectations for the
stock’s return, given its characteristic line and market’s returns.
Note the difference between the variance and the residual variance:
The variance describes the deviation of the asset returns from its expected
value ;
The residual variance describes the deviation of the asset returns from its
characteristic line.
Summary
1. The main characteristics of any investment are investment return and risk.
However to compare various alternatives of investments the precise quantitative
measures for both of these characteristics are needed.
2. General definition of return is the benefit associated with an investment. Many
investments have two components of their measurable return: (1) a capital gain or
Investment Analysis and Portfolio Management
46
loss; (2) some form of income. The holding period return is the percentage increase
in returns associated with the holding period.
3. Investor can‘t compare the alternative investments using holding period returns, if
their holding periods (investment periods) are different. In these cases arithmetic
average return or sample mean of the returns can be used.
4. Both holding period returns and sample mean of returns are calculated using
historical data. However all the investors’ decisions are focused to the future, or to
expected results from the investments. The expected rate of return of investment is
the statistical measure of return, which is the sum of all possible rates of returns for
the same investment weighted by probabilities.
5. Risk can be defined as a chance that the actual outcome from an investment will
differ from the expected outcome. The total risk of investments can be measured
with such common absolute measures used in statistics as variance and standard
deviation. Variance can be calculated as a potential deviation of each possible
investment rate of return from the expected rate of return. Standard deviation is
calculated as the square root of the variance. The more variable the possible
outcomes that can occur, the greater the risk.
6. In the cases than the arithmetic average return or sample mean of the returns is
used instead of expected rate of return, sample variance and sample standard
deviation is calculated.
7. Covariance and correlation coefficient are used to answer the question, what is the
relationship between the returns on different assets. Covariance and correlation
coefficient are related and they generally measure the same phenomenon – the
relationship between two variables.
8. The sample covariance is estimated than the investor hasn‘t enough information
about the underlying probability distributions for the returns of two assets and then
the sample of historical returns is used. The population covariance is estimated
when the investor has enough information about the underlying probability
distributions for the returns of two assets and can identify the actual probabilities
of various pairs of the returns for two assets at the same time.
9. Analyzing relationship between the assets in the same portfolio using covariance
for portfolio formation it is important to identify which of the three possible
outcomes exists: positive covariance, negative covariance or zero covariance. If the
Investment Analysis and Portfolio Management
47
positive covariance between two assets is identified the common recommendation
for the investor would be not to put both of these assets to the same portfolio,
because their returns move in the same direction and the risk in portfolio will be
not diversified; if the negative - the common recommendation for the investor
would be to include both of these assets to the portfolio, because their returns move
in the contrariwise directions and the risk in portfolio could be diversified; if the
zero covariance - it means that there is no relationship between the rates of return
of two assets.
10. The correlation coefficient between two assets is closely related to their
covariance. But instead of covariance when the calculated number is unbounded,
the correlation coefficient can range only from -1,0 to +1,0. The more close the
absolute meaning of the correlation coefficient to 1,0, the stronger the relationship
between the returns of two assets. Using correlation coefficients instead of
covariance investor can immediately asses the degree of relationship between
assets returns.
11. The coefficient of determination is calculated as the square of correlation
coefficient and shows how much variability in the returns of one asset can be
associated with variability in the returns of the other.
12. Theoretical interpretation of the market portfolio is that it involves every single
risky asset in the global economic system, and contains each asset in proportion to
the total market value of that asset relative to the total value of all other assets
(value weighted portfolio). Investors can think of the market portfolio as the
ultimate market index.
13. Stock’s characteristic line describes the relationship between the stock and the
market, shows the return investor expect the stock to produce, given that a
particular rate of return appears for the market and helps to assess the risk
characteristics of one stock relative to the market.
14. The slope of the characteristic line is called the Beta factor. The Beta factor of the
stock is an indicator of the degree to which the stock reacts to the changes in the
returns of the market portfolio.
15. The intercept is the point where characteristic line passes through the vertical axis.
The interpretation of the intercept from the investor’s point of view is that it shows
Investment Analysis and Portfolio Management
48
what would be the rate of return of the stock, if the rate of return in the market is
zero.
16. The residual variance describes the deviation of the asset returns from its
characteristic line.
Key-terms
• Beta factor
• Characteristic line
• Coefficient of correlation
• Coefficient of determination
• Correlation
• Covariance
• Expected rate of return
• Holding period return
• Intercept
• Investment risk
• Market portfolio
• Population covariance
• Probability
• Residual
• Residual variance
• Return on investment
• Sample mean of return
• Sample standard deviation
• Sample covariance
• Sample variance
• Simple probability distribution
• Standard deviation
• Variance
Questions and problems
1. Comment why methods and tools of the statistics are so important in investment
decision making.
2. Distinguish between historical returns and expected returns.
3. Define the components of holding period return. Can any of these components be
negative?
4. When should the sample mean of return be used instead of expected rate of return?
5. What does a probability distribution describe?
6. What does covariance measure? If two assets are said to have positive covariance,
what does it mean?
7. Explain, why doesn’t an estimated absolute covariance number tell the investor
much about the relationship between the returns on the two assets?
8. How do you understand an investment risk and what statistic tools can be used to
measure it?
Investment Analysis and Portfolio Management
49
9. What is the interpretation of the coefficient of determination for the investor? If the
coefficient of correlation for two securities is 0,7, what is the coefficient of
determination?
10. Describe the Beta factor.
11. What does the characteristic line tells to investor? Why stock characteristic lines
are different for the securities traded in the same market?
12. With which of stock’s characteristic line definitions presented below you disagree?
a) Stock’s characteristic line describes the relationship between the stock
and the market;
b) Stock’s characteristic line shows the return investor expect the stock to
produce, given that a particular rate of return appears for the market;
c) Stock’s characteristic line describes the relationship between rate of
return of any two different stocks in the market;
d) I agree with all definitions presented above.
13. Refer to the following information on joint stock returns for stock 1, 2, and 3 in
the table
Probability Return for stock
Stock 1 Stock 2 Stock 3
0.20 0.20 0.25 0.10
0.30 -0.05 0.10 0.05
0.25 0.10 0.05 0
0.25 0 -0.10 -0.05
If you must choose only two stocks to your investment portfolio, what would be
your choise?
a) stocks 1 and 2; b) stocks 1 and 3; c) stocks 2 and 3; d) other decision.
Present your arguments and calculations, to explain your decision.
14. Refer to the following observations for stock A and the market portfolio in the
table:
Rate of return Month
Stock A Market portfolio
1 0,30 0,12
2 0.24 0,08
3 -0,04 -0,10
4 0,10 -0,02
5 0,06 0,08
6 0,10 0,07