Social network analysis
Bạn đang xem bản rút gọn của tài liệu. Xem và tải ngay bản đầy đủ của tài liệu tại đây (1.92 MB, 44 trang )
~1~
Abstract
Social network analysis is one of the most active topics in the central of
research nowadays. It has been widely used in various domains such as
sociology, biology, economics, as well as information science.
From the very early start, researchers used the concept of centrality to
analyze networks. In 1948, Bavelas [14] proposed the idea of centrality as applied
to human communication. He was specifically concerned with communication in
small groups and hypothesized a relationship between structural centrality and
influence in group processes.
For years, it has been agreed that centrality is an important structural factor
of social networks, and many measures of centrality have been proposed,
including four widely used measures: degree centrality, betweenness centrality,
closeness centrality, and eigenvector centrality [34].
The Web is an example of social network, references from page to page
create a hyperlink structure of the internet. The most interesting application of
analyzing this network is information retrieval system (or search engine). After
crawling web pages to a local store, we create a network based on the links
between the pages, and then compute the quality of each page, which is called
static rank. The static rank helps information retrieval systems to return more
relevant results to a query. PageRank and HITS are the two most widely used
algorithms in today search engines to calculate the static rank.
Besides, social networking sites, known as blog in another word, have
become more and more popular. These sites have its own properties that
challenge traditional search engines in some context, such as users searching for
users, which we have to find all users that have the shortest path to the user
~2~
issuing the query [23]. It is also possible to apply PageRank to blog search, but
with some modification to fit the blog’s properties.
Recently, several local search engines have appeared in Vietnam, including
xalo, 7sac, baamboo, socbay, headvances, etc, but only three o of them, xalo, bamboo
and headvances, have blog search, and none uses any link-based ranking
algorithm to improve their ranking.
We consider that there is a link between two bloggers if one of them left a
comment on the other. More precisely, we model these relations as a network
with nodes are bloggers and ties are “commenting” relations. If blogger A left n
comments on blogger B, we construct two corresponding nodes A and B, and a
directional tie from A to B with the weight n. We have modified the PageRank
algorithm to take the weight of tie into account, which calculate the static rank of
each blogger more precisely.
~3~
Acknowledgement
I would like to thank my supervisors, Assoc. Prof. Dr Ha Quang Thuy and
Ms. Nguyen Thu Trang at College of Technology, VNUH, for all their
understanding, supports and encouragements that help me finish this thesis.
I also want to thank my colleagues at Tinh Van Media for all their helps,
especially Mr. Pham Thuc Truong Luong and Mr. Nguyen Quan Son for allowing
me doing experiments with their search platform.
My last words are to thank my dear friends, who always beside me,
encourage me and spend time proofreading the manuscript.
~4~
Contents
Abstract 1
Acknowledgement 3
List of Figures 5
Chapter 1 6
Introduction to Social Network 6
1. Social network 6
2. Network construction 8
3. Network representation 10
4. A brief introduction of graph theory 12
5. Social network’s characteristics 14
6. Social network analysis – SNA 17
Chapter 2 19
Ranking in social network – Social rank 19
1. Introduction 19
2. Ranking in social networks 20
Chapter 3 29
Ranking bloggers and Experiments 29
1. Background and Motivation 29
2. Ranking bloggers by PageRank 34
3. Experiment setup and Results 35
Conclusion and Future works 40
Biblography 41
~5~
List of Figures
Figure 1: A symmetric relationship 6
Figure 2: A directional relationship 6
Figure 3: Internet Alliances 8
Figure 4: A socio-gram 10
Figure 5: Graph and adjacent matrix 11
Figure 6: six degrees of separation 15
Figure 7: Real world example of small world networks. 16
Figure 8: The Kite Network 21
Figure 9: An example showing how pagerank works 26
Figure 10: Đầu gấu’s blog 33
Figure 11: The corresponding network of Đầu gấu’s blog. 34
Figure 12: Blog Ranking Architecture 35
Figure 13: A part of the Yahoo 360 network 37
Figure 14: Top 10 bloggers based on number Of comments 38
Figure 15: Top 10 bloggers based on PageRank 38
~6~
Chapter 1
Introduction to Social Network
1. Social network
Social network is a social structure made of nodes and ties, where nodes
might be people, groups, organizations… and ties might be relations, flow or
exchange between the nodes [33].
In the simplest form, the network contains two nodes and one relationship
that connects them [12]. The context might be people studying at the same
university. As you can see Minh and Thu has a relationship because they study at
the same class at university, so in this kind of network, there is a tie between the
two nodes Minh and Thu.
Figure 1: A symmetric relationship
The previous network is un-directional or symmetric, that mean A knows B
and B knows A as well, such relationships are friendships, neighbor, kinship,
companionship, or just living in the same room. But in reality, there are a lot of
relationships which are directional such as financial exchange, like (dislike),
information flow, or disease transmission. For instance, Minh likes Thu, but Thu
might not like Minh.
Figure 2: A directional relationship.
studying at the same university
Minh Thu
likes
Minh Thu
~7~
More complex networks have multi-relationships. These networks model
many kinds of relationship between objects, or there might be many different ties
between some two nodes [12].
Relationships might be more than sharing some attributes or being at the
same place at the same time; the flow between the objects can form a relationship.
Liking, for example, might lead to an exchange of gifts. In an organization, there
is the flow of knowledge between people; they share information, experiences…
and constitutes a network [12].
A tie might have a weight associated with it, explaining the strength of the
relationship between the two objects. A long time friendship should be stronger
than the friendship with someone you have just said “hi” in the street.
Social network is unnecessary to be social in context. There are many real-
world instances of technological, business, economic, and biologic social
networks; such as electrical power grids, telephone call graphs, the World Wide
Web, co-authorship and citation networks of scientists, the spread of computer
viruses or water flow network in a city. The exchange of emails within
organizations, newsgroups, chat rooms, friendships are examples from sociology
[16].
~8~
Figure 3: Internet Alliances
Source:
2. Network construction
Given a set of nodes, there are several strategies to collect information
(objects and relations) and creating a network. The first approaches are full
network methods, which yields the maximum of information, but can also be
costly and difficult to execute, and may be difficult to generalize. On the other
hand, there are approaches that yield considerably less information about the
network structure, but are often less costly, and often more easily generalize from
the observations in the sample to some large population. And there is no one
right way for all research questions and problems; each method has their own
advantages and disadvantages.
In this section, I will introduce an overview of 4 major methods in practice,
refer to [29] for more details.
~9~
2.1.1. Full network methods
This approach begins with a set of actors and tries to collect information
(relations or ties) with all other actors. For example, we could collect friendship
data from all pairs of students in a college; we could count the number of vehicles
moving between all pairs of cities or look at the flow of email between all pairs of
employees in an organization.
Because we collect information between all pairs of actors, full network
methods draw a complete picture of relations in the population. Full network
data is needed to properly define and measure many structural concepts of
network analysis. The disadvantages of this approach is the cost of collecting
information; the process is very expensive .
2.1.2. Snowball methods
In these methods, we choose a set of actors as a starting point. We then
include some other actors who have connections with each actor in the set. The
process continue until no new actors are indentified, or until we decide to stop.
Isolated actors are not located by this method, and the structure of the
network depends greatly on how we choose the initial actors.
2.1.3. Ego-centric networks (with alter connections)
It will not feasible and necessary to track down the full networks beginning
with some initial nodes as in the snowball method for many cases. We can also
begin with a set of some initial nodes and identify nodes that have connections
with the initial nodes. Then, we determine which of the nodes identified in the
first stage are connected to one another.
~10~
2.1.4. Ego-centric networks (ego only)
Ego-centric methods really focus on the individual, rather than on the
network as a whole. These methods collect information on the connections
among the actors connected to each focal ego, which still present a pretty good
picture of the “local” networks, or “neighborhoods” of individuals. Such
information is useful for understanding how networks affect individuals.
3. Network representation
In order to analyze the social network, we need a way to represent it in a
computational structure and to see how it looks like. Network analysis use
graphs and adjacent matrices to model social networks, and use graph theories to
do analyzing.
Graphs are a very useful ways to present information about social networks.
In simple networks, it is easy for us to look at the graph and predict patterns of
information. Network analysis uses one kind of graphic display that consists of
points to represent objects or nodes, and lines to represent ties or relations. The
graphic is called socio-gram. They use various colors, shapes, names, etc, to
represent different actors and relations [29].
Figure 4: A socio-gram
Source:
~11~
In more complex networks, when there are thousands of actors and many
different kinds of relations, graphs (social-grams) can become very visually
complicated that it is difficult to see patterns. In this situation, we can represent
information about social networks in the form of matrices. This approach allows
the application of mathematical and computer tools to summarize and find
patterns [29].
The most common form of matrix in social network analysis is adjacent
matrix, a square matrix with as many rows and columns as there are actors in the
network. The weights or scores in the cells of the matrix show information about
the ties between each pair of actors. This kind of matrix represents who is next to,
or adjacent to whom in the “social space” mapped by relations that we have
measured [29].
Figure 5: Graph (right) and adjacent matrix (left)
Source: [25]
Formally, we represent a network as a graph G = <V,E> consisting of a set of
vertices V = {v
i
} that represent social entities and a set of edges E = {e
ij
} where e
ij
represent information of the connection between the nodes i and j [25].
~12~
4. A brief introduction of graph theory
A necessary course in social network analysis is graph theory. As social
networks can be represented as graphs, understanding fundamental concepts in
graph theories is essential. In this section we will give some concepts that are
often used when analyzing networks. More details can be found at [29].
The degree of a node is defined as the number of ties incident upon that node.
In directed graph, each node has both indegree and outdegree. The indegree is the
number of ties pointing to the node, whereas the outdegree is the number of ties
pointing out from that nodes.
A path is an alternating sequence of nodes and ties, beginning at a node and
ending at a node, and which does not visit any node more than once.
A walk is like a path except that there is no restriction on the number of times
a point can be visited. A path is a kind of walk.
A cycle is just like a path except that it starts and ends at the same point.
The length of a path or walk (or cycle) is defined as the number of ties in it.
A path between two nodes with the shortest length is called a shortest path
(also a geodesic) between the two nodes. It is not always unique (that is, there
may be several paths between the same two points that are equally short). The
graph-theoretic distance between two nodes is defined as the length of the shortest
path between them.
A graph is connected if there exists a path (of any length) from every node to
every other node. The longest possible path between any two nodes in a
connected graph is n-1, where n is the number of nodes in the graph.
~13~
A node is reachable from another node if there exists a path of any length
from one to the other.
A connected component is a maximal sub-graph in which all nodes are
reachable from every other. Maximal means that it is the largest possible sub-
graph: you could not find another node anywhere in the graph such that it could
be added to the sub-graph and all the nodes in the sub-graph would still be
connected.
For directed graphs, there are strong components and weak components. A
strong component is a maximal sub-graph in which there is a path from every
node to every node following all the arcs in the direction they are pointing. A
weak component is a maximal sub-graph which would be connected if we
ignored the direction of the arcs.
A cutpoint is a vertex whose removal from the graph increases the number of
components. That is, it makes some points unreachable from some others. It
disconnects the graph.
A cutset is a collection of points whose removal increases the number of
components in a graph. A minimum weight cutset consists of the smallest set of
points that must be removed to disconnect a graph. The number of points in a
minimum weight cutset is called the point connectivity of a graph. If a graph has a
cutpoint, the connectivity of the graph is 1. The minimum number of points
separating two nonadjacent points s and t is also the maximum number of point-
disjoint paths between s and t.
A bridge is an edge whose removal from a graph increases the number of
components (disconnects the graph). An edge cutset is a collection of edges whose
removal disconnects a graph. A local bridge of degree k is an edge whose
removal causes the distance between the endpoints of the edge to be at least k.
~14~
The edge-connectivity of a graph is the minimum number of lines whose removal
would disconnect the graph. The minimum number of edges separating two
nonadjacent points s and t is also the maximum number of edge-disjoint paths
between s and t.
5. Social network’s characteristics
In the late of 1950s, two mathematicians Erdös and Rényi created a great
important theory in graph by modeling many real world networks by a special
type of graph – random graph. To create a random graph with n nodes and m
ties, they put n nodes next to each other, take pair of node at random and tie
them together, the process continues until the graph has m ties. Erdös and Rényi
realize that “when m is small, the graph is likely to be fragmented into many
small clusters” (components), “as m increases the components grow”. For m >
n/2, all nodes are connected to each other [31].
Beside regular and random graph, the two extreme types of graph, network
analysts also study some other types of networks, two most important of them
are small world and scale free networks.
5.1. Small world networks
The experiments conducted by Stanley Milgram and his colleagues for social
networks of people in the United States raising the concept of “small world”. The
phrase captures the initial surprise between two strangers (“What a small
world”) when they realize that they are indirectly connected to one another
through mutual friends. People in Kansas and Nebraska were asked to direct
letters to strangers in Boston by forwarding them to friends who thought might
know the strangers in Boston. And half of the letters were successfully delivered
through no more than five intermediaries. Another experiments show that there
might be “six degrees of separation” between any two individuals in the world.
~15~
The research was groundbreaking in that it showed that human society is a small
world network characterized by shorter than expected path lengths [16].
In small world network, most nodes can be reached from every other by a
small number of hops or steps.
Figure 6: six degrees of separation
Source:
~16~
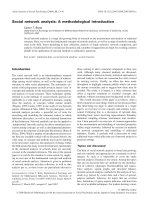
Figure 7: Real world example of small world networks.
(a) science coauthor network, (b) connected pages on a part of the internet, (c)
biochemical pathway network, and (d) New York state electric power grid.
Figure 7 (a), (b), (c) are from
www.nd.edu/~networks/publications.html#talks0001 by Barabasi, Oltvai, Jeong
et al. Figure 6 (d) is from
~17~
5.2. Scale free networks
Many real world networks are scale free, which means the network will not
change its properties no matter how many nodes it has. The degree distribution
of scale free networks follows the Yule-Simon distribution – a power law
relationship defined by P(k) ~ k
-α
, where P(k) denotes the probability that a node
in the network connects with k other nodes, the coefficient α may very
approximately from 2 to 3 for most cases, but some times it can takes a value
between 1 and 2 [36].
Scale free networks have some highly connected hubs and the rest of nodes
are of low degree. The hubs are thought to serve some specific purposes in their
networks, although this depends greatly on the domain. The structure of this
kind of network allows the ability of fault tolerant. Because the random
occurrence of failures and the number of small degree nodes are enormous, the
likelihood that a hub would be affected is negligible. Even if such even occurs,
the networks will not lose its connectedness, because of the remaining hubs. This
property make scale free network highly stable and robust [36].
6. Social network analysis – SNA
SNA [15] deals with mapping and measuring the nodes and relations
between the nodes in a social network. As stated previously, the nodes might be
people, organizations, etc, and relations might be friendship, kinship, or water
flow.
Social network analysis has become a key technique in modern sociology,
anthropology, geography, social psychology, sociolinguistics, information
science, communication studies, organizational studies, economics, and biology
as well. For over a century, people have used social network metaphor to model
complex sets of relationships between actors of social systems at all scale.
~18~
Analysts reason from whole to part, from structure to relation to individual, from
behavior to attitude [33].
So why do we have to study social networks and what we can learn about
their structure? The reason is that the structure of a network affects its
functionalities. For example, the topology of social networks affects the way
diseases spread through a population. Consider a city water distribution
network, delivering water to households via pipes and junctions. Accidental or
malicious instructions can cause contaminants to spread over the network. Jure
Leskovec and colleagues at Carnegie Melon University has proposed an
algorithm to select a few locations to install sensors in order to detect these
contaminants as soon as possible so that it minimizes the population consuming
contaminants [18]. The topology of power grid affects the stability and robustness
of its power transmission; the power failure in Cleveland, Ohio on August 14,
2003 is an example. When occurred, the shutting down of nuclear power plants in
New York State and Ohio led to widespread power blackouts in many parts of
the Northeastern United States and Southeastern Canada through an
interconnecting grid system, which affected about 50 million people [16].
~19~
Chapter 2
Ranking in social network – Social rank
1. Introduction
The evolution of the Internet has led to the need of a mechanism to find
information in an efficient way, and information retrieval systems (search
engines in particular) are born for this reason. Information Retrieval is a science
of searching for information in documents. The system is often very complex, and
consists of four main parts: crawlers, document processors, indexers and search.
Crawlers (or spiders) collect documents and store them on disks. Documents
are usually web pages on the internet. Then, these documents will be sent to
document processors to process and extract necessary information, for example,
remove un-wanted part of documents (advertises, header, footer, etc), extract
title, body, descriptions, etc Information extracted from the process will be stored
back to disks in a special structure that helps rapid access and search for a query.
Web front-end is a interface that standing in front of users, receives queries from
users, contacts the search component and present the results back to users. Refer
to [28] for more details about information retrieval.
As you can imagine, because of the huge size of the internet (Google has
about 60 billion documents in its index [17] in 2005), the number of results for
each query might be millions, or even billions, for example, the query “search
engine” returns over 200 million results from Google. Users do not have time and
patient to through every page to find an interested answer for their question. The
process of rearrange the results so that the most relevant documents appear first
in the list is called ranking. Ranking helps users find their need-answer without
much effort, that mean in a rapid and efficient way.
~20~
Many ranking algorithms have been proposed to rank documents based on
context, that mean whether the query terms match in the title, or in the body of a
document; how early and how often they appear in a document. It seems that a
document is more relevant to a query if the query terms appear in the title rather
than in the body of the document. We often use freshness when searching for
news. Freshness is a measure of how fresh a document is. Freshness help search
engines rank documents based on the time it is created.
We also measure the quality of a document to improve ranking. So what is
quality? Let me explain it by some examples. Because of your search policy, you
might want to favor web sites from government more than those from education,
and focus on pages from education more than pages from the left. In other words,
you assume pages from government have higher quality than pages from
education, and pages from education have higher quality than the left. And
another assumption is that home pages’ quality are higher than quality of pages
that from a deeper position. It is very useful in the context that users search for a
product or a company, the homepage of the company or the product should be
on top. For instance, the query “Microsoft” should return the homepage of
Microsoft Corporation rather than the page of some users that complains about
the Microsoft products.
To calculate the quality of a document, we can borrow some algorithms
from social network analysis, which use the link structure to determine the
importance of individuals in the network.
2. Ranking in social networks
In social network analysis, one fundamental problem is ranking individuals
in society according to their implicit importance, for example the power or
influence, determined by the topology of the networks. Precisely, given a social
~21~
network, the purpose is producing a rank point, which is a non negative value,
assigned to each individual [7].
We measure the importance of individuals in concepts of centrality,
including Degree centrality, Betweenness centrality, closeness centrality and
Eigenvector centrality. And we focus on Eigenvector centrality with the two most
popular variants, PageRank and HITS.
2.1. Centrality
Figure 8: The Kite Network
Developed by David Krackhardt, source:
~22~
2.1.1. Degree Centrality
Degree Centrality is measured by the number of direct connections a node
has. As illustrated in the kite network above, Diane has the most direct
connections in the network, making her the most active node in the network. For
several contexts, it is better to have many connections, but not always right. What
really matters is where those connections lead to and how they connect the
otherwise unconnected. Diane has connections only to others in her clique, who
are already connected to each other [26].
If the network is directed, we classify the degree centrality into two types:
in-degree and out-degree. In-degree of a node is the number of connections
coming from other nodes to the node, whereas out-degree of a node is the count
of connections starting from the node [34].
2.1.2. Betweenness Centrality
A node is said to be in high betweenness position if it connects many pairs
of actors in the network, or stands in many shortest paths between any pairs of
actors. If two non adjacent actors j and k want to interact and actor i is on the path
between j and k, then i may have some control over the interactions between j
and k. Betweenness measures this control of i over other pairs of actor. Thus, if i
is on the paths of many such interactions, then i is an important actor [9].
In the network above, Heather has few direct connections but she has one of
the best locations in the network, she is between the two most important clusters.
As a cut-point in the shortest path connecting two other nodes, Heather could
control the flow of information or exchange of resources. Besides the powerful
role Heather has, she is a single point of failure [26].
~23~
2.1.3. Closeness Centrality
The idea of closeness centrality is that an actor is central if it can easily
interact with all other actors. Look at Figure 8, Fernando and Garth have fewer
connections than Diane, but their positions allow them to interact and
communicate with all the nodes in the network more quickly than anyone else.
They have high closeness centrality, they have the shortest paths to all others, or
they are close to everyone else [26].
Computing the betweenness and closeness centralities of all the nodes in a
network needs calculating the shortest paths between all pairs of nodes on the
network. This takes O(V
3
) time with Floyd-Warshall algorithm. On a sparse
graph, the more efficient Johnson’s algorithm takes O(V
2
logV + VE) time [34].
2.1.4. Eigenvector Centrality
Eigenvector centrality is a measure of the importance of a node in a network.
It assigns relative scores to all nodes in the network based on the principle that
connections to high-scoring nodes contribute more to the score of the node in
question than equal connections to low-scoring nodes [34].
2.2. PageRank & HITS
Nearly all the major Web search engines today use link analysis to improve
their search results. HITS and PageRank are two of the most popular link analysis
algorithms. Both were developed around 1998 and both have dramatically
improved the search business.
2.2.1. HITS
HITS stands for Hyperlink-Induced Topic Search, a link analysis algorithm
proposed by John Kleinberg from Cornell University during his postdoctoral
studies at IBM Almade [5, 8, 9, 24]. Specifically, a root set R of nodes is
constructed by sending a query q to an information retrieval system. Any node
~24~
u V (V is the set of nodes in the graph) that has an inlink or outlink to any node
r
R, that is e
ur
E or e
ru
E, is also included as well. The additional nodes and
the root set together form the base set V
q
. We now remove any nepotistic links, or
eliminates edges that connect nodes from the same host. The remaining edges are
called E
q
. So we have just constructed a query-specific graph G
q
= (V
q
, E
q
).
The HITS algorithm is based on a pattern Kleinberg noticed among Web
pages. Some pages that have many in-links are called authorities, which contain
definitive high-quality information. Other pages serve as hubs or portal pages.
Kleinberg noticed that good hubs seemed to point to good authorities and good
authorities were pointed to by good hubs. Every page is both a hub and
authority, but with different strengths. So he decided to give each page both a
hub score h
i
and an authority score a
i
. In fact, for every page i he defined the hub
score at iteration k, h
i
(k)
, and the authority score, a
i
(k)
, as:
a
i
(k)
=
h
i
(k)
=
for k = 1, 2, 3, …
To calculate the scores for a page, he started with a uniform scores for all
pages, such as h
i
= 1/n and a
i
= 1/n where n is the number of pages or nodes in
G
q
. The hub and authority scores are iteratively refined until convergence to
stationary values.
In practice, we use two column vectors h and a representing hub and
authority scores, where the i
th
component of the vectors holding the scores of
page i. We also use adjacency matrices for representing graphs, let L be the
matrix for the graph (L
ij
= 1 if page i links to page j , and 0, otherwise). The
equation of HITS now become
~25~
a
(k)
= L
T
h
(k-1)
and h
(k)
= La
(k)
Using some algebra, we have
a
(k)
= L
T
La
(k-1)
h
(k)
= LL
T
h
(k-1)
Where L
T
L is called the hub matrix and LL
T
is the authority matrix. The
HITS algorithm deals with solving the eigenvector problems L
T
La = a and LL
T
h
=
h, where is the largest eigenvalue of L
T
L and LL
T
, a and h are
corresponding eigenvectors.
There are many issues when calculating these score beyond the basic linear
algebra, such as convergence, existence, uniqueness, and numerical computation.
Several research has proposed some modifications to HITS, and each bringing
various advantages and disadvantages [5, 8].
2.2.2. Pagerank
PageRank [5, 8, 9, 21, 24, 27] is one of the most important ranking techniques
used in many search engines. The ranking algorithm was proposed by Lawrence
Page, the co-founder of the Google Inc. Pagerank is the heart of Google, that
made Google really different from the other search engines at the time it came
out. The reasons made PageRank the most popular is not because of its simple,
robust and reliable in measuring the importance of web pages, but it also gain
advantages with other ranking techniques in that it is query independent and
content independent. Moreover, it can be calculated offline using only the web
graph structure and then used later .
The philosophy of PageRank can be described as follows: consider a random
surfer that starts from a random page, and at every time randomly chooses the
next page by clicking on one of the hyperlinks in the current page. We could
define the rank of a page as the fraction of time that the surfer spent on that page