tóm tắt luận án tiến sĩ tiếng anh nghiên cứu sự biến đổi của nhu cầu tiêu và biện pháp tiêu nước cho hệ thống thủy nông nam thái bình có xét đến ảnh hưởng của biến đổi khí hậu toàn cầu
Bạn đang xem bản rút gọn của tài liệu. Xem và tải ngay bản đầy đủ của tài liệu tại đây (846.47 KB, 29 trang )
MINISTRY OF EDUCATION
AND TRAINING
MINISTRY OF
AGRICULTURE AND RURAL
DEVELOPMENT
WATER RESOURCES UNIVERSITY
BUI NAM SACH
RESEARCH ON THE CHANGES OF DRAINAGE
REQUIREMENTS AND DRAINAGE SOLUTIONS FOR
THE SOUTH THAI BINH IRRIGATION AND DRAINAGE
SYSTEM TAKING INTO GLOBAL CLIMATE CHANGE
Field of research: WATER RESOURCES PLANNING AND MANAGEMENT
Code: 62 - 62 - 30 - 01
SUMMARY OF THE PHD THESIS
HANOI - 2010
1
The Thesis is done at the Water Resources University
Supervisors:
1. Assoc. Prof. Dr. Le Quang Vinh
2. Assoc. Prof. Dr. Pham Viet Hoa
Critic 1: . . . . . . . . . . . . . . . . . . . . . . . . . . . . . . . . . . . . . . . . . . . . . . . . . . . .
. . . . . . . . . . . . . . . . . . . . . . . . . . . . . . . . . . . . . . . . . . . . . . . . . . . . .
Critic 2: . . . . . . . . . . . . . . . . . . . . . . . . . . . . . . . . . . . . . . . . . . . . . . . . . . . .
. . . . . . . . . . . . . . . . . . . . . . . . . . . . . . . . . . . . . . . . . . . . . . . . . . . . .
Critic 3: . . . . . . . . . . . . . . . . . . . . . . . . . . . . . . . . . . . . . . . . . . . . . . . . . . . .
. . . . . . . . . . . . . . . . . . . . . . . . . . . . . . . . . . . . . . . . . . . . . . . . . . . . .
The Thesis defence will be held before a state-level council at . . . . .
. . . . . . . . . . . . . . . . . . . . . . . . . . . . . . . . . . . . . . . . . . . . . . . . . . . . . . . . . . . . . . . . . .
. . . . . . . . . . . . . . . . . . . . . . . . . . . . . . . . . . . . . . . . . . . . . . . on
. . . . . . . . . . . . . . . . . . . . . . . . . . . . . 2010
The Thesis is available at: - National Library
- Water Resources University’s Library
2
INTRODUCTION
A. NECESSITY OF THE THESIS
In last 70 years, the average temperature increased by 0.7
o
C and sea
level rose by 20 cm in the country. In recent years, number of cold
spells reduces, number of strong typhoons increases and their
development is abnormal. The storm season usually ends later. Since
1997, there are big storms landed in the Mekong Delta. According to
the climate change (CC) and sea level rise scenarios for Viet Nam by
2100, sea level may rise by 65 cm to 100 cm and cause inundation to
about 5,000 km
2
in the Red River Delta (RRD) and 20,000 km
2
in the
Mekong Delta.
Existing hydraulic works in the RRD in general and in the South
Thai Binh irrigation system (South Thai Binh system) in particular
mainly aimed to ensure agricultural demands without emphasis on
water supply and sewage for urban, industrial and aquacultural areas.
Most of the existing hydraulic work systems haven’t met agricultural
drainage requirements yet, in case additional drainage demands for
those areas occur as consequence of impacts of CC and sea level rise,
the conflict between drainage demands and available drainage
capacity of those systems became more serious.
Therefore, the thesis on “Research on the changes of drainage
requirements and drainage solutions for the South Thai Binh
irrigation system taking into account impacts of global CC” was
proposed and implemented.
B. OBJECTIVES OF THE THESIS
To identify the changes of drainage requirements (drainage
coefficients, total drainage volumes and drainage duration) and
propose drainage solutions for the South Thai Binh system taking
into account impacts of global CC.
C. SUBJECTS AND SCOPE OF THE RESEARCH
- The research focuses on drainage requirements and drainage
solutions for surface water sources under impacts of natural and
social changes.
- Scope of the research is the South Thai Binh system.
3
D. CONTENTS AND METHODOLOGY
D1. Contents
Drainage requirements and solutions for those irrigation systems
affected by tides as consequences of CC and sea level rise.
D2. Methodology
i) Inheritance of previous studies; ii) survey and assessment; iii)
comprehensive analysis; iv) hydrological and hydraulic models.
D3. Locations of the research
The South Thai Binh irrigation system
E. FINDINGS OF THE THESIS
- Since the issuing of the CC and sea level rise scenarios by the
Government of Vietnam, this is the first detailed research on impacts
of CC on a specific region of the country. The research provided
quantitative information justifying changes of hydro-meteorological
parameters in the RRD and the South Thai Binh system from the
second half of the 20
th
century and impacts of the change on
operation and management of hydraulic works.
- The thesis is the first in-depth research on drainage coefficients and
scientific bases of the solutions making use of storage and regulation
capacity of ponds and lakes to adjust the drainage schematic for
irrigation and drainage systems.
- The thesis quantified levels of change of drainage coefficients,
requirements and solutions for the system taking into account
impacts of CC and sea level rise.
- The thesis studied and identified the scope and levels of inundation
in the system under impacts of sea level rise in accordance to key
milestones of the approved CC scenarios.
- The thesis also proposed main solutions to minimize inundation
area and respond to global CC for the South Thai Binh system for
each stage from now to the year 2100.
- Develop a research methodology for impacts of CC on drainage
coefficient and drainage requirements for a specific irrigation and
drainage system.
4
Chapter 1
OVERVIEW
1.1. WORLD-WIDE RESEARCHES AND STUDIES ON THE TOPIC
Worldwide researches and studies on climate change (CC) have been
carried out in 1990s. The UN Conference at Rio de Janeiro in 1992
endorsed the Framework Agreement and the International Action
Plan to save the rapid “worse situation” of the planet atmosphere.
The Intergovernmental Panel on Climate Change (IPCC) was
established. The Kyoto protocol was endorsed by 165 heads of states
including Viet Nam and has taken effect since February 19, 2005.
According to the IPCC, in period 1920 – 2005, the earth average
temperature increased by 1
o
C and forecast to increase by 1.4 to 4
o
C,
sea level will rise by 28 cm to 43 cm, or 81 cm as maximum. British
scientists predict that sea level may rise by 163 mm by the end of the
21
st
century. UNDP warned that if sea level rises by 1.0 m, 45% of
agricultural lands in the Mekong Delta in Viet Nam will be
inundated; about 4,500 km
2
in Egypt will be submerged and 18% of
Bangladesh will be inundated. Also according to the IPCC, 10 cities
which will be most hit by CC are Calcutta and Bombay in India,
Dacca in Bangladesh, Shanghai, Quangzhou in China, Ho Chi Minh
city in Viet Nam, Bangkok in Thailand and Yangon in Myanmar.
According to scientists, measures to minimize CC should focus on
two directions: firstly, to reduce impacts of CC, and secondly to
adapt to CC.
In Japan, scientists estimated that if sea level rises by 1 m, about 90%
of beaches in Japan will be lost and paddy production will reduce by
almost 50%. In that case, Ministry of Environment suggested the
Government to reserve a budget of above 64.5 billion USD for
response to sea level rise. China is considering the construction of
reinforced dike system along its coasts. In Great Britain, the
Environment Agency of the Government suggested a budget of 8
billion USD to improve the Thames river dike and about 1.2 billion
USD a year to manage floods. In Bangladesh, the Government has
5
program to invest 6.5 million USD in responding to salinized coastal
areas and propose a project to heighten 800 km of roads by 0.5 m to
1.0 m to prevent from inundation by sea level rise with total costs of
128 billion USD. On May 11, 2008 at the G8 Ministerial Meeting in
Niigata (Japan), global CC was chosen as the key topic of the
agenda. At the G8 summit at Hokkaido (Japan) on July 7-9, 2008,
the countries agreed to invest above 10 billion for research and
development of technologies against the risk of global warming.
Researches on burying CO
2
into lands were adopted by worldwide
scientists. Also at the G8 summit, reduction of greenhouse gas was
set as a target for each of the countries from 2013. Therefore,
development of a “National Target Program for Response to Climate
Change and Sea Level Rise” is urgent that Viet Nam together with
other countries should cope with.
In researches by IPCC, UNDP on CC scenarios, atmospheric
aerodynamic and hydrodynamic models for oceans were developed
and applied to quantify impacts of CC on the global climate and
water level in the world oceans. A recent research published by the
Association of Universities at the Copenhagen University in March
2009 revealed possibilities of more severe impacts of CC in the 21
st
century than forecast figures published by IPCC in 2007.
1.2. RELEVANT DOMESTIC RESEARCHES AND STUDIES
On September 9, 2009, Ministry of Natural Resources and
Environment official published three CC and sea level rise scenarios
for Viet Nam in the 21
st
century for the cases of medium, low and
high emission. According to the scenarios, by the end of the 21
st
century sea level may rise by 65; 75; or 100 cm compared to that of
the period 1980 - 1999. The scenarios also reveal the inundation area
of 5,133 km
2
(12.8%); 7,580 km
2
(19%) or 15,116 km
2
(37.8%) in the
Mekong Delta for the cases that sea level rises by 65 cm; 75 cm or
100 cm.
The thesis presented an overview of 14 scientific researches relevant
to drainage and CC in Vietnam and their limited results. Most of
6
previous studies used forecasts by IPCC, UNDP, and WB which had
taken into consideration the South-East Asia and Viet Nam but with
preliminary assessment and on narrow scopes only. The following
issues are relevant to the thesis but not addressed yet in the previous
studies and researches.
- Levels of change of hydro-meteorological parameters in river
basins, in particular variations of hydrodynamic regimes in lower
basins and in coastal estuaries of river basins in Vietnam, including
the Red - Thai Binh river basin, and their impacts on drainage
systems and natural disaster mitigation infrastructures.
- Detailed impacts of CC on drainage requirements as
consequence of increasing rainfall in rainy season;
- Not available research on changes of drainage requirements and
drainage solutions for the RRD in general and for the South Thai
Binh system under impacts of global CC.
The thesis concludes: Previous researches mainly focused on the
development of CC scenarios and looking for solutions to minimize
the worse situation of CC and to adapt to CC. So far, there have not
been any research results on the changes of drainage coefficient and
drainage requirements for irrigation and drainage systems under
impacts of CC and sea level rise. This constitutes an important basis
to form the thesis on “Research on the changes of drainage
requirements and drainage solutions for the South Thai Binh
irrigation and drainage system taking into account impacts of CC”.
7
Chapter 2
CLIMATE CHANGE IN THE RED RIVER DELTA AND THE
IMPACTS ON WATER DRAINAGE
2.1. BACKGROUND
The Red River Delta consists of 10 provinces and cities covering a
natural area of 1,486,250 ha including above 760,000 ha of
agricultural lands and more than 18.6 million people. The South Thai
Binh is one of the 22 irrigation and drainage systems in the RRD.
2.2. CLIMATE CHANGE
The thesis used data and information of 12 meteorological stations
which have continuous observation data since 1956. Available data
showed that average yearly temperature increased by 0.4
o
C to 0.6
o
C.
There were 29 cold spells each year in period 1971-1990, but this
figure reduced to 24 in period 1991-2000 and 15-16 in period 1994-
2008. Average monthly relative humidity is decreasing. Evaporation
change is not clear. Number of sunny hours tended to increase in
period 1961-1990, but has been decreased since 1991. Number of
storms occurred in the East Sea increases but those landed in the
RRD decrease. The storm season ends later, storm trajectories are
abnormal, number of early storms in May and June tends to increase,
number of late and very late storms also increases. Changes of annual
rainfall are not clear but average monthly rainfall sharply decreases
in months of dry season and obviously increased in months of rainy
season. Number of drizzling days also decreases from 30 days a year
in period 1961-1990 to 13-15 days since 1991. Total rainfall of heavy
rains in short periods did not change significantly but the intensity
was increased and their coincided occurrence on large scale raised
drainage requirements.
2.3. HYDROLOGICAL CHANGES
- Average monthly flows in the period 1988-2008 were lower than
those in the period 1956-1987 (with 506 m
3
/s, 276 m
3
/s, and 76.2
m
3
/s lower in November, December and January respectively) which
resulted in sharp water level reduction in the period 1988 – 2008
compared to that of the period 1956-1987. Since 2004-2005, the dry
season water level in Hanoi is always lower than the average annual
8
causing difficulties in difficulties to water extraction in the
downstream.
- Mean and maximum water levels in months of flood season in the
Red river downstream tend to increase in recent years.
2.4. IMPACTS OF CLIMATE CHANGE ON DRAINAGE
OPERATION OF IRRIGATION AND DRAINAGE SYSTEMS
Results of calculations for the year 2020 revealed the following:
In case of heavy rains and big floods of frequency of 10% together
with forecast sea level rise for 2020, about 450,000 ha of the areas
currently served with pumping drainage will be inundated without
prompt improvement to existing pumping stations to allow them to
operate at higher water level. About 270,000 ha of the areas currently
served with gravity drainage will be inundated. In other words, the
areas served with pumping drainage will expanded to at least 270,000
ha additionally in the Red River Delta.
Table 2.29: Impacts of CC on inundation
Scenario
High and
ebb tide
elevation
(m)
Inundated
areas
outside the
dikes (ha)
Inundated
areas
inside the
dikes (ha)
At present:
- Fully submerged areas -1.5 1,432 2,013
- Semi-inundated areas +1.5 24,136 157,781
Sea level rise by 0.33 m:
- Fully submerged areas -1.17 15,168 88,207
- Semi-inundated areas + 1.83 33,105 227,355
Sea level rise by 1.0 m:
- Fully submerged areas - 0.5 28,904 174,401
- Semi-inundated areas +2.5 43,433 321,998
9
Chapter 3
DRAINAGE REQUIREMENTS AND INFLUENCING
FACTORS
3.1. CHANGES OF DRAINAGE COEFFICIENTS IN THE RRD
The thesis summarized the process of changes of drainage
coefficients of 22 large-scale irrigation and drainage systems in the
RRD through historical milestones and socio-economic stages of the
country (before 1954, in 1954-1973, in 1973-1995 and at present).
3.2. FACTORS INFLUENCING DRAINAGE COEFFICIENTS
The thesis generalized two groups of factors that influence drainage
coefficients, analyzed scientific bases and influencing levels of those
factors. The first group comprises of natural factors, including: i)
geographical location, ii) drainage rainfall characteristics, iii) tidal
characteristics, iv) water level regimes at the water receiving
locations, v) topographical conditions, vi) soil conditions and shallow
aquifers. The second group involves socio-economic factors
including: i) the rapid economic growth and ii) operation
management. For overcoming subjective negative factors, human
beings should mitigate their impacts by applying hydraulic,
agricultural, forestry and management measures while we should
focus on adaptation and response measures against objective negative
factors.
3.3. CLASSIFICATION OF DRAINAGE SUBJECTS
Drainage regimes depend on characteristics of each locality, land use
structure and types of drainage subjects. The thesis built up a
theoretical basis to classify drainage subjects, analyzed scientific
bases and drainage requirements for each of the following drainage
subjects: i) agricultural lands; ii) urban areas; iii) rural areas; iv)
industrial areas and craft villages, and v) others.
10
3.4. METHODS TO CALCULATE DRAINAGE COEFFICIENTS
AND ADJUST THE DRAINAGE COEFFICIENT SCHEMATIC
3.4.1. Method to calculate drainage coefficients
The thesis introduced in details scientific bases and method to
calculate drainage coefficients for each of the drainage subjects and
preliminary drainage coefficients for irrigation and drainage systems
which contains different drainage subjects as basis for calculating
drainage coefficients and drainage requirements for the South Thai
Binh system.
3.4.2. Method to adjust the drainage coefficient schematic
3.4.2.1. Scientific basis of the solution to making use of storage
capacity of ponds and lakes to adjust the drainage coefficient
schematic
In calculating drainage coefficients for non-irrigated paddy drainage
subjects, the following formula (3.2) is applied:
qi =
64,8
.
i
PC
(liter/second/ha) (3.2)
in which: Pi total precipitation in calculation time ti; C the flow rate
of the drainage command area, C ≤ 1.0. For the cases of ponds and
lakes, C is as follows:
1) For natural ponds and lakes (without regulation structures): C =
0.20 – 0.25. Ponds and lakes in this case cannot store additional
water to adjust the drainage coefficient schematic.
2) For specialized aquacultural ponds and lakes: All precipitation
on the ponds and lakes must be promptly drained to prevent from
overflow and protect fishes. In this case C = 1.0.
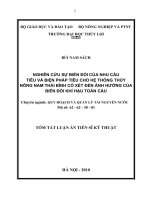
3) For regulated ponds and lakes (with regulation structures): the
storage and regulation capacity of the catchment depends on total
regulation capacity of those ponds and lakes. Figure 3.3 preliminarily
presents storage levels in regulation reservoirs:
11
- Operation depth or operation capacity of reservoirs ranges from the
maximum water level (MN max) to
the minimum water level (MN min).
- Before the occurrence of designed
rainfall, water level in reservoirs is
kept at the MN min.
Figure 3.3 - The whole rainfall (Xp) is to be
kept in the reservoirs and then drained on last days of the draining
period (in days without rains): C = 0.0 in rainy days.
- In stressful draining days, those reservoirs will keep certain
volumes of to-be drained volume in order to mitigate the drainage
coefficients (storage capacity W
storage
is corresponding to the storage
depth H
storage
in the schematic in Figure 3.3). That volume of water
will be fully drained in days with less stressful drainage requirements
and in last days of the draining period. So drainage coefficient of the
regulation reservoirs in the preliminary drainage coefficient
schematic will be as follows:
+ During rainy days: qi = 0
+ Last 2 days of each drainage period:
qi =
28,17
∑
Pi
(3.14)
3.4.2.2. Technical requirements of regulation reservoirs
a) Maximum water level can be stored in reservoirs must be lower
than the water level in the conveyance canals to the reservoirs.
b) Minimum water level in reservoirs must be higher than the water
level in the drainage canals from the reservoirs in draining periods.
c) Conveyance canals to the reservoirs and drainage canals from the
reservoirs are actively operated.
Levels of reduction of drainage coefficients after storing certain
volume of water in ponds and lakes are calculated using the
following formula:
12
MN max
Wtr÷
MN min
Htr÷
Xp
∑
∆
tru
q
=
∑
=
n
i 1
64,8
tiTKi
H
α
×
(liter/second/ha) (3.15)
In which:
∑
∆
tru
q
: total possible reduction of drainage coefficients of the
basin (liter/second/ha);
H
Tki
: designed storage depth of the reservoir i (mm);
H
TKi
= H
storage i
- ∑ho (mm)
α
ti
: ratio of surface areas of the reservoir i and total catchment
area.
α
ti
=
K
ti
ω
ω
H
trữi
: storage depth as in Figure 3.3 of the reservoir i in the basin
(mm)
∑ho : total water loss due to infiltration and evaporation during
storage and drainage periods (mm).
ω
ti
: surface area of the reservoir i.
ω
k
: total drainage catchment.
3.4.3. Calculation of design drainage coefficients for irrigation
and drainage systems
Designed drainage coefficient of a basin (or an irrigation and
drainage system) after using regulation reservoirs to store to-be-
drained volume is calculated using the following formula:
q
tk
=
n
n
j
truj
∑ ∑
=
∆−
1
(3.16)
in which:
q
tk
: designed drainage coefficient of the basin (liter/second/ha).
q
j
: drainage coefficient of the basin in the day j with heavy rains
(the day to store water in the regulation reservoirs).
13
n : number of days with heavy rains that require water storage in
reservoirs.
Note: i) total additional drainage coefficients of the basin in less
stressful draining days are equal to the total drainage coefficients
stored in regulation reservoirs; ii) Drained water from the
regulation reservoirs is not more than stored water in the reservoir;
iii) Drainage coefficients of the basin in draining days from the
regulation reservoirs to the drainage system in the drainage
coefficient schematic are not higher the design drainage coefficients
identified using the formula (3.16).
3.5. SELECTION OF THE DESIGN RAINFALL MODEL
The thesis presented some concepts of the design drainage rainfall
models, the typical rainfall models and the method to select the
typical rainfall model that is suitable for specific conditions of each
region and concludes the following:
a) For designed drainage rainfall for agriculture, it is recommended
to select 5 day-rains with rainfall peak occurred on the second or
third day. In calculating drainage coefficient for paddy, it is
preferable to calculate for the case with design rainfall and the
system can fully drain in the most unfavorable growing stages of
paddy (when young paddy just takes root but is then menaced by
rainfall higher than the design rainfall so harvest will not be fully lost
or productivity will not be affected.
b) For industrial zones and urban areas, it is preferable to use the
same drainage rainfall model that is applied to the whole irrigation
and drainage system (of the same frequency, same total rainfall,
number of rainy days, and distribution of the designed rainfall) but
hourly rainfall distribution model should be applied for that rainy
period and the drainage coefficients should be also hourly.
c) For other drainage subjects, either the designed drainage rainfall
model for agriculture or that for centralized urban areas and
industrial zones can be applied depending on specific conditions.
14
3.6. RESULTED DESIGN DRAINAGE RAINFALL MODEL
Table 3.6: Maximum 5-day drainage rainfall model with frequency
of 10% applied for some representative stations in the RRD
Rainy
day
Distribution model of designed drainage rainfall at stations
(mm)
Hai
Duong
Hung
Yen
Ha
Dong
Phu
Ly
Nam
Dinh
Ninh
Binh
Thai
Binh
1 11.55 7.96 139.55 18.29 214.06 239.26 77.72
2 78.28 165.77 15.31 144.68 110.51 93.59 172.95
3 150.05 100.69 19.23 130.23 19.41 9.93 40.92
4 90.59 40.30 126.02 105.28 9.36 12.73 108.84
5 2.31 19.04 115.39 11.64 43.71 125.04 20.41
Total 332.78 333.76 415.50 410.12 397.05 480.55 420.84
3.7. COMMENTS AND ASSESSMENT
1) Socio-economic development and CC are the main causes of
changes to drainage coefficients in the RRD. The changes are in
increasing trend with more urgent drainage needs.
2) Drainage regime depends on various factors including natural and
socio-economic factors such as geographical location, drainage
rainfall characteristics, tidal characteristics, water level regimes at the
water receiving locations, topographical, geological and soil
conditions, land use and drainage subjects available in the drainage
system. Drainage requirements of each drainage subject and of the
whole basin are reflected by the drainage coefficients and the
drainage coefficient schematic.
3) Drainage requirements and ratio of area of each drainage subject
available in the drainage system to the total drainage command area
significantly influence the design drainage coefficient. Level of
reduction of drainage coefficients depends on purpose and area of
water surface, storage depth and storage capacity of regulation
reservoirs in that irrigation and drainage system.
15
4) Precipitation is one the most important factors that decide the
drainage coefficient. Given natural geographical conditions of the
RRD and the South Thai Binh system, it is recommended to select 5
day-rains with rainfall peak occurred on the second or third day.
Using daily rainfall data observed in period 1956-2008, the thesis
analyzed and calculated designed drainage rainfall for specific
locations in the RRD including the South Thai Binh system.
5) At present, in the Red River Basin there are 22 hydraulic zones of
different drainage scales and drainage measures that serve secure
drainage for above 903,000 ha. However about 30,000 ha are not
served with drainage structures. Every year, more than 100,000 ha of
the RRD are inundated, of which harvest is fully lost on about 15%-
20%. Due to rapid changes of socio-economic and natural conditions,
the gravity drainage areas narrow whilst the pumping drainage areas
are increasing in hydraulic zones. Total gravity drainage areas of the
22 irrigation and drainage system reduced by 94,000 ha compared to
those in 10 years ago (in end years of the 20th century, about 568,575
were drained by gravity but this figure is now 474,452 ha only, or
41.77 % of the drainage command area). If sea level rises as forecast,
the whole RRD will need pumping drainage by the end of the
century.
16
Chapter 4
IMPACTS OF CLIMATE CHANGE ON THE DRAINAGE
DEMANDS OF SOUTH THAI BINH IRRIGATION SYSTEM
AND PROPOSAL OF RESPONSE MEASURE
4.1. INTRODUCTION OF SOUTH THAI BINH IRRIGATION
SYSTEM
South Thai Binh Irrigation System is one of the 22 large scale
irrigation systems in Northern Delta with a natural area of 66,985 ha
of which the area in need of draining is 59,782 ha, agriculture land
42,915 ha, covering districts of Vu Thu, Kien Xuong, Tien Hai, and
part of Thai Binh city located on the southern bank of Trà Lý river.
At present, in the system 49,347 ha is drained by gravity through
sluices of Lân 1, Lân 2 and other drainage sluices downstream of Red
and Tra Ly Rivers. Pumped drained area is 10,435 ha located along
Red River and Tra Ly river. Kien Giang river which is 53.64 km long
is the main drainage canal. 19 branch canals linked to Kien Giang
river have total length of 166.64 km. Annually, the system sees more
than 10,000 ha of rice inundated, of which thousands of ha of rice
fields are completely lost. There are many reasons to the inundation
which can be grouped as follows: i) negative aspect of the
topography of the drainage area; ii) impacts of global climate
change; iii) impacts of storms and combined low air pressure and
high water level in drainage receiving bodies; iv) Socio-economic
development has led to the changes in drainage demands in a more
quickly and absolute manner; v)The degradation and limited
drainage capacity of drainage structures have affected the
performance of hydraulic work; vi) Management, exploitation and
17
protection organization show weakness which limit the effective
operation of the drainage system.
By May 2008 the total area of industrial zone and handicraft village
land is 730 ha, which is expected to increase to 1,819 ha by 2020.
Sewage from these areas and their activities is directly discharged
into Bach river and Kiến Giang river causing serious pollution to the
water environment.
4.2. Drainage coefficient and drainage demand of South Thai Binh
Irrigation System
4.2.1. Zoning of drainage area
South Thai Binh Irrigation System is divided into 3 drainage polders,
including: i) Area drained into red river of 9,741 ha; ii) Area drained
into Tra Ly River of 8,732 ha; iii) area to be drained by gravity into
the sea through Lân river (Kiến Giang river basin) of 41,309 ha .
4.2.2. Related parameters
1) Rainfall data:
+ Present: basing on the calculation result in Chapter 3 – Thai Binh
station
+ In the future: the study result shows that there is a correlation
between the total rainfall of the annual largest rain to the total rainfall
in rainy season. Basing on the published climate change scenario, it
is tentatively calculated that by 2020 the total designed drainage
rainfall will increase by 3.1 %, in 2050 7.9 % and in 2100 19.1 %
compared to present. That means the model of largest 5 day drainage
rainfall distribution form will be maintained throughout the 21
st
century.
2) Inundation capacity: given the rice planted in the irrigation
system is maintained, we calculate basing on the case that there will
be large rains of design frequency within 30 days after the
cultivating. The inundation level with which the productivity will
not be reduced above 5 %, the Institute of Water Resource Research
18
calculated as follows: inundation level of 275 mm lasts for less than
a day; 200 mm for less than 2 days; 150 mm for less than 4 days.
3) Flow coefficient: for the purpose of doing research, the thesis uses
flow coefficient C for drainage bodies in the irrigation system: e.g.
flower planting land: 0.60; fruit trees: 0.50; urban land: 0.95;
industrial land: 0.90; residential land in rural area: 0.65; ponds and
lake: 0.20; aquaculture ponds: 1.00; regulation reservoir: 0.00; other
land uses: 0.60.
4) Water loss due to infiltration and evaporation: 2.0 mm/day.
5) Other bounding parameters/conditions: the drainage system
should be a complete one from the headwork to on-farm structures.
The on-farm drainage structure should be spillway with free
overflowing regime. The depth of field water before being drained is
10 cm.
6) Land use structure in the system
The thesis studies the change of drainage coefficient under the
impacts of climate change (especially the change of rainfall) in two
cases: i) given the land use structure is maintained throughout the 21
st
century; ii) the land use structure of the system changes all the time
to suit the socio-economic development (industrialization and
urbanization of rural areas).
Table 4.13: Existing land use Status in 2008 and forecasted land use
structure (ha)
Land use
structure
Time
Rice
planti
ng
Sub-
crop
s
Aq
uac
ultu
re
Resi
denti
al
area
Urba
n
area
Indus
trial
zone
Other Total
2008
Area 35,013 3,344 3,826 5,560 1,000 730 10,309 59,782
Ratio % 58.57 5.59 6.40 9.30 1.67 1.22 17.24 100
2020
Area 34,345 3,688 4,107 3,971 2,108 1,819 9,744 59,782
Ratio % 57.45 6.17 6.87 6.64 3.53 3.04 16.30 100
19
2050 Area 32,675 4,547 4,809 0 7,601 1,819 8,332 59,782
Ratio % 54.66 7.61 8.04 0 12.72 3.04 13.94 100
2100
Area 29,891 5,978 5,978 0 10,137 1,819 5,978 59,782
Ratio % 50.00 10.00 10.00 0 16.96 3.04 10.00 100
4.2.3. Calculation results
a) At present period, the average drainage coefficient for 7 days of
drainage is 5.75 liter/second/ha, and the average largest rate in a
drainage period is 11.39 liter/second/ha;
b) If the land use structure change is not taken into account, the
drainage coefficient and designed drainage discharge of drainage
headwork and total water volume to be drained of the system will
increase in proportionally to total volume of the designed drainage
rain;
c) Existing drainage structures and ones recently built all apply
drainage coefficient approximate to 7.0 liter/second/ha, which can
only meet 60 % of the drainage demand. This is a reason to the
increased flooding area in the system.
Table 4.14: Summary of calculation results of preliminary drainage
coefficients at some time points in climate change scenarios – Case
without any change in land use structure
Time
point
Average daily drainage coefficient in day i
(liter/second/ha)
Avera
ge
Increasi
ng ratio
compar
1 2 3 4 5 6 7
2008 3.44 11.39 8.28 9.18 5.34 1.90 0.69 5.75 0.00
2020 3.55 11.74 8.53 9.47 5.50 1.96 0.71 5.92 3.10
2050 3.70 12.24 8.90 9.87 5.74 2.05 0.74 6.18 7.90
2100 4.10 13.56 9.86 10.94 6.36 2.27 0.82 6.84 19.10
20
Table 4.15: Summary of calculation results of preliminary drainage
coefficients at some time points in climate change scenarios – Case
with constant changes in land use structure
Time
point
Average daily drainage coefficient in day i
(liter/second/ha)
Avera
ge
Increa
sing
ratio
1 2 3 4 5 6 7
2008 3.44 11.39 8.28 9.18 5.34 1.90 0.69 5.75 0.00
2020 3.71 12.03 8.49 9.61 5.46 1.93 0.70 5.99 4.25
2050 4.31 13.34 8.76 10.42 5.58 1.91 0.69 6.43 11.91
2100 5.24 15.45 9.33 11.77 5.88 1.94 0.70 7.19 25.09
d) The thesis has studied the shift of rice land into regulation
reservoirs in the case the area of these reservoirs will make up 2.0 %
to 4.0 % of the total area and an average depth of regulated water of
1.0 m. The calculation results show that if the drainage coefficient is
maintained in a range of 7.0 liter/second/ha - 8.0 liter/second/ha at
present and till after 2020. South Thai Binh Irrigation System will
have to reserve a land fund of 3.5 % to 4.0 % of the natural land for
reservoir conversion having depth of 1.0 m at the minimum (in
equivalent to a regulated capacity of 350 m
3
to 400 m
3
of water
storage per ha of catchment area). If the fluctuation ranges in terms
of total drainage rainfall and land use structure are concluded as per
the thesis, with the ratio of regulation reservoir ranging from 3.5% to
4.0% of the natural area of the drainage basin. By the end of this
century, the average drainage coefficient of the whole system will not
exceed 11.0 liter per second per ha.
Table 4.19: Different drainage coefficients at some typical time points
as per climate change scenario corresponding to some regulation
reservoir options –With changing land use structure
Reserv
oir
Time
point
Calculated
drainage
coefficient
Average daily drainage coefficient in day i
(liter/second/ha)
21
1 2 3 4 5 6 7
α
storage
=2% ; H
storage
= 1.0 m ∆
storage
= 2.31 liter/sec/ha
Prese
Preliminary 3.41 11.20 8.04 9.00 5.18 2.33 1.15
Adjusted
3.41 8.89 8.89 8.89 6.75 2.33 1.15
2020
Preliminary 3.68 11.83 8.25 9.41 5.29 2.36 1.18
Adjusted 3.68 9.52 9.52 9.52 6.23 2.36 1.18
2050
Preliminary 4.28 13.13 8.50 10.21 5.41 2.36 1.19
Adjusted 4.28 10.82 10.82 10.20 5.41 2.36 1.19
2100
Preliminary 5.21 15.22 9.05 11.55 5.69 2.44 1.25
Adjusted 5.21 12.91 11.36 11.55 5.69 2.44 1.25
α
storage
=2.5%;H
storage
= 1.0 m ∆
qstorage
= 2.89 liter/sec/ha
Prese
Preliminary 3.41 11.15 7.98 8.95 5.14 2.43 1.27
Adjusted
3.41 8.26 8.26 8.67 8.03 2.43 1.27
2020
Preliminary 3.67 11.78 8.19 9.37 5.25 2.47 1.30
Adjusted
3.67 8.89 8.89 8.89 7.91 2.47 1.30
2050
Preliminary 4.27 13.08 8.44 10.16 5.37 2.48 1.32
Adjusted
4.27 10.19 10.19 10.19 6.48 2.48 1.32
2100
Preliminary 5.20 15.16 8.98 11.49 5.65 2.56 1.39
Adjusted
5.20 12.27 11.87 11.49 5.65 2.56 1.39
α
trữ
=3.0%;H
trữ
= 1.0 m ∆
qstorage
= 3.47 liter/sec/ha
Prese
Preliminary 3.40 11.10 7.92 8.90 5.10 2.54 1.39
Adjusted
3.40 8.15 8.15 8.15 8.15 2.95 1.39
2020
Preliminary 3.67 11.73 8.13 9.32 5.21 2.58 1.42
Adjusted
3.67 8.57 8.57 8.57 8.57 2.69 1.42
2050
Preliminary 4.27 13.03 8.37 10.11 5.32 2.59 1.44
Adjusted
4.27 9.56 9.56 9.56 8.17 2.59 1.44
2100
Preliminary 5.19 15.11 8.91 11.44 5.60 2.69 1.53
Adjusted
5.19 11.64 11.64 11.64 6.14 2.69 1.53
α
storage
= 3.5%; H
storage
= 1.0 m ∆
qstorage
= 4.05 liter/second/ha
Prese
nt
Preliminary
3.39 11.05 7.86 8.85 5.06 2.64 1.50
Adjusted
3.39 7.91 7.91 7.91 7.91 3.84 1.96
2020
Preliminary
3.66 11.68 8.07 9.27 5.17 2.69 1.54
Adjusted
3.66 8.32 8.32 8.32 8.32 3.59 1.54
2050
Preliminary
4.26 12.97 8.31 10.06 5.28 2.70 1.57
Adjusted 4.26 9.10 9.10 9.10 9.10 2.94 1.57
22
2100
Preliminary
5.18 15.05 8.84 11.38 5.55 2.82 1.67
Adjusted
5.18 11.00 11.00 11.00 7.82 2.82 1.67
α
storage
= 4.0%;H
storage
= 1.0 m ∆
qstorage
= 4.63 liter/sec/ha
Prese
nt
Preliminary
3.39 11.01 7.80 8.81 5.02 2.75 1.62
Adjusted
3.39 7.66 7.66 7.66 7.66 4.74 1.62
2020
Preliminary
3.65 11.63 8.00 9.22 5.13 2.80 1.65
Adjusted
3.65 8.08 8.08 8.08 8.08 4.48 1.65
2050
Preliminary
4.25 12.92 8.25 10.01 5.24 2.82 1.69
Adjusted
4.25 8.85 8.85 8.85 8.85 3.84 1.69
2100
Preliminary
5.17 14.99 8.77 11.32 5.50 2.94 1.81
Adjusted
5.17 10.36 10.36 10.36 9.50 2.94 1.81
4.3. CALCULATION OF HYDRAULICS FOR THE RIVER
NETWORK
4.3.1. Selection of hydraulic calculation models
As a basis for drainage hydraulics calculation, the thesis studied
following mathematical models: VRSAP of the late Prof.Nguyen
Nhu Khue; SAL of Ass.Prof. Nguyen Tat Dac; KOD of Dr.Prof.
Nguyễn Ân Niên; WENDY of Delft (Netherlands); TLID+
ECOMOD of the Institute of mechanics of the national center for
natural science and technology in coordination with Prof. Nguyen
Kim Dan of Caen university institute – France; family of MIKE 21
and MIKE 11 models of Dutch Hydraulics Institute (DHI). Basing
on the analysis of strengths and weakness of the above mentioned
models, the thesis selects MIKE 11 model for calculation.
4.3.2. Calculation results
Table 4.24: Increased rainfall affecting drainage coefficient in
gravity drainage sub-region through Lan sluice in some regulation
reservoir options
T
T
Time
point
Increasi
ng
rainfall
(%)
Without
reservoir
With reservoir, H
storage
= 1,0 m
q
∆q
increa
α
storage
= 2,0% α
storage
= 3,0% α
storage
= 4,0%
q
(liter/s
∆q
increase
q
(liter/s
∆q
increa
q
(liter/s
∆q
increa
23
(liter/s
ec/ha)
sed
(%)
ec/ha) d (%) ec/ha)
sed
(%)
ec/ha)
sed
(%)
a
Without land use structure change:
1 At present 0.00 11.39 0.00 8.89 0.00 8.15 0.00 7.66 0.00
2 2020 3.10 11.74 3.10 9.23 3.82 8.44 3.56 7.95 3.79
3 2050 7.50 12.24 7.50 9.73 9.45 8.85 8.59 8.35 9.01
4 2100 19.10 13.56 19.10 11.03 24.07 9.93 21.84 9.42 22.98
b With land use structure change due to rural industrialization and
urbanization
1 At present 0.00 11.39 0.00 8.89 0.00 8.15 0.00 7.66 0.00
2 2020 3.10 12.03 5.62 9.52 7.09 8.57 5.15 8.08 5.48
3 2050 7.50 13.34 17.12 10.82 21.71 9.56 17.30 8.85 15.54
4 2100 19.10 15.45 35.65 12.91 45.22 11.64 42.82 10.36 35.25
Table 4.27: Water levels at some “node” locations along Kiến
Giang arterial canal at key time points in Climate change scenario
TT Time
Phúc
Khánh
Kiến Giang -
Hoàng Giang T-
junction
Kiến Giang-
Cổ Rồng
junction
Lân 1 - Lân
2 junction
1 HTR 2.13 1.79 1.63 1.57
2 2020 2.19 1.88 1.72 1.68
3 2030 2.26 1.94 1.78 1.73
4 2040 2.31 1.99 1.85 1.80
5 2050 2.37 2.07 1.92 1.89
6 2060 2.44 2.15 2.00 2.00
7 2070 2.53 2.26 2.11 2.10
8 2080 2.62 2.38 2.24 2.20
9 2090 2.73 2.50 2.38 2.30
10 2100 2.83 2.62 2.50 2.43
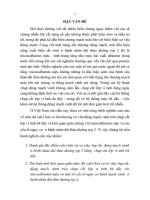
24
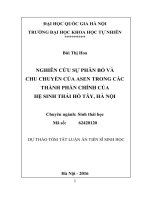
5 DAYS INUNDATION RATIO CORRESPONDING TO CLIMATE CHANGE SCENARIO
IN THE PRESENT TIME OF SOUTH THAI BINH REGION
Figure 4.14
Figure 4.15
Figure 4.16
Table 4.29: Duration in which water can be drained by gravity into
the sea corresponding to different time points in climate change
scenario – Medium emission scenario
Calculation items HTR 2020 2050 2100
Sea level rise (cm) 0 12 30 75
Drainage duration (hours/ per day) 17.86 17.43 17.14 16.29
Table 4.30: Drainage demands and actual drainage capacity of
hydraulic works in Kiến Giang river basin corresponding to different
time points in climate change scenario – Medium emission scenario
No. Calculation parameters Current 2020 2050 2100
1 Sea level rise (cm) 0 12 30 75
25
5 DAYS INUNDATION RATIO CORRESPONDING TO CLIMATE CHANGE SCENARIO
BY 2050 OF SOUTH THAI BINH REGION
5 DAYS INUNDATION RATIO CORRESPONDING TO CLIMATE CHANGE SCENARIO BY
2100 OF SOUTH THAI BINH REGION