đánh giá sức cản động mạch phổi (pvr) bằng phương pháp siêu âm- doppler tim ở bệnh nhân hẹp hai lá (hhl) khít trước và sau nong van bằng bóng bản tóm tắt tiếng anh
Bạn đang xem bản rút gọn của tài liệu. Xem và tải ngay bản đầy đủ của tài liệu tại đây (181.71 KB, 24 trang )
POSITION OF THE PROBLEM
1- Importance of the problem:
Mitral stenosis (MS) is the situation that occurs when the
mitral commissures are sticked together inducing diastolic narrowing
of the mitral opening surface, impeding thus blood flow from the left
atrium (LA) into the left ventricle (LV), hence increasing left atrial
pressure, and in the long term, increasing pulmonary capillary
pressure due to swollen pulmonary veins, then increasing pulmonary
pressure (PP), and pulmonary vascular resistance (PVR), leading to
right ventricular overload, finally right ventricular failure.
Percutaneous transmitral commissurotomy (PTMC) is an effective
method of non surgical enlargement of the mitral opening surface.
World literature showed an important role of PVR in the
pathophysiology of MS, that contributes to the assessment, follow-up
of treatment and prognosis, being the most sensitive indice of
assessment of the diseased pulmonary artery. Some studies found the
reversibility of PVR, but PVR might remain fixed though surgery or
PTMC have been carried out, and the prognosis in those patients was
worse than in those with reversible PVR. In the contrary, quite a few
number of patients have seen their PVR and pulmonary artery
pressure (PAP) notably decreased after successful procedures,
surgical or with PTMC.
Cardiac catheterization was the only method of assessment of
PVR, but the procedure is invasive that could not be performed in
any Health center, and repeated several times on the patient. Since
1980, non invasive assessment of PVR with cardiac Doppler
ultrasound has been carried out, but in Vietnam so far, such a method
1
has not been studied, in patients with tight MS as well as the follow-
up of post PTMC.
Our work: “Assessment of pulmonary resistance with cardiac
Doppler ultrasound in patients with tight mitral stenosis pre and
post PTMC” has been carried out with the following objectives:
1. To study the PVR in patients with tight MS with Doppler
cardiography (with head to head comparison with the PVR as
in cardiac catheterization) and with a number of factors related
to PVR.
2. To study changes of PVR post PTMC and a number of
influencing factors.
2- Contributions of this thesis
This is the first scientific work ever with a systematic study of
PVR with Doppler cardiography in patients with tight MS treated
with PTMC. This is a simple procedure, easy to perform, and
susceptible to contribute to assessing post PTMC results in patients
with tight MS. The results may broaden the use of Doppler
cardiography in provincial polyclinics having their department of
Cardiology.
PRESENTATION OF THE THESIS
The thesis comprises 115 pages in size A4, repartitioned in 4
chapters, dealing with 2 pages for Position of the problem, 30 pages
for the Overview, 17 pages for the Material and Method, 32 pages for
the Study results, 32 pages for the Discussion, 1 page for the
Conclusions, and 1 page for the Recommendations.
2
CHAPTER I
OVERVIEW
1.3. Pathophysiology of MS
Pathophysiological changes vary following the severity of MS:
1.3.1. Increased transmitral gradient
1.3.2. Decreased transmitral blood flow and decreased cardiac
output
This decrease is mainly due to mechanical cause following
severe MS, and not LV failure.
1.3.3. Increased PVR and PP
LA pressure is usually not markedly increased with mild or
moderate MS. The mean LA pressure (mLAP) is usually>10mmHg,
sometimes 15-20 mmHg with tight MS. When the mitral stenosis is
important, the increased LAP wil be followed by increased
pulmonary veins and capillaries, and increased PAP (reactionary
pulmonary hypertension, or post capillary pulmonary hypertension).
The ever increase of PAP will induce retraction at the level of
pulmonary arterioles, a reaction to pulmonary hypertension, thus
induce increased PVR, and increased PP (this is now mixed
pulmonary hypertension, both pre and post capillary). Pre capillary
pulmonary hypertension is related to pulmonary arteriolar lesions, a
consequence of reactionary retraction of pulmonary arterioles to the
increase of LA and pulmonary pressures. The prolonged retraction
will have deleterious consequences on the pulmonary arterioles and
alveolar arterioles, leading to restructuring and fibrosis of the
arteriolar walls, hence irreversible lesions at this level. The final
result is, a second barrage from pulmonary arterioles is formed in
3
addition to the impeded LA-LV blood flow due to MS, that is called
“the second barrage” or “the second stenosis”. Former belief was that
any intervention would exert little impact on the outcome of MS at
this stage, but clinical findings and a number of studies have shown
improvement with time following the procedures on MS
1.3.4. Changes in the stress test
Only severe MS present with major changes in the stress test.
1.3.5. Changes in the LA
Prolonged increased LA pressure induces dilated LA,
structural changes in the LA wall, that favours atrial fibrillation, and
the formation of thrombus, a cause of stystemic embolization.
1.3.6. Changes in the RV
The RV increases contractions for ensuring necessary blood
supply for the body when the pulmonary pressure and resistance are
elevated, resulting in RV hypertrophy, RV dilatation, tricuspid
regurgitation induced by dilatation of the tricuspid ring (TR).
1.3.7. Changes in the LV
Around 25-30% of patients present with slight decrease of LV
function, probably due to long term decrease of blood flow into the
LV.
1.5. MS manifestations in the clinic and laboratory
1.5.1. Clinical manifestations: Dyspnea, cardiac asthma and acute
pulmonary edema, hemoptisis.
1.5.2. Laboratory
1.5.2.1. EKG: Possible LA hypertrophy, righ axis deviation, RV
hypertrophy, atrial fibrillation is fairly common.
4
1.5.2.2. Chest Xray: Prominent cardiac left border with presence of
4 arches, pulmonary vascular congestion, presence of esophageal
compression at inferior 1/3
rd
with barium ingestion.
1.5.2.3. Cardiac Doppler ultrasound: A very important exploration.
a. TM mode: In most cases of tight MS, the EF diastolic slope
is < 15mm/sec.
b. 2D mode : Allows direct assessment of mitral orifice,
commonly used as the result is close to the mitral anatomy.
c. Trans Esophageal Echography (TEE): Allows detect
intraatrial and intra appendage thrombus more easily, and favours
more accurate assessment of valvular and subvalvular lesions.
d. Doppler ultrasound : Of particular importance in the
assessment of the severity of MS
- Assessment of mitral valve area with pressure half time
(PHT).
- Assessment of the MS severity with transmitral pressure
gradient.
e. Ultrasound stress test
The test is indicated in case of symptoms present but tight MS
is not found with echo at rest, or symptoms absent but tight MS is
found with echo.
- Asessment of valve and subvalvular anatomy in MS:
Wilkins score (Table 1.2).
For isolated MS, the optimal Wilkins score for indicating
PTMC is ≤ 8.
The procedure should be discarded if Wilkins ≥ 11, for the
patient’s safety.
1.6. Treatment for MS: Medical, surgical, and PTMC.
5
1.7. Methods of assessing PVR
1.7.1. Catheterization
PVR is calculated as follows:
PVR = (PAPm – LAPm)/Qp (Woods Units – WU)
PAPm:mean pressure of PA (mmHg), LAPm:mean pressure of
LA (mmHg),
Qp: pulmonary blood flow (l/min).
In case of no intracardiac shunt, Qp is considered equal to
systemic output.
Two often used methods of assessment of cardiac output :
Thermal dilution and Fick’s method.
1.7.2. Cardiac Doppler ultrsound
A host of studies have been carried out for assessing PVR with
cardiac Doppler ultrasound; in 2003, in the USA, Abbas AE et al
gave the following formula as the result of their study:
PVR = TRV / TVIrvot x 10 + 0.16
PVR: Pulmonary vascular resistance – in Woods units
TRV: Maximal velocity of tricuspid regurgitant jet – in m/sec
TVIrvot: integral of time velocity at the right venticular
outflow tract – in cm.
The formula has been included into Harvey Feigenbaum’s
2005 teaching program of ultrasound, and has been used by several
authors in the assessement, follow-up of results of treatment of
pulmonary hypertension, of capability to strain of MS patients, as
well as in patients with organ grafting.
1.8. Relationship between PVR and involved parameters
In 1997, Kim et al found a correlation between PVR and mitral
orifice surface (r = -0.54) and the level of dyspnea NYHA. The
6
authors did not find any correlation between PVR and age, gender,
and pre PTMC of mitral valves regurgitation.
In 1999, Gamra et al found that in elderly patients, AF, high
Wilkins’scoring, are risk factors having negative impact on the return
to normal of PVR.
CHAPTER 2
MATERIAL AND METHOD
2.1. Material
204 patients with tight MS have been PTMCed with Inoue
balloon at Viet Nam Heart Institute (VNHI), and the control group of
116 normal adults with similar repartition in age range, and gender.
Duration of study: 7/2006 – 8/2008.
2.1.1. Selection criteria
- Tight MS (MVA < 1.5cm
2
) and symptoms present (NYHA ≥ II).
- Wilkins score ≤ 10.
- Absence of LA thrombus on transthoracic echo (in patients
on sinus rhythm) or TEE (in AF or high risk of having thrombus).
- Isolate tight MS or tight MS with mild Mitral regurgitation
(MR) or mild Aortic regurgitation (AR).
2.1.2. Exclusion criteria
- Heavily diseased mitral valve and sub- valvular tissue
(heavily thickened valves, important calcification, serious
morphological changes, quite shortened chordae tendinae…) with
Wilkins score >10.
- LA thrombus.
- Anamnesis of embolization within 3 months, even without
echo findings.
7
- Concomitant respiratory diseases (bronchial asthma, COPD),
Systemic diseases…and other diseases inducing pulmonary
hypertension.
- Concomitant Tricuspid stenosis
- Absence of TR or very mild TR not allowing the
measurement of regurgitant spectrum maximal velocity.
- MVA < 1.5cm
2
after PTMC.
2.2. Method of study
2.2.1. How to devise the study: Longitudinal, cross-sectional study.
2.2.2. Steps undertaken
All individuals involved in the study have been scrutinized
clinically and laboratory data with transthoracic echo according to
prepared file. TEE is added for all cases with AF to ascertain/ rule
out the presence of LA thrombus.
- All cases with an indication for PTMC have been chosen
after consultation at VNHI.
- Clinical examination and cardiac ultrasound re-checked 24hrs
before PTMC.
- All cases have been PTMCed with Inoue balloon at VNHI
cathlab.
- 34 patients with tight MS have been catheterized prior to
PTMC.
- Clinical and cardiac Doppler ultrasound rechecks: Post
PTMC: 24 hours, 3 months, 6 months, 1 year.
2.2.3. How to carry out cardiac Doppler ultrasound
- The examination has been carried out at VNHI echo lab.on
ALOKA 5000, 2 transducers: 2.5 and 5MHz, M, 2D, Doppler
(pulsed, continuous, colour coded).
8
Cardiac Doppler ultrasound parameters:
M mode: Parameters related to cardiac morphology and
function (ACC criteria).
2D mode: Assessment of the morphology of valves,
subvalvular area, valvular commissures.
Assessment of MVA (left side of sternum, short axis)
Cardiac Doppler ultrasound:
MVA: PHT method.
Pressure gradients: Max and Mean
Assessment of MR : 3 levels of severity.
Assessment of TR : 3 levels of severity.
Assessment of Pulmonary pressure (PP) based on 4 chamber
axis with continuous Doppler ultrasound transducer from the cardiac
apex.
PAPs = (TRV)
2
+ RAPs
PAPs = pulmonary systolic pressure (mmHg)
RAPs = RA systolic pressure
TRV = Maximal velocity of TR spectrum (m/sec)
As RAPs is estimated 10mmHg, then PAPs = (TRV)
2
+ 10
(mmHg)
Based on the pulmonary systolic pressure, we have 3 levels of
Pulmonary hypertension (PH) (fig 2.6).
- PH as by measuring the maximal velocity of the TR
spectrum (Fig. 2.7).
- PH as by assessing the time integral velocity of blood flow
at the RVOT (TVIrvot): Location: left side of sternum, short axis,
using pulsed Doppler.
• Assessment of PVR with cardiac Doppler ultrasound:
Using the Abbas Amr E : PVR = TRV/TVIrvot x 10 + 0.16
9
2.3. Data processing
a. Medical statistical method using software SPSS 15.0
b. The results are presented as the mean ± standard deviation
(for variants) or % (with logic variants)
c. Paired t test used for comparing pre and post PTMC results.
Statistical significance when p<0.05
d. r is the correlation coefficient :
- │r│< 0.3 : Weak correlation
- 0.3 < │r│< 0.5 : Moderate correlation
- 0.5 < │r│< 0.7 : Strong correlation
- │r│> 0.7 : Very strong correlation
CHAPTER 3
RESULTS
3.1. General features of the material of study
From 7/2006 to 8/2008, 320 individuals pertaining to similar
age range, and gender, and belonging to 2 groups: Patients’ group
comprising 204 patients with tight MS, being PTMCed at VNHI and
Control group with 116 healthy individuals.
3.1.1. Demographics of the Patients’ group (MS)
Table 3.8. Demographics of the tight MS group
Parameters
Value (
X
± SD) or n (%)
Age (years) 39.44 ± 10.79 (15 – 76)
Gender F/M 165/39
Past history of commissurotomy (Surg/PTMC) 34 (16.7%)
Stroke in the anamnesis 13 (6.3%)
Rheumatic fever 31 (15.2%)
Heart pulse (c/min) 91.79 ± 16.90
Sinus rhythm 120 (58.8%)
Atrial fibrillation 84 (41.%)
3.1.1.1. Age range and gender
10
The mean age in the MS group is 39.44 ± 10.79 (15 – 76 yrs),
Females: 81%, 4.2 times of Males (Table 3.8).
3.1.1.2. Occupation: 53.4% are peasants.
3.1.1.3. Start of symptoms before admission (Table 3.11):
Only 4.5% are aware of the time when symptoms started.
3.1.2. Clinical and laboratory features
3.1.2.1. Functional symptoms (Table 3.12) Most patients are at
NYHA II stage (51%).
3.1.2.2. Physical findings (Table 3.13). In almost all patients, S1 is
short and accentuated, rumbling diastolic murmur, S2 accentuated
and/or splitted, a sign rather common in tight MS.
3.1.2.3. A-P Chest Xray
130 cases (63.7%) presented with accentuated hilum, dilated
2
nd
left arch.
3.1.2.4. EKG
58.8% are in sinus rhythm, 58.3% have right axis deviation,
and 53.4% Right Ventricular Hypertrophy (RVH).
3.1.2.5. Some common Doppler echocardiography features
Table 3.15. Doppler echocardiography in the MS group (n = 204)
Parameters
Value (
X
± SD) or n (%)
Mean of Wilkins scoring 7.8 ± 0.88 (6 – 10)
Wilkins ≤ 8 166 (81.4%)
Wilkins > 8 38 (18.6%)
Concomitant mild MR 155 (75.9%)
Concomitant mild AR 36 ( 17.6%)
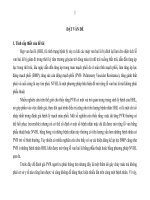
3.2. Head to head comparison of Doppler echocardiography
versus catheterization data of PVR (Table 3.17). Strong
correlation, as shown by y = 0.79x + 2.03 (r = 0.92; CI = 95%).
3.3. Doppler echocardiography for assessing PVR
11
3.3.1. Doppler echocardiography in both groups
Table 3.18 shows clear cut higher values of PVR in the MS
group as compared to the control group.
3.3.2. Factors involved in PVR elevation in the pre PTMC group
3.3.2.1. MVA (on 2D mode)
Moderate inverted linear correlation with r = - 0.41.
3.3.2.5. NYHA level (Table 3.24): PVR in group NYHA II is lower
than in group NYHA III-IV, with statistical significance p< 0.05.
3.3.2.6. Atrial Fibrillation (Table 3.25): PVR in AF group is
strikingly higher in group with sinus rhythm p< 0.001.
3.3.2.8. Pulmonary systolic pressure
Strong linear correlation between PVR and pulmonary systolic
pressure r = 0.69.
3.4. Changes in clinical and Doppler echocardiography data right
after PTMC
3.4.1. Changes in functional symptoms (Table 3.27): After PTMC,
patients with NYHA I increase to 29.9%. while those with NYHA
IV decrease to only 1 patient (0.5%).
3.4.2. Changes in physical findings (Table 3.28): Net decrease in
hepatomegaly, tachycardia
3.4.3. Changes in Doppler echocardiography right after PTMC
3.4.3.1. Changes in MVA and hemodynamic parameters
Very early better changes of measured parameters in cardiac
Doppler ultrasound right after PTMC (24 hours, particularly PVR).
3.4.3.2. Changes in MR (Table 3.30)
12
Most patients showed increased MR as compared to pre
PTMC, but their MR was within acceptable limits (mild or moderate)
3.4.3.3. Changes in TR
Serious TR decreased notably right after PTMC, increasing
thus cases with mild TR (p <0.001).
3.5. Changes of functional symptoms and Doppler
echocardiography with time
3.5.1. Changes of functional symptoms (Table 3.32)
Most cases improved their NYHA into level I, only 0.5%
remain at NYHA IV
3.5.2. Changes of Doppler echocardiography parameters with
time (Table 3.33)
Table 3.33. Doppler echocardiography pre and post PTMC,
with follow-up time
Remarks : During consecutive months to PTMC, MVA, LA-
LV maximal gradient pressure, mean gradient pressure, remain fairly
stable. Hemodynamic as recorded with the cardiac Doppler method
appeared improved not only during 24 hours of post PTMC but also
during consecutive months of follow-up. One year after PTMC, PVR
notably decreased as compared to immediate post PTMC parameters
with p< 0.001.
Table 3.35. Changes of PVR pre and post PTMC in mild PAH
group (PAPs < 40mmHg) (n = 36)
Right after PTMC, PAPs and PVR decreased with statistical
meaning (p< 0.05).
13
PAPs and PVR kept decreasing down the road. After 1 year,
PAPs and PVR returned to normal as compared to the control group
(p> 0.05).
Table 3.36. Changes of PVR prior to and after PTMC in
moderate PAH group (40 ≤ PAPs < 60mmHg) (n = 90)
PAPs and PVR continue to decrease at measuring times post
PTMC. Right after PTMC, the decrease of PAPs and PVR > 20%,
PAPs and PVR continued to decrease after 1 year but remained
higher than the control group (p < 0.001).
Table 3.37. Changes of PVR pre and post PTMC in serious
PAH group (PAPs ≥ 60mmHg) (n = 78)
Remarks: Right after PTMC, PAPs and PVR strongly
decrease > 36%, PAPs and PVR continue this trend after 1 year, but
remain higher than the control group (p< 0.001).
Table 3.38. Changes of PVR in PAPs > 110mmHg group (n = 5)
Remarks: Even with high PAPs (PAPs > 110mmHg), right
after PTMC and 1 year later, PAPs and PVR strongly decreased as
compared to before PTMC, but, after 1 year, both remained notably
higher than the control group. (p< 0.001).
3.5.3. Factors involved in post PTMC changes
Till 1 year post PTMC, there remained 118 patients for follow-up.
Table 3.39. General parameters 1 year post PTMC
Parameters
Value (
X
± SD) or n (%)
Number of patients 118
Mean age range (years) 39.22 ± 9.90 (15 – 62)
14
Gender F/M 103/15 (87.3% & 12.7%)
Mean Wilkins scoring 7.81 ± 0.75 (6 – 10)
Wilkins ≤ 8 94 (79.6%)
Wilkins > 8 24 (20.4%)
Sinus rhythm 83 (70.3%)
Atrial fibrillation 35 (29.7%)
NYHA
II 87 (73.7%)
III 25 (21.2%)
IV 6 (5.1%)
Mild MR 81 (68.6%)
PVR is assessed right before and 1 year after PTMC, and the
difference is ∆PVR.
Below are the parameters being found:
3.5.3.1. Pre PTMC MVA
There is reverse linear correlation between ∆PVR and MVA (r
= -0.35).
3.5.3.2. Age range (Table 3.41): ∆PVR is higher at age range < 50
years with significant statistical value than age range ≥ 50 years.
3.5.3.3. Pulmonary systolic pressure
There is linear correlation between ∆PVR and PAPs pre
PTMC, as shown in the equation: y = 0.0378x – 0.7412 with r = 0.61.
3.5.3.4. Wilkins score (Table 3.42): ∆PVR is different statistically
between the Wilkins ≤ 8 group and Wilkins > 8 group.
3.5.3.5. Atrial fibrillation (Table 3.43): ∆PVR in sinus rhythm is
statistically different from atrial fibrillation (p < 0.05).
3.5.3.6. Post PTMC MR (Table 3.44): In 4 patients with important
MR. Although PVR decreased right after PTMC, but with no
15
statistical significance. The PVR virtually had no change in the
following months.
CHAPTER 4
DISCUSSION
4.1. General features of patients
4.1.1. General features regarding age range and gender
Mean age is 39.44 (15 – 76 yrs), females: 81% and males:
19%. The age range of our patients is similar to other authors’.
4.1.2. Clinical features
Most patients had NYHA II dyspnea level (51%), the
remaining were at NYHA III (41.6%)
and NYHA IV (7.4%). As compared to other authors’, our
NYHA III-IV category was lower.
4.1.3. A-P chest Xray
130 /204 cases (53.7%) had dilated 2
nd
left arch.
4.1.4. EKG in the MS group
41.2% had AF, this percentage is similar to Iung’s study (AF :
40%) and Meneveau (43%).
4.2. PVR on Doppler echocardiography versus catheterization
The standard method of assessing PVR is right heart
catheterization, measuring pulmonary out put and PAP, but, this is an
invasive method, causing pain, and eventual risks as infection,
arrhythmias, so that the procedure could not be repeated permanently
and performed at any location.
PVR as assessed by Doppler echocardiography is simple to
carry out, and has proved reliable, yielding accurate results as with
16
catheterization. On 34 cases with MS and indicated for PTMC (Table
3.17), PVR with Doppler is 3.29 ± 0.97 WU, while with
catheterization, the value is 3.73 ± 1.02 WU, and there is no
statistical meaning as p = 0.07. The correlation between the 2
methods is very strong (r = 0.92) (Fig 3.3). Similar results have been
found with other authors.
4.3. Doppler echocardiography results
4.3.1. Features of Doppler echocardiography in the MS group
versus the control group
It has been the first time ever that the method is applied on MS
patients, with the value of PVR = 3.27 ± 1.37 WU, while in the
control group, it is 1.52 ± 0.22 WU, and PVR of the tight MS group
is markedly higher than in the healthy group.
4.3.2. Correlation between PVR and a number of parameters
4.3.2.1. MVA
Fig 3.4 shows reverse linear correlation between PVR and
MVA (r = - 0.41).
4.3.2.5. NYHA level
Table 3.24 shows PVR in group NYHA III- IV is higher than
in group NYHA II with statistical significance, similar to Gorlin’s,
Kim’s, Koide’s.
4.3.2.6. Atrial fibrillation
In the AF group, PVR is markedly increased the sinus rhythm
group (4.0 ± 1.66 WU; p< 0.05) (Table 3.25).
4.3.2.7. Wilkins score
Table 3.26 shows there is no significant difference in the PVR
between the Wilkins ≤ 8 group and Wilkins > 8.
4.3.2.8. Pulmonary systolic pressure
17
There is a relatively strong linear correlation between PVR and
PAPs (r = 0.69) (Fig 3.7)
4.4. Assessment of immediate post PTMC results
4.4.1. Changes of clinical parameters right after PTMC
4.4.1. 1. Changes of functional symptoms
Table 3.27 shows very early improvement of functional
symptoms immediately after PTMC, NYHA in 61 patients (29.9%)
decrease to level I.
4.4.1.2. Changes of physical signs
Table 3.28 shows parallel improvement of NYHA level with
marked subsidence of signs of heart failure: hepatomegaly,
tachycardia.
4.4.2. Changes of Doppler echocardiography right after PTMC
4.4.2.1. Changes of MVA and tranmitral pressure gradient
Table 3.29 shows drastic decrease of transmitral pressure
gradient, and marked increase of MVA (from 0.96cm
2
into 1.7cm
2
).
4.4.2.2. Changes of PVR on Doppler echocardiography
Table 3.29 shows within 24 hours post PTMC, a net decrease
of PAPs and PVR (p < 0.001). This has equally been found by many
authors.
4.4.2.3. Changes of MR level
Most patients developed post PTMC MR by at least 1 level
(Table 3.30), but showed net decrease of dyspnea, particularly, on
Doppler echocardiography, there was net decrease of PAPs and PVR.
4.4.2.4. Changes of TR level
In our study, moderate to serious TR made up 48% (moderate
TR: 25.5%, serious TR: 22.5%) (Table 3.31). Several studies showed
gradual decrease of TR with time of follow-up in the majority of
18
PTMCed MS. This is an important parameter for assessing the result
of treatment.
4.5. Follow up of treatment
4.5.1. Clinical evolution
Table 3.32 shows a rather stable evolution after 1 year, in
gunctional symptoms, in NYHA as compared to immediate post
PTMC result.
4.5.2. Changes of PVR on Doppler echocardiography
4.5.2.1. Changes of PVR in consecutive months
Table 3.33 shows a seady decrease of PVR not only 24 hours
post PTMC, but also 3, 6, months, and 1 year (p< 0.001). Our results
are similar to world literature.
4.5.2.2. Changes of PVR for various levels of PAPs hypertension
Table 3.35, shows: in mild PAPs hypertension group, PAPS
and PVR decrease with significant statistical meaning within 24
hours post PTMC. After 1 year, PVR and PAPs decrease till the
figures similar to the control group (p> 0.05).
Table 3.36, Table 3.37 show: in moderate and severe
pulmonary hypertension groups, PAPs and PVR strongly decrease
within 24 hours post PTMC, with statistical significance. It is
noteworthy that in severe hypertension PAP groups (> 110mmHg)
(Table 3.38) PAPs and PVR continued to fall down, even with
greater celerity: 40.47% for PVR and 48.69% for PAPs. After 1 year,
PVR decreased by 54.60%, and PAPs by 55.62%. The remark has
been: The higher PAPs and PVR pre PTMC, the decrease of their
values is more important. We found similar remarks from a number
of other authors.
19
We can therefore draw this conclusion: A very high pulmonary
pressure does not preclude PTMC in tight MS when there is no
contraindication. Increased PVR in MS may be related to 3 following
mechanisms: LA increased pressure due to mitral valve narrowing,
reacting pulmonary arterioles constriction inducing their remodeling:
those 2 first mechanisms could be fully corrected if the mitral orifice
is enlarged by treatment, while remodeling is conducive to fixed
PVR. Some authors obtained lung biopsies in patients with MS, and
found that most patients were at the 3
rd
stage of the disease
(according to Heath & Edwards classification). and below. A
question may be put forwards: Why PVR could decrease so fast in
patients with tight MS and PTMCed? The phenomenon may be
explained by the pulmonary arteriolar constrictive factor that occurs
in tight MS, a very important factor that is elevating PVR before
remodeling occurs! With remodeling already set up, PVR does not
decrease. Nishikimi et al carried out the dosage of Adrenomedullin (a
very strong vasodilating peptide), and found a markedly higher
content of blood Adrenomodullin in patients with MS, the substance
is markedly reduced 1 week after PTMC, and the author concluded
that this phenomenon helps reduce the increase of PVR in MS.
From this study, we find that pulmonary vasoconstriction plays
a very important role in PVR increase. We assume that most patients
eligible for PTMC were at stage III downward (reversible stage if
MVA is being enlarged), therefore, PVR might decrease with PTMC,
even when pulmonary hypertension is important.
4.5.3. Evolution of MR and TR
4.5.3.1. Evolution of MR
20
1 year follow-up did not disclose aggravation of MR, a number
of patients had it even milder.
4.5.3.2. Evolution of TR
Right after PTMC, TR decreased notably, and continued to do
so during consecutive months. Most cases of TR were functional, and
subsided after PTMC. There appeared 4/46 patients who did not
improve after PTMC, (those patients had a mean tricuspid regurgitant
area as wide as 15cm
2
) and marked dilatation of the RV.
4.5.4. Post PTMC involved factors in PVR changes
4.5.4.1. Pre PTMC MVA
Fig 3.9 shows: moderate inverse linear correlation between pre
PTMC ∆PVR and MVA (r = - 0.35). Table 3.40 may give partial
explanation for the phenomenon. As MVA enlargement of very tight
and moderately tight MS does not differ notably with PTMC,
therefore, the decrease of pressure gradient is greater in the very tight
MS group as compared to the moderately tight MS group. The initial
cause of increased PVR in MS is the increasing LA pressure due to
MS, thus, a rapid decrease of LA pressure will be reflected in the
decrease of PVR.
4.5.4.2. Age range
Table 3.41 shows statistical difference (p < 0.05) between < 50
years and ≥ 50 groups. We postulate the causes of more rapid
decrease of PVR in the < 50 years group than in the ≥ 50 that, the
first one, as shown in Table 3.21, MVA in the ≥ 50 years group tend
to be greater than in the < 50 years group, this may influence the
slower PVR decrease in those ≥ 50 years. The second cause, as
shown in Table 3.9, PVR is increasing with age, and the difference is
statistically meaningful in the ≥ 50 years group. We think these
21
causes may be combined, that result in slower decrease of PVR post
PTMC in the ≥ 50 years group.
4.5.4.3. Pre PTMC PAPs
In MS, increased PAP and increased PVR are progressing
linearly: In post PTMC, PVR and PAP strongly decrease, the higher
PAP before PTMC, the more markedly PVR and PAP are decreasing.
Fig 3.11 shows a fairly good correlation between ∆PVR and pre
PTMC PAP (r = 0.61).
4.5.4.4. Wilkins scoring
Table 3.42 shows statistical meaning difference between the 2
groups: Wilkins ≤ 8 and Wilkins > 8. For the Wilkins > 8 group, post
PTMC MVA is statistically smaller than that in the Wilkins ≤ 8
group (p< 0.05). Therefore, PVR in the Wilkins > 8 group decreases
at slower rate than in the Wilkins ≤ group. Similarly to Gamra’s
study, our finding shows the Wilkins scoring is an influencing factor
on the return to normal of PVR.
4.5.4.5. Atrial fibrillation
Table 3.43 shows the difference between ∆PVR in the AF and
sinus rhythm groups, namely, AF is a negative factor for the
decrease post PTMC of PVR. The finding of post PTMC MVA in the
AF group seems smaller than in the sinus rhythm group, but there is
no statistical meaning (Table 3.43). Thus, PVR in the AF group is
decreasing at slower rate than in the sinus rhythm group, not because
of the smaller increase of MVA post PTMC. The cause might be
more marked improvement of atrial contractility in patients in sinus
rhythm than in those with AF, PAP and PVR are decreasing faster
than in the AF group. Our remark is similar to Gamra’s: AF is a
negative factor for the return to normal of post PTMC PVR.
22
4.5.4.6. Post PTMC MR
2 patients with severe MR ( those cases have been sent to
surgery within 24 hours after PTMC) had not their PVR decreased, 8
patients had severe MR remain with only minor decrease of PVR (2
of those have been operated on for mitral prosthesis). After 1 year
follow-up, we could carry out examination on 4 patients, the others
were lost for follow-up. Table 3.44 shows the evolution of their PVR:
Pulmonary resistance decresed right after PTMC, but not statistically
significant, in the consecutive months, PVR did not decrease. This
might be explained by MR Pathophysiology: Major MR induces LA
pressure, and in the long term, increases pulmonary hypertension,
and PVR. As the patients have been PTMCed, right after the
procedure, PVR decreses as LA pressure decreases with PTMC, but,
afterwards, as regurgitation from the LV into the LA is continuing,
that induces increased PAP, and PVR again. Our remark coincides
with other authors.
In the patients group we have been able to follow-up 1 year, 3
of them had their PVR markedly decreased right after PTMC, but,
during follow-up, PVR did not change as compared to post PTMC,
those 3 cases presented with evolutive MS, with increased symptoms:
dyspnea, decresed MVA (< 1.2cm
2
on Doppler echocardiography).
Our final remark is: Successful post PTMC in MS presents
with better outcome, the NYHA grading is lowered, PAP decreased,
especially PVR. Even for cases with tight MSpresenting with
increased PAP, and PVR, PTMC has been beneficial, even though
still in the fairly upper limits.
CONCLUSION
23
From our study on 204 patients with tight MS as compared
with 116 healthy individuals in the same age range and gender
proportion control group, the following conclusions are given:
1. Pulmonary resistance (PVR) as assessed with Doppler
echocardiography in MS cases is 3.23 ± 1.33 WU (Wood units),
markedly elevated as compared to 1.52 ± 0.22 WU (p< 0.001) in the
normal group.
• There is strong correlation between PVR with Doppler
echocardiography or with catheterization (r = 0.92).
• There is inverse linear correlation between PVR and MSA (r =
- 0.41) and linear correlation with PAPs (r = 0.69).
• Factors that may be involved in the increase of PVR in tight
MS: NYHA > II, AF, Age range, gender, time of occurrence of
symptoms, Wilkins scoring, seem not related to the increase of
PVR.
2. Statistical meaning of PVR decrease occurs within 24 hours after
PTMC (From 3. 27 ± 1.37 WU down to 2.26 ± 0.80 WU) and
continues down the road in consecutive months (1.97 ± 0.45 WU)
after 1 year follow-up. In particular, for those patients with pre
PTMC mild pulmonary hypertension, PVR returns to normal after 1
year follow-up.
• The higher pre PTMC PAPs the faster post PTMC decrease of
PVR is.
• The smaller pre PTMC MVA, the faster post PTMC decrease
of PVR is.
• Post PTMC PVR has been minimal in case of age range ≥
50yrs, AF, or Wilkins > 8.
24