nghiên cứu quy trình tạo sinh khối tế bào thông đỏ (taxus wallichiana zucc.) để chiết xuất hoạt chất điều trị ung thư bản tóm tắt tiếng anh
Bạn đang xem bản rút gọn của tài liệu. Xem và tải ngay bản đầy đủ của tài liệu tại đây (268.62 KB, 28 trang )
STUDIES ON THE CELL BIOMASS PRODUCTION
PROCEDURE OF YEW TREE (TAXUS WALLICHIANA ZUCC)
FOR EXTRACTING ANTICANCER COMPONENTS
Speciality: Pharmaceutical technology
Code: 62 73 01 01
Full name: Vu Binh Duong
Full name of supervisor:
1. Phan Dinh Chau, Dr.Sc., Prof.
2. Trieu Duy Diet, PhD.
Educational foundation: Military Medical University
INTRODUCTION
Vietnamese yew tree (Taxus wallichiana Zucc.) is a rare – valuable herb
distributed mainly in Hymalaya mountainous regions. In Vietnam, a small
number of yew trees are found in central highland in Dalat, Lam Dong
province. There are several anti-cancer/cancer-inhibitory compounds in
Yew tree such as paclitaxel (Taxol), cephalomannin or pro-compounds
used for semi-synthesis to produce anti-cancer drugs such as: baccatin III,
10-deacetyl baccatin III However, yew tree is a slow growing species;
meanwhile the content of bioactive compounds is very low. Thus, the raw
material for natural resource is not enough for the increasing demands of
treatment. To overcome this drawback, together with natural breeding and
growing, the plant cellbiomass is the new, promising direction to produce
active compounds from herbs in general and yew tree as well. The palnt
cell biomass is the cell culture in sterilized conditions in test tube or big
tank/flask, to produce the cellmass for extraction of active compounds. To
contribute to the production of raw material for paclitaxel from Vietnamese
yew tree using plant cell biomass technology, the dissertation “Study on
the yew tree cell (Taxus wallichiana Zucc.) bio-mass production
procedure to extract anti-cancer active compounds” was carried out to:
1. To build the cell bio-mass production procedure at laboratory scale.
1
2. To determine the chemical composition, extract, isolate some main
active compounds and establish the institutional standard for raw
materials of yew tree cell biomass.
The significance of the dissertation
The yew tree cell bio-mass production procedure for the first time has been
established in Vietnam (Taxus wallichiana Zucc.). The influent factors for the
growth rate and active compound content has been evaluated, contribute to
produce stable, sustainable and effective raw materials.
For the first time in Vietnam, the chemical composition in yew tree cell
biomass was investigated. The extraction procedure as well as the institutional
standards of raw material was established to produce raw active compounds
for anti-cancer drugs.
The new contribution of dissertation
The yew tree (Taxus wallichiana Zucc.) cell bio-mass production
procedure has been done at laboratory scale. The optimized media
composition, culture conditions for the best cell mass growth with highest
content of paclitaxel has been established. At the same time, the harvest
procedure for yew tree cell biomass has been studied as material for
extraction of anti-cancer compounds.
Chemical composition groups in yew tree cell biomass has been
determined. 9 main compounds has been extracted, isolated and elucidated
with taxane – frame derivative compounds. The simultaneous determination
of paclitaxel and baccatin III has been developed and validated in yew tree
cell biomass.
From the yew tree cellmass, the extraction and purification procedures
has been developed to produce paclitaxel. The content of paclitaxel product
is up to 98.07% in purity; meets the standard criteria of USP 30.
The institutional standards of yew tree cell biomass has been built in
accordance with USP 30 and Vietnamese Pharmacopoeia IV including the
2
specifications: appearance, water content, impurity, qualitative, quantitative
criteria.
The strutuure of dissertation: inclduing 4 chapter, with 137 pages
devided to following parts: introduction (2 pages), review of related research
(28 pages), material and methods (11 pages), results (62 pages), discussion (31
pages) and conclusion (2 pages), perspectives (1 pages), references (with 148
references: 15 Vietnamese references, 133 english references) and appendix.
Chapter 1: REVIEW OF RELATED RESEARCHES
Review of related researches has 3 parts:
- General information and researches about Vietnamese yew tree (Taxus
wallichiana Zucc.): species characteristics, distributions, chemical
compoisitions and bioactivity.
- General information about the plant cell biomass technology: concepts,
plant cell biomass procedures and influent factors – general knowledge of
plant cell biomass technology to produce yew tree cellmass for paclitaxel
production, the measure to increase the content of active compounds,
quantitation and extraction of paclitaxel from yew tree cellmass.
Chapter 2: MATERIALS AND METHODS
2.1. MATERIALS, REAGENTS
Young branch of 10-year-old yew tree (Taxus wallichiana Zucc.)
collected in Dalat, Lam Dong in April 2008, certified by the Institute of
Ecology and Biorecource –Vietnam Accademy of Science and Technology.
The specialized reagents met the criteria for plant cell culture. The
specialized instruments used in cell culture and analysis.
2.2. METHODS
2.2.1. Develop the yew tree cellmass production procedure
The yew tree plant cell biomass production procedure was carried out in
accordance with the principles of R. M. Enaksha, G. Parc, R.M. Cusido.
The young branches of yew tree were sterilized, cut into small slice, place
3
onto agar medium to create callus. Maintain the callus on the agar medium
to produce the undifferentiable cells. After that, transfer the cells to liquid
medium on a shaker. At this stage, the suitable time, pH, temperature and
medium composition is needed to be determined. At the same time, the
suitable elicitors were investigated. Then the cultivation was scaled up in 5-
lit-bioreactor with the optimized/investigated conditions. The cell biomass
was then harvested, the chemical composition was investigated, extracted,
isolated and structure determined, the institutional standard of raw material
and active compounds was established.
2.2.2. Investigate the chemical composition, extract and isolate main
compounds, establish the institutional standard of raw material
of yew tree cell biomass
2.2.2.1. Study on qualitative and quantitative analysis of active compounds in
yew tree cellmass
- Qualitative analysis of bio-active compound groups using
characteristic chemical reaction and qualitative analysis of paclitaxel and
baccatin III using HPLC.
- Develop and validate the simultaneous determination of paclitaxel and
baccatin III in the cell biomass using HPLC.
2.2.2.2. Study on the extraction, isolation and structure determination of
some main compounds in the cellmass
Extract compounds in cell biomass using ultrasonication method; purify
these compounds using reverse and normal phase column chromatography.
Structure determination of these isolated compounds based on the data of
UV, IR, ESI-MS, NMR:
1
H,
13
C-NMR, DEPT 90, DEPT 135, HSQC,
HMBC, COSY và NOESY.
2.2.2.3. Study on the extraction, purification of paclitaxel from yew tree
cell biomass
The extraction of paclitaxel in yew tree cellmass was carried out using
ultrasonication. Purification of this compounds using the sequential
4
precipitation and crystallization methods and reverse phase column
chromatography. In this investigation process, the factors that influence on
the extraction yield and content of paclitaxel in each step were investigated.
2.2.2.4. Establish the institutional standard of yew tree cellmass
Establish the institutional standard of yew tree cellmass in accordance to
the methods in Vietnamese Pharmacopoeia IV and USP 30.
2.2.2.5. Quality control of paclitaxel
Carry out the quantitative analysis of paclitaxel according to the method
in paclitaxel section in USP 30.
2.2.3. Data analysis
The data analysis was carried out using the statistical methods in
Microsoft excel.
Chapter 3. RESULTS
3.1. DEVELOP THE YEW TREE CELLMASS PRODUCTION
PROCEDURE
3.1.1. Yew tree callus induction
3.1.1.1. Study on the media for callus induction
Table 3.5: The media selection results
No Medium
Number of
samples
Callus weight
(mg)
p
1 MS 50 14.3 ± 1.5 p
3-1
<0.05
2 SH 50 20.1 ± 2.1 p
3-2
<0.05
3 B5 50 24.5 ± 2.2 *
4 White 50 12.9 ± 1.5 p
3-4
<0.05
When the B5 medium was used, the growth rate of callus is higher than
those with other media (p< 0.05).
3.1.1.2. Influence of culture time
The culture time optimization results showed that: callus weight was
highest at the 35
th
day. After this time, the callus weight gradually reduced.
5
(ngày)
3.1.1.3. Influence of growth hormone
* Influence of growth hormone types
Table 3.6: Influence of growth hormone type on the development of
callus (n=50)
No Batches Callus weight (mg)
1 2,4-D + kinetin 17.8 ± 1.4
2 2,4-D + BAP 19.8 ± 2.7
3 NAA + kinetin 24.8 ± 2.5
4 NAA + BAP 21.2 ± 1.8
p
3-1
<0.05 p
3-2
<0.05 p
3-4
<0.05
In the combination of NAA (1.0 mg/l) and kinetin (0.1 mg/l) medium,
the growth rate of cellmass is 3 time higher than those of 3 remained
combination (p<0.05).
* Influence of NAA concentration
Table 3.7. Influence of NAA concentration to the growth of callus (n=50)
No
NAA concentration
(mg/l)
Callus weight (mg)
1 0.5 23.6 ± 2.1
2 1.0 24.1 ± 2.3
3 1.5 25.0 ± 1.8
4 2.0 26.8 ± 1.9
5 2.5 25.6 ± 1.7
p
4-1
< 0.05; P
4-2
< 0.05 p
4-3
< 0.05; p
4-5
> 0.05
When the kinetin concentration was increased, the cell mass weight was
increased and got the maximum at the NAA concentration of 2.0 mg/l
(p<0.05). However, if the kinetin concentration continuously increased, the
cellmass however was decreased.
* Influence of kinetin concentration
Table 3.8. Influence of kinetin concentration on the development of callus
(n=50)
No Kinetin conc. (mg/l) Callus weight (mg)
6
1 0.1 24.5 ± 1.8
2 0.2 27.9 ± 2.3
3 0.3 26.1 ± 1.9
4 0.4 25.9 ± 2.4
5 0.5 26.2 ± 2.2
p p
1-2
<0.05; p
2-3
>0.05 ; p
2-4
>0.05; p
2-5
>0.05
The most suitable concentration of kinetin is 0.2 mg/l. When the
concentration of kinetin is higher than 0.2 mg/l, the callus weight is
reduced.
3.1.2. Mentainance of yew tree callus on agar medium
3.1.2.1. Influence of media and the number of transferation
The investigated results for the mentanence of callus on 2 media SH
and B5 showed that: on B5 medium, the growth of callus was slow and
easily differentiated into buds and root. Meanwhile, on SH medium, the
growth of yew tree callus was much higher. Thus the SH medium was
selected for further study in callus mentanence of yew tree.
Table 3.9: The characteristic of yew tree cellmass after several transferation
on SH medium
Number of
transferation
Cell appearance Differentiable
Growth
rate
(times)
No 1 Hard
Differentiate into
buds
1.87
No 2
Hard, some cells was
soft
Differentitated into
callus
2.25
No 3 Soft undifferentiated 2.78
No 4 soft, friable undifferentiated 3.51
No 5 soft, friable undifferentiated 3.72
After 5 times of transferation on SH medium, the callus growth rate is
stable (reach 3.72 times compared with inoculant) and undifferentiated into
tissue and organs.
7
3.1.2.2. Influence of saccharose concentrations
Influence of saccharose concentration to the development of yew tree callus
was presented in table 3.10.
Table 3.10: Influence of concentration on the development of callus (n=10)
No
Conc. of saccharose
(g/l)
Weight (g) Growth rate
(times)
1 10 1.16 ± 0.15 2.48
2 15 1.25 ± 0.13 2.65
3 20 1.75 ± 0.16 3.72
4 25 1.54 ± 0.13 3.29
5 30 1.26 ± 0.11 2.68
5 35 1.22 ± 0.14 2.60
7 40 1.12 ± 0.13 2.38
At the saccharose concentration of 20 g/l, the growth rate of callus is
the highest (p<0.05), the growth rate reach 3.72 times.
3.1.2.3. Influence of culture temperature
The investigated results on the influence of culture temperature to the
development of yew tree callus showed that: at the temperature of 22-24
0
C
the yew tree callus weight is higher than those of other groups (p<0.05), the
growth rate reach 3.72 times.
3.1.2.4. Influence of culture medium pH
The investigation of culture medium pH on the growth of yew tree
callus showed that: in the medium with pH 5,6, the growth of cellmass was
the highest (p < 0.05), the growth rate reaches 3.79 times.
3.1.3. The culture results in liquid medium
8
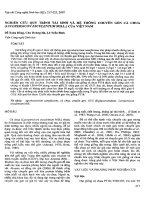
3.1.3.1. Influence of culture times
Figure 3.7. The cellmass weight versus culture time curve
The yew tree cellmass growth rate is increased with culture time,
reached the maximum at the 14
th
day. After that, the cellmass weight
gradually reduced.
3.1.3.2. Influence of inoculum weight
Table 3.14. Influence of inoculum ratio to the growth rate of cellmass
No
Inoculum
ratio
(%)
Cellmass weight (g)
(n=10)
The growth rate
(times)
1 10 17.25 ± 0.57 1.73 ± 0.06
2 15 24.59 ± 0.89 2.48 ± 0.08
3 20 28.29 ± 1.36 2.83 ± 0.07
4 25 28.78 ± 2.81 2.89 ± 0.09
5 30 25.02 ± 2.05 2.60 ± 0.11
p
3-1, 3-2, 3-5
< 0.05, p
3-4
>0.05
Using the inoculum ratio at 20% is the most suibtale for yew tree cell culture.
hen the inoculum is 25% , the growth rate is not significantly changed (p
3-
4
>0.05), causing waste of sample.
3.1.3.3. Influence of medium pH
The investigation results on the influences of medium pH showed that: at
pH=5,6, the cell growth rate was the highest, the growth rate reached 2.83
times (p< 0.05).
9
3.1.3.4. Influence of culture temperature
The investigation results on the influence of culture temperature to the
cell growth rate showed that: at the temperature of 24
0
C, the growth rate of
yew tree cellmass was the highest, the growth rate reaches 2.83 times
(p<0.05).
3.1.3.5. Influence of growth hormones
* Influence of BAP concentrations
Table 3.18. Influence of BAP concentrations on the growth rate of cellmass
(n=10)
No
Conc. of BAP
(mg/l)
Cellmass weight
(g)
Growth rate
(times)
1 0.5 20.62 ± 1.41 2.06 ± 0.07
2 1.0 28.29 ± 1.36 2.82 ± 0.11
3 1.5 30.20 ± 1.61 3.02 ± 0.10
4 2.0 33.56 ± 1.60 3.27 ± 0.06
5 2.5 32.98 ± 1.33 3.28 ± 0.08
6 3.0 33.24 ± 1.63 3.30 ± 0.09
7 3.5 33.61 ± 1.27 3.34 ± 0.08
p
4-1
,
4-2
,
4-3
< 0.05, p
4-5
,
4-6
,
4-7
> 0.05
At the BAP concentration of 2.0 mg/l, the cellmass growth rate reached
3.27 times (p< 0.05). If the concentration of BAP > 2.0 mg/l, the growth
rate was not significantly changed.
* Influence of NAA concentration
Table 3.19. Influence of NAA concentration on the development of cellmass
No
NAA conc.(mg/l)
Cellmass weight (g)
(n=10)
Growth rate
(times)
1 1.0 25.35 ± 1.51 2.53 ± 0.07
2 2.0 33.56 ± 1.60 3.27 ± 0.06
3 3.0 40.31 ± 1.84 4.01 ± 0.10
4 4.0 40.68 ± 1.46 4.05 ± 0.08
5 5.0 40.90 ± 1.79 4.07 ± 0.06
6 6.0 41.11 ± 1.71 4.09 ± 0.09
p
3-1
< 0.05 p
3-2
< 0.05 p
3-4
> 0.05 p
3-5
> 0.05 p
3-6
> 0.05
10
The concentration of NAA at 3.0 mg/l is the most suitable for the culture
of yew tree cellmass (the growth rate reaches 4.01 times). If the
concentration of NAA is higher than > 3 mg/l, the growth rate is not
significantly changed.
3.1.3.6. Influence of the sugar concentrations.
Table 3.20. Influence of the saccharose concentration on the cell growth
rate
No
Conc. of saccharose
(g/l)
Cellmass weight (g)
(n=10)
Growth rate (time)
1 15 30.20 ± 1.61 3.02 ± 0.08
2 20 40.31 ± 1.84 4.01 ± 0.10
3 25 44.33 ± 2.22 4.41 ± 0.11
4 30 51.61 ± 2.16 5.14 ± 0.09
5 35 46.75 ± 1.29 4.65 ± 0.12
p
4-1
< 0.05 p
4-2
< 0.05 p
4-3
< 0.05 p
4-5
>0.05
Using the saccharose concentration at 30 g/l, the cell growth rate was
the highest, cellmass weight reached 51.61 g/l and growth rate reached 5.14
times (p<0.05).
3.1.3.7. Study on the selection of suitable elicitors
a. Selection of suitable elicitors
The addition of elicitors including MJ, JA, acid caffeic, acid ferulic at
the concentration of 150 µM and yeast extract at the concentration of
100µg/g at the day of 12 in culture cycle. After 3 day of culture, the results
showed in the table 3.21
Table 3.21: Influence of elicitor on the growth rate and content of
paclitaxel in cellmass (n=10)
No Elicitor types Cellmass weight (g) Paclitaxel (mg/l)
1 Control 52.41±2.43 6.48±0.17 p
3-1
< 0.05
2 JA 36.83±2.10 8.84±0.21 p
3-2
< 0.05
3 MJ 38.98±1.98 9.39±0.20 *
4 Acid ferulic 45.22±2.21 7.53±0.14 p
3-4
< 0.05
5 Acid caffeic 46.39±1.86 7.64±0.18 p
3-5
< 0.05
6 Yeast elicitor 43.83±2.27 7.34±0.16 p
3-6
< 0.05
11
7 Acid salicylic 44.78±1.53 7.62±0.17 p
3-7
< 0.05
Among the elicitors, the use of methyl jasmonate (MJ) showed the most
effective, the content of paclitaxel reaches 9.39 mg/l. However, the use of
elicitor results in the reduction in the growth rate of cellmass compared
with control group.
* The investigation results on the selection of methyl jasmonat
concentrations
The investigation results on the influence of MJ to the growth rate and
paclitaxel content in yew tree cellmass showed that: the use of MJ at the
concentration of 100 µM, concent of paclitaxel in yew tree cellmass
reached highest at 10.39 mg/l (p<0.05) and the reduction of cellmass
growth rate was smallest (41.45 g).
b. The optimization of elicitor addition
* Optimize the exposed time of elicitor
Table 3.23: Influence of exposed time of MJ and the growth rate of
cellmass and content of paclitaxel in cellmass (n=10)
No
The exposed time
with elicitors
(days)
Dried cellmass
(g)
Paclitaxel (mg/l)
1 Control 48.31±2.34 6.49±0.31 p
6-1
< 0.05
2 1 44.37±2.12 7.21±0.26 p
6-2
< 0.05
3 2 44.23±1.97 8.75±0.21 p
6-3
< 0.05
4 3 41.45±2.04 10.39±0.37 p
6-4
< 0.05
5 4 42.98±2.02 11.06±0.28 p
6-5
< 0.05
6 5 42.37±2.17 12.32±0.12 *
7 6 39.65±1.98 9.93±0.27 p
6-7
< 0.05
After 5 days exposed with MJ, the content of paclitaxel in cellmass
reached the highest 12.32 mg/l (p<0.05).
* Study on the exposed time point with elicitor
Bảng 3.24: Influence of the exposed time point between cells and MJ to the
growth rate and content of paclitaxel (n=10)
No
Exposed time
point (day No
th
)
Dried cellweight
(g)
Paclitaxel (mg/l)
12
1 4 17.43±2.21 4.72±0.09 P
5-1
< 0.05
2 6 17.42±1.38 5.61±0.11 P
5-2
< 0.05
3 8 24.84±2.05 6.06±0.17 P
5-3
< 0.05
4 10 32.55±1.29 9.83±0.22 P
5-4
< 0.05
5 12 42.28±1.57 12.45±0.19 *
6 14 42.83±1.43 10.52±0.24 P
5-6
< 0.05
7 16 46.35±2.37 9.92±0.15 P
5-7
< 0.05
When the yew tree cell exposed to MJ at the 12
th
day of cell culture, the
content of paclitaxel reached highest at 12.45 mg/l, cellmass weigt reached
42.28 g.
3.1.3.8. Investigation on the combination of elicitor and saccharose
addition
Table 3.25: Influence of the saccharose addition time (n=10)
No
Time point to add
saccharose
(day
th
)
Dried cellmass
(g)
Paclitaxel
(mg/l)
1 Control 48.23±2.11 6.51±0.09 p
5-1
<0.05
2 No addition 42.28±1.57 12.45±0.19 p
5-2
<0.05
3 2 38.25±2.09 9.72±0.29 p
5-3
<0.05
4 6 42.41±1.89 11.26±0.36 p
5-4
<0.05
5 10 42.57±1.54 15.10±0.42 *
6 14 44.06±2.08 12.47±0.33 p
5-6
<0.05
When the addition of saccharose to culture medium at the day of 10,
content of paclitaxel reached highest at 15.1 mg/l (với p<0.05).
3.1.4. The culture results in 5-litter bioreactor system
When transfer the cellmass into the 5 litter-bioreactor system with the
above investigated culture conditions including: SH medium supplemented
with NAA (3.0 mg/l), BAP (2.0 mg/l), saccharose (30g/l), pH = 5.6; culture
conditions: temperature 24
0
C, the addition of saccharose was carried out at
the day of 10 (20g/l), at the day of 12, methyl jasmonate was added (100
µM), continuously culture until day 17
th
. The results showed that: the
13
growth rate reached 3.60 times, content of paclitaxel inside cellmass
reached 12.92 mg/l. The free paclitaxel in the medium was 1.23 mg/l.
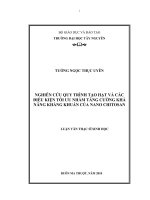
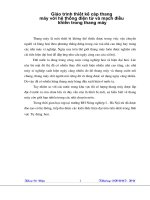
3.1.5. Yew tree cellmass harvest procedure
14
Callus
Cell mass/suspension
Medium
- SH +NAA (2mg/l), Ki (0,2mg/), saccharose (20g/l), pH=5,6.
- Cont: t
0
= 22-24
0
C; 35 days; in darknees. 4 times subculture
Maintaining callus
culture in agar medium
Yew natural tissue
- sterilize with HgCl + Tween 80
- Inoculate on B5 + NAA (2mg/l)medium, Ki (0.2mg/l),
saccharose (20g/l), pH=5,6.
- Cont: 35 days, 24
0
C, in darknees
Callus induction
Culture in
suspension medium
- SH + NAA (3mg/l), BAP (2mg/l), saccharose (30g/l).
- Cont: rate mass of 20%; t
0
=24
0
C; pH=5,6; stir 130r/m,
14days
Callus/Agar medium
Cell mass/ Bioreactor
- Filter
- Wash 3 times with water
- Dry 40 -60
0
C/10h
Harvest cellmass
Dried cell mass
- SH + NAA (3mg/l), BAP (2mg/l), saccharose (30g/l+20g/l
after 10days culture), MJ (100µM) added at 12th
- Cont: rate of mass 20%; t
0
=24
0
C; pH=5,6; stir 60 r/m, O2
30%; 17days
Procedure in 5 l
bioreactor
QC
The harvest procedure for the yew tree cellmass as follow:
Draw the cell suspension out of bioreactor and keep natural
sedimentation for 1 hour. After that, use the vacuum filteration to get the
cellmass. Wash the cellmass 3 times with distilled water (ratio of 5 water
part: 1 cellmass part). The cellmass powder was collected after filtration.
The cellmass was dried in drying oven at 60
0
C to get the constant weight.
The dried cellmass was packed with double PE, store under the dry and
cool place.
The quantitative analysis of paclitaxel in yew tree cellmass is 0.0361%.
The residue of NAA and BAP was 1.73 and 0.61 ppm, respectively. The
production procedure of yew tree cell biomass was shown in Figure 3.9.
3.2. THE INVESTIGATION RESULTS ON THE CHEMICAL
CONTENT, ISOLATION, INSTITUTIONAL STANDARD OF
YEW TREE CELLMASS
3.2.1. Quantitative determination of chemical content in yew tree
cellmass
3.2.1.1. Develop the qualitative and quantitative analysis method using
HPLC
The investigation results on the quantitative and qualitative
determination of paclitaxel and baccatin III has been developed with the
following condition: Luna L43 column (250 × 4.6 mm ; 5 µm), mobile
phase: ACN-H
2
O with the following condition in table 3.30), wavelength:
228 nm, flow rate: 1 ml/min, injection volume: 20 µl. The quantitative
analysis method showed high specificity, linearity, accuracy and precision,
stability.
15
Figure 3.9. The yew tree cellmass procedure
Table 3.30. Gradient program
Time (min) ACN (%) H
2
O (%)
0 - 45 25 – 63 75 – 37
45 - 55 63 – 25 37 – 75
55 - 65 25 75
3.2.1.2. Qualitative determination of some groups of compounds in yew
tree cell biomass
The qualitative determination of bioactive compound groups in yew
tree cellmass using the characteristic chemical reactions showed that: the
yew tree cellmass contains several groups of active compounds such as
alcaloid, tanin, anthranoid, sterol, organic acid.
3.2.1.4. Quantitative analysis of paclitaxel and baccatin III in yew tree
cellmass
The quantitative analysis of paclitaxel and baccatin III in yew tree
cellmass by HPLC showed that the content of paclitaxel and baccatin III
were 0.0360% and 0.0061%, respectively. Compared with the newly
collected young branch yew tree and leaves, the content of paclitaxel was
3.5 times higher. However, the content of baccatin III was lower (p<0.05).
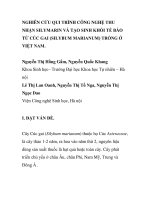
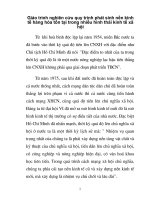
3.2.2. Extraction, fraction and identification bioactive compounds in
Taxol biomass
Nine compounds in Taxol biomass were fractured : Taxuyunnanine
C (1); 2α,5α,10β- triacetoxy - 14β - propionyloxy-4(20),11-taxadiene (2);
2α,5α,10β-triacetoxy - 14β- (2-methyl) - butyryloxy-4(20),11- taxadiene
(3); 2α,5α,10β-triacetoxy-14β-(3-hydroxy-2-methyl)-butyryloxy-4(20),11-
taxadiene (4) và β-sitosterol (9) and four other compounds were identified
16
b
c
from the ethyl acetat fraction: 13-dehydroxy baccatin III (5), paclitaxel (6),
(+)-catechin (7) và (-)-epícatechin (8)
1 2 3
4 5 6
7 8 9
Fig. 3.16. The structures of the compounds 1-9
3.2.3. Extraction and purification of paclitaxel in Taxol biomass
3.2.3.1. Extraction of paclitaxel in taxol biomass
* Stage 1 (liquid-solid extraction): Select the solvent of extraction
Table 3.42. The results of extraction of paclitaxel with diverse solvents
No. Solvent
Crude product
(g)
Content of
paclitaxel (%)
Productivity
(%)
1 Metanol 23,34 ± 0,95 0,50 ± 0,02 97,30 ± 0,56
17
2 Aceton 26,41 ± 1,13 0,35 ± 0,01 74,71 ± 2,01
3 Cloroform 18,99 ± 1,25 0,34 ± 0,02 53,58 ± 2,52
4 Diethylether 20,92 ± 1,42 0,40 ± 0,02 67,28 ± 3,89
p p
1-2, 1-3, 1-4
<0,05
Using MeOH for extracting paclitaxel in taxol biomass brings about the
highest productivity (97,30%) and the content of paclitaxel was 0,5%.
* Stage 2 (liquid-liquid extraction):
For using DCM for extracting paclitaxel in MeOH extract, the productivity
was 91,94%, and the quantity of paclitaxel was increased from 0,5% to
5,93%.
3.2.3.2. Purification of paclitaxel
* Results of eliminating impurities with activated carbon: with the ratio of
activated carbon to extract (3:1), the content ofpaclitaxel was highest
(7,81%) and the productivity was 88,68%.
* The rate of n-hexan using to purify paclitaxel (n=6)
Table 3.45. Results of using n-hexan to purify paclitaxel(n=6)
No
Ratio of
n-hexan
to DCM
Mass (g) Proportion
of
paclitaxel
(%)
Content of
paclitaxel
(mg)
Productivity
(%)
1 4 : 1 0,16 ± 0,02 27,10 ±
1,76
40,7±2,4 55,97 ± 4,19
2 6 : 1 0,19 ± 0,01 26,51 ±
0,93
49,9±3,8 63,89 ± 2,43
3 8 : 1 0,22 ± 0,02 25,88 ±
0,99
57,12±2,6 73,14± 1,66
4 10 : 1 0,25 ± 0,01 25,37 ±
1,12
64,37±3,2 82,43 ± 2,76
5 12 : 1 0,31 ± 0,02 20,53 ±
0,84
63,36±2,3 81,61 ± 1,02
p p
4-5
<0,05 p
4-1, 4-2, 4-3
<0,05
18
With the ratio of n-hexan to DCM 10:1, the content ofpaclitaxel was
highest 25,37%, and productivity was 82,43%.
* Results of the purification paclitaxel using fracting crystalization
with the mixture of solvents
Table 3.46. Rate of solvents in purification of paclitaxel (n=6)
No.
Ratio
H
2
O :
MeOH
Mass (mg)
Proportion
of paclitaxel
(%)
The
content of
paclitaxel
(mg)
Productivity
(%)
1 2:8 89,4 ± 8,2 62,20 ±1,22 55,8±3,1 44,60 ±2,00
2 3:7 109,1 ± 6,9 60,03 ± 1,98 65,5±3,9 52,43 ±1,91
3 4:6 147,7 ± 9,4 60,46 ± 1,05 89,3±4,2 71,41 ± 1,45
4 5:5 179,2±10,7 50,78 ± 2,97 91,2±3,5 73,07± 1,25
5 6:4
231,7 ±
4,3
40,05 ± 2,05 92,8±2,9 74,22 ± 1,65
p p
3-4
<0,05 p
3-1, 3-2,3-4
<0,05
With the ratio H
2
O : MeOH (4 : 6), the productivity of the purification
was highest 71,41%, the proportion of paclitaxel was 60,46%.
* The purification of paclitaxel using the column chromatography
Table 3.47. Results of the purification of paclitaxel using column
chromatography
Sample
1
st
purification 2
nd
purification
Proportion of
Paclitaxel(%)
Productivity
(%)
Proportion of
Paclitaxel(%)
Productivity
(%)
1 92,39 89,59 98,39 90,74
2 91,24 90,78 99,04 95,98
3 94,82 95,23 96,82 94,12
4 95,65 94,24 98,65 93,93
5 92,75 88,19 97,71 87,47
6 91,81 92,76 97,81 94,18
Mean±SD 93,11 ± 1,74 91,97 ± 2,61 98,07 ± 0,79 92,74 ± 3,09
After two times of purifying using the column chromatography, the
proportion of paclitxel was increased from 60.46 % (before purifying) to
98.07%.
19
The summary of the extraction and purification of paclitaxel in Taxol
biomass:
Table 3.49. The productivity of the process and the proportion of paclitaxel
Stages of the extraction and
purification
Proportion of
paclitaxel (%)
Productivity of each
stage (%)
Extraction with MeOH 0,50 ± 0,02 97,30 ± 0,56
Extraction with DCM 5,93 ± 0,25 91.94 ± 1,45
Elimination using activated
carbon
7,81 ± 0,18 88,68 ± 2,58
Precipitating in n-hexan 25,37 ± 1,12 82,43 ± 1,76
Precipitating in the mixture
MeOH: H
2
O
60,46 ± 1,05 71,41 ± 1,45
Using the column
chromatography 1
st
93,11 ± 1,74 91,97 ± 2,61
Using the column
chromatography 2
nd
98,07 ± 0,97 92,74 ± 3,09
The process 98,07 39,83
The total productivity of the extraction and purification of paclitaxel from
taxol biomass was 39,83%, and the content of paclitaxel in the product was
98,07%.
3.2.4. The standardisation of the material of taxol biomass and active
ingredients
3.2.4.1. The standardisation of the material of taxol biomass
* Form: dried, friable, brown biomass without fungi.
* Moiture: not over 12 %.
* Total ash: not over 8%.
* Ash not dissolved in acid : not over 2%.
* Quanlitative determination: paclitaxel và baccatin III.
*Quantitative determination:
+ The proportion of paclitaxel in taxol biomass is at least 0,03%.
+ The proportion of baccatin III in taxol biomass is at least 0,005%.
20
The standards of the material were assessed by the national institue of
control drugs.
3.2.4.2. Results of determination of paclitaxel in taxol biomass
according to the standards in USP 30
The content of paclitaxel in taxol biomass was controled based on
USP 30 at The Hanoi center of control drugs. The results was that the
proportion of paclitaxel (98.1%) was correct as UPS 30 with the
certification 1290/11 dated 16/11/2011.
Chapter 4: DISCUSS
4.1. Production of taxol biomass
4.1.1. Production of taxol callus
* Selection of medium
The investigation has shown that the rate of producing callus in B5 medium
was maximum. The growth rate of biomass in B5 medium was higher than
that in other medium (p<0.05). The result also was suitable with E.R.M
Wickremesinhe’s study on producing other taxus callus.
* Time
The result has shown that the cycle of taxol callus culture was 35 days. It
was suitable with the result of R.M. Enaksha ‘s study on the time of
transfering callus of T.media and T. Baccata.
* Elicitor
The growth rate of taxol callus in the medium added NAA (2mg/l) and
kinetin (0.2mg/l) was higher than that in the medium added other elicitors
at other concentration (p<0.05). The result was suitable with the result of
the R.M Enaksha study on Pacific taxol biomass.
21
4.1.2. Maintaining taxol callus in agar medium
In SH medium added NAA (2.0mg/l), kinetin (0.2mg/l) and saccharose
20g/l, medium pH of 5.6, tempature of 24
0
C, after transfering 5 times the
biomass developed rapidly and became soft, friable and unable to
differentate a organ. The growth rate of biomass increased 3.81 times,
which indicated that the new developed cell adapted gradually with new
medium.
4.1.3. The taxol callus culture in liquid medium
4.1.3.1. Effect of culture conditions
* Period of culture in liquid medium
The reasonable time of taxol cell culture cycle in liquid medium was 14
days. This was suitable with the result of H.K.Choi’s study on T. chinensis
cell culture.
* Inoculum ratio
Using the inoculum ratio of 20% results in that growth rate increased 2.83
times. Therefore, this rate was appropriate. Compared with other study, this
rate was higher but the growth rate of biomass was rapid.
* Medium pH and tempareture of culture
For T.wallichiana cell culture, at the medium pH of 5.6 and temperature of
24
0
C the development rate of biomass was maximal and the growth rate of
biomass increased 2.83 times.
4.1.3.2. Effect of the components in culture medium
* Effect of elicitor
The investigation on use of BAP and NAA has shown that the proper
content of BAP and NAA for culture is 2.0 mg/l and 3.0 mg/l, respectively.
As a result, the growth rate of biomass was 4.01 fold (p<0.05). Compared
22
with other study, this content of BAP and NAA was higher. The reason for
this phenomenom may be the higher ratio of sample to medium than other
taxol species.
* Effect of the content of sugar on growth rate of taxol biomass in liquid
medium
Using sugar of 30g/l makes the growth rate was maximum (p<0.05) and
increased 5.14 times. This results was suitable with the J. Luo and
E.Moyano’s study on T.chinensis và T . baccata cell culture.
4.1.3.3. Using elicitor in taxol cell culture
* Use of elicitor
The content of paclitaxel in sample added elicitor increased more than that
in control sample, in which methyl jasmonate makes productivity of taxol
cell culture higher than other elicitors. However, using elicitor in taxol cell
culture makes the mass of cells decreased more than not using elicitor
(p<0.05).
The result has also shown that when 100 µM MJ was added in culture
medium on 12
th
day of the cycle, and the time of the addition was 5 days,
the content of paclitaxel was maximum (12.45mg/l). This result was
suitable with the D.W. Yan’s study on other taxol cell culture.
* Addition of saccharose and MJ
When saccharose was added on the 10
th
day of the cycle of culture, the
content of paclitaxel increased highest by 15.1 mg/l (increased
approximately 2.5 folds as much as the control sample). This result was
suitable with the H.Q. Wang‘s study on T.chinensis cell culture (saccharose
added on 7
th
day)
4.1.4. Taxol cell culture in 5-liter bioreactor
23
After 8 batches of taxol cell culture in 5- liter bioreactor, the growth rate of
biomass increased 3.6 times and the content of paclitaxel inside cell was
12.92 mg/l and outside 1.23 mg/l. The growth rate of taxol biomass in this
study was higher than that in other study on taxol culture.
4.1.5. The process of harvesting taxol biomass
The result of the process of harvesting taxol biomass has shown that using
the method of normally filtering and washing with water 3-4 times
unchanges the content of palitaxel in biomass whereas the content of BAP
and NAA decreaed and is in the safe range recommended by the US
Department of protect environment.
4.2. INVESTIGATE CHEMICAL COMPOSITION, EXTRACTION,
ISOLATION, ESTABLISH INSTITUTIONAL STANDARD OF
YEW TREE CELLMASS
4.2.1. The chemical composition
4.2.1.1. Qualitative and quantitative analysis of chemical composition
* Qualitative analysis of bioactive compound group in yew tree cellmass
Qualitative analytical results of chemical composition in yew tree
cellmass showed that: yew tree cellmass contains chemical groups such as
alcaloid, anthranoid, sterol, tanin and organic acid. Compare with natural
yew tree, the yew tree cellmass contains almost all chemical groups,
however, it doesn’t contain flavonoid group.
* Qualitative and quantitative analysis of paclitaxel and baccatin III in yew
tree cellmass
The quantitative and qualitative analysis results of paclitaxel and baccatin
III in yew tree cellmass showed the content of paclitaxel was 0.0360%;
baccatin III was 0.0061%. Compared with natural yew tree, the content of
24
paclitaxel was 2.5-5.5 times higher than that of natural yew tree depending
on the collected part. Meanwhile, the content of baccatin III was lower.
4.2.1.2. Extraction, isolation and determination of main compounds in yew
tree cellmass
From the yew tree cellmass, using the sequential extraction with column
chromatography, 9 compounds were isolated. Among 9 isolated
compounds, the compounds number 7, 8 and 9 were the common in plants.
6 compounds belonged to taxane diterpenoid derivatives with 6/8/6 in
which compound 1, 2, 3 and 4 belonged to the exomethylen functional
group at C4-C20 group, paclitaxel (6) and 13-dehydroxy baccatin III (5)
belonged to group of closed epoxide ring at C5-C20. These were
characteristic compounds in Taxus genus.
4.2.2. Extraction, purification of paclitaxel in yew tree cellmass
4.2.2.1. Extraction of paclitaxel in yew tree cellmass
The investigation has shown that using ultrasonic extraction with MeOH
gives the maximal productivity, 97.30% (p<0.05). After eliminating the
impurities in the extract, the proportion of paclitaxel was 5.93%. The result
was suitable with the one of the S. H. Pyo, H. L. Da’s study.
4.2.2.2. Purification of paclitaxel in taxol cellmass
Due to the elimination of impurities by using activated carbon, applying
the method of precipitation by the change of solvents and fragmentary
crystallization with the mixture solvents MeOH : H
2
O (6:4), the product
consisted of 60,46% content of paclitaxel. Then the product purificated with
reverse column chromatography contained 98.07% paclitaxel. This result
was suitable with the S. H. Pyo’s study. The final product also was
acceptable to USP 30 in term of quantitative analysis.
4.2.3. Results of establishing manufacturer standards of taxol cellmass
The results of study have shown that taxol cellmass was acceptable to
general requirements of Vietnam pharmacopoeia IV (applied for medicinal
25