tóm tắt luân án tiếng anh nghiên cứu ảnh hưởng của cường độ chống cắt đất không bão hòa đến sự ổn định đập đất
Bạn đang xem bản rút gọn của tài liệu. Xem và tải ngay bản đầy đủ của tài liệu tại đây (1.4 MB, 27 trang )
Ministry of education Ministry of agriculture and
and training rural development
water resources university
Nguyen Thi Ngoc Huong
Study the effect of the shear strength of
unsaturated soil to the stability of earth
fill dams
Specialization: Geotechnical Engineering
Code number: 62 - 58 - 60 - 01
THESIS OF DOCTOR OF ENGINEERING IN BRIEF
HANOI, 2013
The scientific work has been finished at:
water resources university
Advisors: 1. Assoc. Prof. Dr. Trinh Minh Thu
2. Prof. Nguyen Cong Man
Critic person 1:
Critic person 2:
Critic person 3:
The PhD thesis will be defended at the thesis assessment committee at
the Water Resources University - 175 - Tayson street – Dongda - Hanoi
At……oclock, date/month/year……………………………
The PhD thesis can be obtained: The national library or
The Water Resources University 175 – Tayson – Dongda - Hanoi
- 1 -
INTRODUCTION
I. THE NECESSITY OF THIS STUDY
The properties of unsaturated soil on stress - strain relationship, pore pressure variation, soil
shear strength, and coefficient of seepage are not conformed to the theories of saturated
soil mechanics. In reality the slope in nature (residual) or artificial embankment (local
material dams), are generally a saturated/unsaturated soil system, so all theories for
saturated soil mechanics are not adequately applied for saturated/unsaturated soil
environment. In Vietnam, earth dams are generally used with in-situ soils having low clay
content (especially earth dams at the central part of Vietnam). The knowledge, experience,
theory for calculation, apparatus … for unsaturated soils are still very limited.
In our country some of earth dams good operate until present time, but they were unstable
by calculated checking, so it should be related to have no taking account of influencing the
parameters of the unsaturated soil. In a research project about vertical slopes in Hong Kong,
some studies also gave the same result. So, except from normal calculation method, the
consideration of the influence of unsaturated soil parameters when calculating earthen
structures is very important and necessary, it shows a completed calculation method for
unsaturated soil mechanics.
Until now, Vietnam has not had much research on the characteristics of unsaturated soil
mechanics when calculation the stability of earthen structures, especially the studies of the
influences of the shear strength of unsaturated soils to the stability of earthen structures. In
other words, at the present Vietnam almost does not have laboratory equipments for
obtaining unsaturated soil properties. To reach advanced countries in the world, the
construction and establishment of equipments for defining characteristics of unsaturated
soils is an important problem in our country. Therefore, this thesis “Study the effect of the
shear strength of unsaturated on the stability of earth fill dams” is an urgent issue and it
has big scientific and piratical meaning.
II. rESEARCH objectives
The main objectives of this thesis are:
1. To make clear the nature of unsaturated soil model and its parameters when compare to
the traditional understanding about saturated soil mechanics.
2. To establish relationships between the characteristics of unsaturated soils and the
relationships between the characteristics of unsaturated soils and saturated soils as well as
between different methodologies in laboratory tests. Find the relationship for calculating the
functions of unsaturated soil characteristics used in Vietnam conditions.
3. To find the possibility and conditions to apply the achieved research results, the aim is to
reduce the construction cost when using the unsaturated soil parameters in assessing the
stability of earthen slopes.
III. SUBJECT AND SCOPE OF THE STUDY
This thesis would try to study some clayey soil and clay loam samples. Except from normal
physical and mechanical properties of soil, this study would mainly concentrate on
important properties of unsaturated soils that related to the stability of earthen slopes, such
as: The relationship between the volumetric water content, coefficient of permeability and
shear strength, then applying for the calculation of dams that are filled by local materials
and natural slopes: representing for the fill soil in North – East area is the Khecat reservoir
(Quangninh province), fill soils that are used in for the dam in Songsat reservoir (Ninhthuan
province) representing for the fill soils in the Central and Northwest area (Yenbai province)
in Vietnam.
IV. CONTENT OF THE THESIS
- 2 -
The main content of this study aims to solve the following problems: (1) Study an overview
about earthen dams in general and instability problems of earthen slopes, the saturated and
unsaturated soil environment, the present situation and application of the physical and
mechanical parameters of unsaturated soil in Vietnam and foreign countries. (2) Concentrate
deeply on the theories and methods for defining the unsaturated soil parameters such as: the
soil water characteristic curve; the coefficient of permeability and shear strength. (3) Based
on the achieved results, propose the procedure for the triaxial test for unsaturated soil,
especially with the modified triaxial equipment, suitably used under Vietnamese conditions.
(4) Experimental study to find out the soil – water characteristic curve for different soils
used in practical structures and the shear strength of soil corresponding to different matric
suctions, defining a curve that show the relationship between the shear strength and the
matric suction (u
a
-u
w
). (5) Study the relationship between the soil water characteristic curve
and the soil shear strength and the permeability coefficient of unsaturated soils, calculating
to define the permeability coefficient of soil in saturated/ unsaturated condition. (6) Propose
an experimental equation that shows the soil – water characteristic and the relationship
between the soil shear strength and the matric suction of the soil samples that were suitably
used in Vietnam. (7) Comparing, confronting the achieved results from the suggested
equations with the experimental results. From the achieved result, petitioning about the
possibility of applying these proposed equations in calculating the coefficient of
permeability and the shear strength of unsaturated soils in Vietnam. (8) Applying the
achieved results to analyze, assess about the stable state of the real structures (the earthen
dam at Khecat reservoir and Songsat reservoir) and natural slopes in Yenbai province.
V. Research METHODOLOGY
The following methods are applied in this thesis:
+) Theoretical method: study the theory of the soil – water characteristic curve, the shear
strength of unsaturated soil and the permeability coefficient of saturated – unsaturated soil.
+) The finite element method: modeling and analyze the seepage problem for earthen dams
under the saturated/ unsaturated environment
+) The slope stability analysis method: calculate the stability of the slope of earthen dam
when considering the soil parameters under saturated, unsaturated conditions.
+) The experimental method: do the laboratory tests to find out the properties and
parameters of unsaturated soils, for instance: tests to define the soil – water characteristic
curve, tests to find the relationship between the unsaturated soil shear strength versus
different matric suctions
VI. THE SCIENTIFIC AND practical MEANING OF THE THESIS
This thesis is done would contribute knowledge that is more suitable in the scientific base
about the unsaturated soil parameters and their influence to the stability state of earthen
slopes. Study the experimental results on the Vietnamese soils about the soil-water
characteristic curve, shear strength and coefficient of permeability versus different matric
suction, and suggest experimental equations that allow calculating relation curves that suit
the results of laboratory tests on Vietnamese soil. From the results that withdraw from
experimental studies, this thesis would apply to study the stability state of earthen dams and
from that point out the amount of influence of the unsaturated soil shear strength to the slope
stability factor of safety.
This thesis also has large contribution on applying the experimental equations in modeling
unsaturated soil parameters in Vietnam, examine the influence of unsaturated soil
parameters in calculating and designing earthen dams to define the suitable dam cross
section that satisfy both the scientific and economic conditions, so contributing to the
application of an advance in the development of the hydraulic construction field in Vietnam.
- 3 -
VII. SUMmARY OF NEW CONTRIBUTIONs OF THIS THESIS
The thesis has had some contribution in scientific and realistic meaning as follow:
(1) The triaxial compression apparatus for unsaturated soil that have been modified from the
triaxial compression apparatus for saturated soil at the Geotechnical Laboratory - Water
Resources University based on the principles given by Fredlund and Rahardjo (1993).
(2) The soil – water characteristic curves was obtained for some typical soil in Vietnam and
also for defining the permeability coefficient and shear strength function for these soils.
Develop a graph for obtaining the correction coefficient versus I
p
for different soil (from
slight clay, loam, heavy loam to clay) in Vietnam. The results from this study of the shear
strengths show that shear strength parameters (’, c’ and
b
) from the same soil but with
different apparatus (direct shear test, triaxial consolidation drain test and constant moisture
content triaxial test) gave relatively close to each other. Therefore it would be suggest that
when lacking of the triaxial compression apparatus for unsaturated soil, the direct shear test
can be used for preliminary determining the shear strength parameters of unsaturated soils.
(3) When the matric suction in the soil changes, the effective cohesion c’ would change,
however the internal friction angle, ’, is almost unchanged for some type of soil in
Vietnam.
(4) Obtaining a set of unsaturated soils parameters that representing for some types of soil in
Vietnam as well as successfully proves the effect of unsaturated soil parameters to the
stability of earth fill slope in Vietnam. Propose a method to apply the unsaturated soil
parameters in calculating the stability of slope that satisfy the safety and economic
conditions for soils in Vietnam.
VIII. THE STRUCTURE OF THE THESIS
Introduction
Chapter 1: Overview about earthen dam and unsaturated soil
Chapter 2: The theoretical basis
Chapter 3: Experimental research
Chapter 4: Apply to calculate the stability of slope for real structures (earthen dam at
Songsat reservoir and another one at Khecat reservoir) and natural slopes in Yenbai
Conclusions and future works
CHAPTER 1
OVERVIEW ABOUT EARTHEN DAM AND UNSATURATED SOIL
1.1. OVERVIEW ABOUT STUDIES OF EARTHEN DAM AND UNSATURATED SOIL
1.1.1. General overview about earthen dam
Earthen dam is a popular type of structure that is used to raise the water level. Earthen dam
can be classified based on the type of the dam body as follow:
1) Homogeneous dam: The dam body is filled by one type of soil
2) Heterogeneous dam: The dam is filled with different soil types
3) The dam with an inclined rigid wall or flexible wall
4) The dam with a flexible or rigid core-wall
5) Combination type dam: The body part at upstream site is filled with different soil
types, the body part at downstream site is rock masses
1.1.2. Problems related to the instability of earthen slopes
Large scale slope incidents in the world and in Vietnam were mostly related to the
unsaturated state of soil. Instability problems often happen in earthen slopes that are formed
by residual soils with deep ground water table.
Nowadays, most of the present methods that are used to analyze the stability of slope assume
the slip surface is a circular sliding surface due to the fact that the using of this type with the
- 4 -
cross section is a segment of a circle would give a reasonable result with high degree of
accuracy without complicated calculation. In general, effective shear strength parameters (c’
and ’) are used when the saturated earthen slopes are analyzed.
It is possible to assume that the negative pore water pressure can be neglected for cases that
larger part of the slip surface is located under the water level. However, in the situation that
the ground water level is deep or when the shallow failure is predicted to happen, it would be
not reasonable to ignore the negative pore water pressure.
1.2. OVERVIEW ABOUT THE SATURATED AND UNSATURATED SOIL CONDITIONS
Saturated soil is the biphase one (solid and liquid phases) and existing positive pore water
pressure. Unsaturated soil is the multiphase one and existing negative pore water pressure.
Lambe and Whitman (1979) defined that unsaturated soil is a three - phase soil system
including: solid, liquid and air. According to Fredlund and Morgensten (1977), when
analyzing the stresses in a multiphase continuous environment, it is important to note that
the intermediate air - water phase behaves as an independent phase, so that the unsaturated
soil would be a system of four phases: solid, air, water and the surface tension phase.
The matric suction, soil water characteristic curve, permeability coefficient and shear
strength are basic parameters of unsaturated soil. The shear strength of unsaturated soil is
different from saturated soil by the cohesion due to matric suction. This additional cohesion
depends on (u
a
- u
w
), and the value of
b
.
1.3. THE SITUATION OF STUDYING THE UNSATURATED SOIL PARAMETERS IN
THE WORLD AND IN VIETNAM
1.3.1. The situation of studying the unsaturated soil parameters in the world
The theory about unsaturated soil mechanics was established from many decades ago.
Before 1950, scientists started to study about basic properties of unsaturated soil; however,
most of their care only concentrated on the flow of capillary. In the end of 1950s, new
developments have started by the studying of the volumetric strain and shear strength of
unsaturated soil. The above study leads to suggestions about some stress equations that were
called effective stress for unsaturated soil. Then there was a slow progression with the
direction to accept two independent stress state variables (Fredlund and Mongensten, 1977).
Until now, we have had a quite stable background about the theory of unsaturated soil
mechanics.
1.3.2. Overview about researches in soil shear strength
Terzaghi (1936) used the Morh – Coulomb criteria and the definition about effective stress
to describe the shear strength of saturated soil. To determine the stress state for unsaturated
soil, more and more researches have accepted the using of two independent stress state
variables (Fredlund and Morgenstern, 1977).
1.3.3. The research situation about the properties of unsaturated soil in general and
soil shear strength in specific in our country
In our country, problems related to unsaturated soil mechanics was just started to study in
recent years. A few publications and researches about unsaturated soil has been announced,
the theory of unsaturated soil mechanics related to permeability, stability, stress - strain has
been applied to calculate the stability of structures. Especially, the geotechnical engineering
laboratory - Water Resources University has had an equipment to define the soil water
characteristic (SWCC) and the shear strength of unsaturated soil, contributing to
experimental research for defining unsaturated soil parameters in Vietnam.
1.4. CONCLUSION OF CHAPTER 1
The problem to study and apply laboratory equipment, laboratory procedures to determine
unsaturated soil parameters and apply these parameters in calculating the stability of earth
structures in Vietnam have a great meaning and necessary, it starts a new research direction
- 5 -
for Vietnamese scientists. Together with the world’s scientists we also have a great
contribution on the development and fulfillment the theory in unsaturated soil mechanics. In
this thesis, the author suggests a study to define unsaturated soil parameters for some soil
types in Vietnam and apply these parameters in earth dam stability calculation.
Chapter 2
THEORETICAL BASIS OF UNSATURATED SOIL
2.1. STRESS STATE VARIABLES IN SOIL ENVIRONMENT
Bishop (1959) suggested an experimental equation to define the effective stress and it has
been applied popularly (for example the lecture in Oslo, Norway, 1955):
s’ = (s - u
a
) + (u
a
- u
w
) (2.2)
where: u
a
– pore air pressure; - the parameter related to the degree of situation
In 1977, Fredlund and Morgenstern has studied and concluded that any two of three normal
stress variables (total stress s, pore water pressure u
w
and pore air pressure u
a
) can be used to
describe the stress state of unsaturated soil. In other words, three combinations can be used
to describe stress state variables, compatible with soil structure and the surface tension in
unsaturated soil: (s-u
a
) and (u
a
-u
w
); (s-u
w
) and (u
a
-u
w
); (s-u
a
) and (s-u
w
), where: s - total
stress; u
a
– pore air pressure; u
w
– pore water pressure.
2.2. THE SOIL WATER CHARACTERISTICS
In unsaturated soil mechanics, the relation curve between the soil moisture versus matric
suction is defined as the soil water characteristic. It has a great meaning in solving seepage
problems in unsaturated soil mechanics, controlling parameters of unsaturated soil such as
the permeability coefficient, shear strength and volumetric strain of soil
Equations of the soil water characteristic curve
Many types of experimental equations have been proposed to perform the soil water
characteristic curve. These equations were suggested to model SWCC based on the
assumption that the shape of SWCC depends on the distribution of the pore size in soil. The
equation form that is used to illustrate the relationship between the matric suction and
moisture content is the equation of Fredlund & Xing (1994).
Fredlund and Xing: =
m
n
a
e
C
ln
1
(2.8)
where: , a, n, m – constants (different parameters of soil), - matric suction, -
volumetric water content, = (q - q
r
) / (q
s
– q
r
) (q
s
is the volumetric water content at
saturation, q
r
is the residual volumetric water content, and q is the volumetric water content
at a specific matric suction), e – the log base number, and C() – the adjusted coefficient.
Defining the soil water characteristic curve by experiment
The soil water characteristic curve can be defined by the pressure plate method in the
laboratory. In the laboratory, the matric suction can be acted on the sample by keeping the
pore water pressure equal to zero and putting into the sample a positive air pore pressure.
Therefore the matric suction in the soil sample can be changed [(u
a
- u
w
) where u
w
is kept
equal to zero by acting different air pressure into the sample. This method is in the group of
“axial transitivity” technique.
2.3 THE SHEAR STRENGTH OF UNSATURATED SOIL
2.3.1. The saturated soil shear strength equation
- 6 -
Terzaghi (1936) used the Mohr – Coulomb criteria and the effective stress definition to
describe saturated soil shear strength:
ff
= c’ + (s
f
- u
w
)
f
tan’ (2.11)
where:
ff
– shear stress on the failure plane at failure; c’ – the effective cohesion; (s
f
- u
w
)
f
–
the effective normal stress on the failure plane at failure; ’ – the effective internal friction
angle.
2.3.2. The shear strength equation of unsaturated soil
Bishop (1959) proposed a shear strength equation as follow:
= c’ + [(s - u
a
) + (u
a
- u
w
)] tan’ (2.12)
where: c’ - the effective cohesion; ’ - the effective internal friction angle of saturated soil, s
- the total normal stress, u
a
- pore air pressure, and - a parameter related to the soil degree
of saturation, vary from 0 to 1.
Fredlund et al. (1978) suggested a shear strength equation for unsaturated soil by using
stress state variables (s-u
a
) and (u
a
-u
w
) as follow:
b
f
wa
f
afff
uuuc
s
tan'tan'
(2.13)
where:
ff
– the shear stress on the failure surface at failure state, c’ - effective cohesion, (s
f
-
u
a
)
f
– net normal stress on the failure surface at failure state, ’ – effective internal friction
angle corresponding to the net normal stress (s
f
-u
a
)
f
, (u
a
-u
w
)
f
– matric suction at failure state,
and
b
– the angle that shows the velocity of the increase in shear strength corresponding to
the increase in the matric suction (u
a
-u
w
)
f
at failure state.
The shear strength of unsaturated soil is usually defined from the consolidated drained
triaxial test (the CD test) or the triaxial test with constant moisture content (the CW test).
Vanapalli et al. (1996) and Fredlund et al. (1996) suggested a function to predict the shear
strength of unsaturated soil from the SWCC and effective shear strength parameters (c’ and
’) as follow:
'tan'tan'
s
waan
uuuc
(2.15)
where: - a adjusted argument used to find the calculated values that fit the measured
values; - the volumetric water content that has been normalized ( = q
w
/q
s
); q
w
–
volumetric water content; q
s
– volumetric water content at saturation
2.4. THE METHOD TO ANALYZE THE PERMEABILITY IN THE SATURATED AND
UNSATURATED ENVIRONMENT
The soil permeability coefficient can be determined by indirect method from SWCC or
direct method (the permeability test). Leong and Rahardjo (1977) suggested an equation to
predict the permeability coefficient based on the saturated permeability coefficient and the
soil water characteristic curve, as follow:
p
s
w
s
p
sw
kkk
q
q
(2.19)
where: p is a constant. Fredlund et al. (2011) has determined constant p for many pair of
data and has found out the variation of p from 2,4 to 5,6 for different soils. The average
value of p for any type of soil is 3,29.
2.5. The earthen stability analysis method
The limit equilibrium method using effective stress and pore water pressure for determining
the slope stability factor of safety is applied popularly in reality to analyze and assess the
stability of earth dams. When calculating the stability of slope concerning the negative pore
water pressure, it is possible to use the “total cohesion” method - add the matric suction to
the soil cohesive (Ching and et, al, 1984) to find out the factor of safety equation that
- 7 -
satisfies both positive and negative pore pressure (Fredlund, 1989, 1995; Rahardjo and
Fredlund, 1993), or using nonlinear relationship between the shear strength and matric
suction (Rahardjo, Fredlund and Vanapali, 1992). In the “total cohesion” method,
unsaturated soil is considered to have total cohesive including the effective cohesion and
matric suction.
2.6. CONCLUSION of CHAPTER 2
The characterised parameters for unsaturated soils are the SWCC, permeability coefficient
and shear strength. SWCC is defined using experimental method and calculated equations.
The permeability coefficient and shear strength of unsaturated soil can be defined indirectly
through the SWCC or directly through the laboratory tests. When analyzing the slope
stability, it is possible to apply the “completed cohesive” method to consider the influence of
unsaturated soil parameters to the factor of safety.
CHAPTER 3
EXPRERIMENTAL Research FOR OBTAINING UNSATERATED SOIL
PROPERTIES
3.1. BASIS SOIL PROPERTIES
Thesis is concentrated to study on unsaturated soil at three areas in Vietnam: on the North –
West, North - East and in the Central part. The compacted soils used for testing are at the
Ninhthuan dam of Phuocthang village, Bacai Distric and Ninhthuan province. The second
compacted soils for testing is at the Khecat earth fill dam of Hailang village, Tienyen district
and Quangninh province. The third soils are undisturbed samples at the natural slope of
Yenbai city, Yenbai province. The procedure of the soil testing was following TCVN 1995
standards and soil properties are presented in Tables 3.1a and 3.1b.
Table 3.1a. Soil properties of the compacted specimens
Soil properties Notation
Unit
Songsat 1
Songsat 2
Songsat 3
Khecat
Particle size
>10.000 mm
% 0,00 0,21 2,59 0,00
5,000 - 10,000 mm
% 0,00 2,08 2,41 0,00
Gravel 2,000 - 5,000 mm
% 0,00 4,89 6,25 9,00
Sand 0,500 - 2,000 mm
% 0,00 11,19 10,30 7,00
0,250 - 0,500 mm
% 15,34 5,80 5,54 6,00
0,100 - 0,250 mm
% 15,11 9,69 10,30 13,00
0,050 - 0,100 mm
% 33,28 30,17 29,69 8,00
Silt 0,010 - 0,050 mm
% 12,22 9,68 8,93 15,00
0,005 - 0,010 mm
% 0,97 1,29 1,22 11,00
Clay <0,005 mm
% 23,07 25,00 22,78 31,00
Density G
s
2,680 2,725 2,731 2,710
Liquid limit W
l
%
24,83 23,83 24,08 52,60
Plastic limit W
p
%
14,99 13,20 15,16 34,47
Plastic index I
p
%
9,84 10,62 8,91 18,13
Maximum dry density
dmax
g/cm
3
1,867 2,024 1,997 1,550
Optimum water content W
opt
%
12,73 11,06 10,97 24,50
Table 3.1b. Soil properties of the Yenbai undisturbed samples
Soil properties Notation
Unit
Yenbai 1
Yenbai 2
Yenbai 3
Yenbai 4
Yenbai 5
- 8 -
Air pressure supply
High-air
entry
disk
Soil specimen
Water compartment
Burette
Rubber
bag
Wire mesh
Stand
Pressure chamber
Grain size
>10.000 mm
% 6,08 0,00 0,00 0,00 0,00
5,000 - 10,000 mm
% 8,08 8,23 0,85 0,17 2,49
Gravel 2,000 - 5,000 mm
% 24,62 21,64 1,60 3,29 5,46
Sand 0,500 - 2,000 mm
% 6,22 7,52 3,62 9,74 6,10
0,250 - 0,500 mm
% 3,81 4,71 4,70 3,68 4,23
0,100 - 0,250 mm
% 4,97 5,11 6,20 5,52 5,33
0,050 - 0,100 mm
% 8,67 13,02 20,34 17,48 17,21
Silt 0,010 - 0,050 mm
% 8,17 9,34 29,43 28,42 25,57
0,005 - 0,010 mm
% 2,12 2,99 6,47 5,46 6,94
Clay <0,005 mm
% 27,25 27,44 26,79 26,23 26,67
Density G
s
2,730 2,730 2,720 2,720 2,720
Liquid limit W
l
%
51,14 50,73 53,05 55,64 51,52
Plastic limit W
p
%
34,60 34,12 37,10 40,60 35,70
Plastic index I
p
%
16,54 16,61 15,95 15,04 15,82
3.2. Tests for obtaining Soil-water characteristic curve (SWCC)
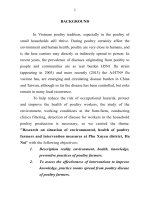
3.2.1. Apparatus for the Soil-water Characteristic Curve Tests
The pressure plate was used for obtaining the SWCC. Figure 3.1 shows the set up of the
pressure plate with a 5 bar high air-entry ceramic disk and a rubber membrane beneath
the disk.
3.2.2. Soil specimen preparation
The 12 statically compacted soil
specimens used were 20 mm in
thickness, 62 mm in diameter and
volume of 60cm3. The dry density
was compacted at 95% of the
maximum dry density and optimum
water content. The soil sample at
Yenbai was trimmed with 20 mm in
thickness and volume of 60cm
3
.
The specimens used for obtaining
SWCC were prepared in the same
manner as the soil specimens for triaxial tests. The space between the disk and the rubber
membrane serves as a water compartment. The water compartment is connected to a
burette line that is opened to atmospheric pressure. The number of specimens that can be
tested in a pressure plate depends on the available disk space. The ceramic disk was
saturated prior to test.
3.2.3. Saturation soil specimen and pressure plate
The saturation was done by pouring the de-aired distilled water on top of the disk and
applying a high air pressure of 500 kPa while opening the valve of the burette line for
about 1 hour. Due to the high pressure in the chamber, the distilled de-aired water
infiltrated through the ceramic plate. The soil properties are presented in Tables 3.2a and
3.2b.
Table 3.2. Soil properties of the compacted specimen
Properties Notation
Unit
Songsat 1
Songsat 2
Songsat 3
Khecat
Water content W
cb
%
12,73 11,06 10,97 24,50
Figure 3.1. Pressure plate for obtaining SWCC
- 9 -
Wet unit weight
cb
g/cm
3
2,000 2,136 2,105 1,830
Dry unit weight
dcb
g/cm
3
1,774 1,923 1,897 1,470
Volumetric water content
q
s
0,348 0,345 0,390 0,456
Coefficient
of permeability at
saturated condition
k
s
m/s
5,0.10
-8
1,6.10
-7
2,0.10
-7
1,9.10
-8
Table 3.2b. Properties of undisturbed soil specimen of Yenbai
Properties Notation
Unit
Yenbai 1
Yenbai 2
Yenbai 3
Yenbai 4
Yenbai 5
Water content W
%
25,38 21,68 24,78 37,18 36,41
Unit weight
w
g/cm
3
1,712 1,649 1,613 1,741 1,613
Dry unit weight
d
g/cm
3
1,365 1,355 1,293 1,269 1,182
Volumetric water content
at saturated condition
q
s
0,447 0,410 0,496 0,510 0,515
Coeficient of
permeability
at saturated condition
k
s
m/s
6,5.10
-7
2,4.10
-7
9,1.10
-8
9,6.10
-8
6,2.10
-7
3.2.4. Tests for obtaining SWCC
In this test, the air pressure was applied at different level. The pore-air pressure, ua was
applied by air pressure, while water pressure opened to atmospheric pressure (i.e., u
a
=
20 kPa and u
w
= 0 kPa), therefore the matric suction changing due to the change in
applying air pressure. The tests for obtaining SWCC were done with the matric suction of
10kPa, 20 kPa, 50 kPa, 100 kPa, 200 kPa and 400 kPa.
3.2.5. Test results
Figures 3.3a and 3.3b show the SWCC of 9 compacted soil specimens. As indicated in
Figure 3.3a, there was a significant decrease in volumetric water content when the matric
suction in the specimen exceeded the air-entry value. The soil-water characteristic curve of
the specimen indicated that the air-entry value (AEV) of the Khecat compacted soil
specimen was 40 kPa. The air-entry values of the Songsat soil specimens 1, 2 and 3, were
20,04kPa, 20,08kPa and 11,8kPa respectively. The air-entry values of the Yenbai soil
specimens 1, 2, 3, 4 and 5, were 31kPa, 32kPa, 28kPa and 29kPa as show in figure 3.3b. The
results show that the increase Ip with increasing the air-entry value.
0,25
0,27
0,29
0,31
0,33
0,35
0,37
0,39
0,41
0,43
0,45
1 10 100 1000
Matric suction, (u
a
- u
w
) (kPa)
Volumetric water content,
w
Khecat specimen
Songsat specimen 1
Songsat specimen 2
Songsat specimen 3
0,10
0,15
0,20
0,25
0,30
0,35
0,40
0,45
0,50
0,55
1 10 100 1000
Matric suction, (u
a
- u
w
) (kPa)
Volumetric water content,
w
Yenbai specimen 1
Yenbai specimen 2
Yenbai specimen 3
Yenbai specimen 4
Yenbai specimen 5
Figure 3.3a. SWCC of Khecat compacted soil
specimens
Figure 3.3b. SWCC of the Yenbai
compacted soil specimens
3.2.6. Calculation coefficient of permeability from SWCC
3.2.6.1. Calculation SWCC by using Fredlund vµ Xing (1994) method
Fredlund and Xing (1994) method have been widely used. However, Fredlund and Xing
(1994) method was developed based on the test results in oversea countries mainly from
North America, that have some different soil properties in Vietnam. Therefore, the study
Air-entry value = 29 kPa
Air-entry value = 32 kPa
Air-entry value = 31 kPa
Air-entry value = 40 kPa
Air-entry value = 11,8 kPa
Air-entry value
= 20,04 kPa
Air-entry value = 20,08 kPa
- 10 -
proposed the equation to determine values of m, n based on the Fredlund and Xing (1994)
equation as follow:
m = 3,4ln
i
is
C
q
q
(3.2) n =
*2
31,1
1
s
mC
i
m
(3.3)
Comparison the results with Fredlund vµ Xing (1994) method
The detailed of the calculation SWCC based on this study are presented in tables III.2 and
III.6 Appendix III of the full thesis. The comparison calculation of SWCC by using fredlund
and Xing (1994) and the results from this study are presented in Figures from 3.4 to 3.7.
0,0
0,1
0,2
0,3
0,4
0,5
0,6
0,7
0,1 1 10 100 1000 10000 100000 1000000
Matric suction, u
a
- u
w
(kPa)
Volumetric water content,
q
w
Measured
Predicted (Fredlund and Xing, 1994)
Predicted (Proposed Equation)
0,0
0,1
0,2
0,3
0,4
0,5
0,6
0,1 1 10 100 1000 10000 100000 1000000
Matric suction, u
a
- u
w
(kPa)
Volumetric water content,
q
w
Measured
Predicted (Fredlund and Xing, 1994)
Predicted (Proposed Equation)
Figure 3.4. SWCC of the Khecat
compacted soil
Figure 3.5. SWCC of the Songsat
compacted soil specimen 1
0,0
0,1
0,2
0,3
0,4
0,5
0,6
0,1 1 10 100 1000 10000 100000 1000000
Matric suction, u
a
- u
w
(kPa)
Volumetric water content,
w
Measured
Predicted (Fredlund and Xing, 1994)
Predicted (Proposed Equation)
0,0
0,1
0,2
0,3
0,4
0,5
0,6
0,1 1 10 100 1000 10000 100000 1000000
Matric suction, u
a
- u
w
(kPa)
Volumetric water content,
q
w
Measured
Predicted (Fredlund and Xing, 1994)
Predicted (Proposed Equation)
Figure 3.6. SWCC of the Songsat
compacted soil specimen 2
Figure 3.7. SWCC of the Songsat
compacted soil specimen 3
The comparison results of the Yenbai soil specimen are presented in Appendix III of full
thesis. The figures show that the prediction results from this study are good agreement to
the experimental results than those results from Fredlund and Xing (1994) method.
3.2.6.2. Prediction coeficient of permeability function from SWCC
This study was calculated coeficient of permeability at different volumetric water content by
using equation 2.10 with m and n from equation 3.2 and 3.3. The prediction of coefficient
of permeability from SWCC by this study and Fredlund and Xing 1994 for compacted soil
specimens are presented in Figures 3.8, 3.9, 3.10 and 3.11.
1,0E-21
5,0E-09
1,0E-08
1,5E-08
2,0E-08
2,5E-08
0,1 1 10 100 1000 10000 100000 1000000
u
a
- u
w
(kPa)
k
w
(m/s)
Predicted from SWCC by Fredlund and Xing (1994)
Predicted from SWCC by this study
1,0E-21
1,2E-08
2,4E-08
3,6E-08
4,8E-08
6,0E-08
7,2E-08
0,1 1 10 100 1000 10000 100000 1000000
u
a
- u
w
(kPa)
k
w
(m/s)
Predicted from SWCC by Fredlund and Xing (1994)
Predicted from SWCC by this study
Figure 3.8. Coefficient of permeability
versus matric suction of Khecat specimen
Figure 3.9. Coefficient of permeability
versus matric suction of Songsat specimen 1
q
s
= 0,456
a = 71,5
m = 0,65
n = 0,90
a = 71,5
m = 0,60
n = 0,52
q
s
= 0,348
a = 80,0
m = 0,75
n = 0,66
a = 80,0
m = 0,69
n = 0,38
q
s
=0,345
a = 70,0
m = 0,37
n = 0,86
a = 70,0
m = 0,35
n = 0,50
q
s
= 0,390
a = 40,0
m = 0,79
n = 0,65
a = 40,0
m = 0,73
n = 0,37
- 11 -
1,0E-21
4,0E-08
8,0E-08
1,2E-07
1,6E-07
2,0E-07
2,4E-07
0,1 1 10 100 1000 10000 100000 1000000
u
a
- u
w
(kPa)
k
w
(m/s)
Predicted from SWCC by Fredlund and Xing (1994)
Predicted from SWCC by this study
1,0E-21
5,0E-08
1,0E-07
1,5E-07
2,0E-07
2,5E-07
3,0E-07
0,1 1 10 100 1000 10000 100000 1000000
u
a
- u
w
(kPa)
k
w
(m/s)
Predicted from SWCC by Fredlund and Xing (1994)
Predicted from SWCC by this study
Figure 3.10. Coefficient of permeability
versus matric suction of Songsat specimen 2
Figure 3.11. Coefficient of permeability
versus matric suction of Songsat specimen 3
The results from figures show that the coefficient of permeability with respect to matric
suction based on this study is good agreement to the experimental data.
3.3. Obtaining SHEAR STRENGTH OF UNSATURATED SOILS USING DIRECT
SHEAR APPARATUS
3.3.1. Direct shear apparatus
Layout of the direct shear apparatus is
presented in Figure 3.12.
3.3.2. Direct shear test procedure
Right after suction equilibrium at each
matric suction value, three soil samples have
been tested using direct shear apparatus at
normal stress of 100kPa, 200kPa and
300kPa. The soil specimens have been tested
immediately after taken out of pressure plate
in order to keep suction unchanged. The
shearing rate was slow enough in order to prevent pore-water pressure increase. The
shearing rate in the direct shear test of 0,02mm/minute has been chosen. Shearing was
terminated when the shear stress reach a peak value have been observed.
3.3.3. Testing program
The study has been tested for spacemen at Khecat compacted sample represented for the
North and represented for the Central part was Songsat compacted specimens 2 and 3. Each
soil type was tested with 12 specimens.
3.3.4. Presentation of the result
3.3.4.1. Testing result of the Khecat
compacted soil
Figure 3.14 show the experimental results on
extended Morh-Coulomb failure envelope. The
results from figure 3.14 show that the effective
friction angle, ’ = 23
0
and effective cohesion,
c’ = 34 kPa. The effective cohesion increase
with increasing in matric suction, but effective
friction angle was remained nearly unchanged
and
b
decrease. The
b
= ’ when the matric
suction was smaller than air-entry value.
The intersection lines between extended Morh-
Coulomb failure envelope and ~ (s - u
a
) plane
are show in Figure 3.15. The results from
figure 3.15 show that the shear strength the
increase
Figure 3.12. Lay out of the direct shear
apparatus
Figure 3.14. Extended Mohr-Coulomb
failure envelope of Khecat specimen
- 12 -
with increasing in net
normal stress. At
specific value of net
normal stress, the shear
strength is increase
when matric suction
increase. The shear
strength envelope on ~
(s - u
a
) is nearly
paralleled and proves
that the shear strength is
increased when matric
suction increased.
Figure 3.16 show the intersection line between extended Morh-Coulomb failure envelope
and ~ (s - u
a
) plane at net normal stress of zero kPa. The result from this figure shows that
the relationship between shear stress and matric suction is nonlinear.
3.3.4.2. Testing result of the Songsat 2
compacted soil
The experimental results on extended Morh-
Coulomb failure envelope are shown in figure
3.17. The results from figure 3.17 show that
the effective friction angle, ’ = 13
0
and
effective cohesion, c’ = 13 kPa. The
b
= ’
when the matric suction was smaller than air-
entry value. The effective cohesion and shear
strength increase with increasing in matric
suction, but effective friction angle was
remained nearly unchanged and
b
decrease.
Figure 3.18 shows the intersection lines
between extended
Morh-Coulomb
failure envelope and
~ (s - u
a
) plane.
The interception line
of the extended
Morh-Coulomb
failure envelope and
~ (s - u
a
) plane at
net normal stress is
shown in figure 3.19.
The results from
figure 3.19 clearly
show that the shear strength envelops with respect to matric suction is nonlinear. The
b
is as
13
0
at matric suction less than air-entry value and decrease as 7
0
at matric suction of 200kPa.
3.3.4.3. Testing result of the Songsat 3 compacted specimens
0
100
200
300
400
0 100 200 300 400
Net normal stress, (
s
- u
a
) (kPa)
Shear strength,
f
(kPa)
ua - uw = 0 kPa
ua - uw = 20 kPa
ua - uw = 50 kPa
ua - uw = 100 kPa
ua - uw = 200 kPa
0
100
200
300
0 100 200 300
Matric suction, (u
a
- u
w
) (kPa)
Shear strength,
f
(kPa)
Figure 3.15. Relationship
between
f
and (s-u
a
) at
different matric suction
Figure 3.16. Relationship
between
f
and (u
a
-u
w
) at net
normal stress of zero 0 kPa
Figure 3.17. Extended Morh-Coulomb
failure envelope of Songsat specimen 2
0
100
200
300
0 100 200 300 400
Net normal stress, (
s
- u
a
) (kPa)
Shear strength,
f
(kPa)
ua - uw = 0 kPa
ua - uw = 20 kPa
ua - uw = 50 kPa
ua - uw = 100 kPa
ua - uw = 200 kPa
0
100
200
300
0 100 200 300
Matric suction, (u
a
- u
w
) (kPa)
Shear strength,
f
(kPa)
Figure 3.18. Relationship
between
f
and (s-u
a
) at
different matric suction
Figure 3.19. Relationship
between
f
and (u
a
-u
w
) at net
normal stress of zero 0 kPa
’ = 23
o
’ = 13
o
- 13 -
Figure 3.20 show the experimental results on
extended Morh-Coulomb failure plane
envelope. The results from figure 3.20 show
that the effective friction angle, ’ = 13
0
and
effective cohesion, c’ = 14 kPa. The shear
strength is increased with the increasing in
matric suction, but
b
decrease from
b
= ’ at
matric sution smaller than air-entry value. The
effective friction angle remains nearly
unchanged (’ 13
0
).
The intersection lines between extended Morh-
Coulomb failure envelope and ~ (s - u
a
)
plane are show in
Figure 3.21. The
results from figure
3.21 show that the
effective friction
angle is nearly
constant with matric
suction increase.
Figure 3.22 show the
intersection line
between extended
Morh-Coulomb
failure envelope and
~ (s - u
a
) plane at net normal stress of zero kPa. The result from this figure shows that the
relationship between shear stress and matric suction is nonlinear.
3.4. DETERMINATION OF SHEAR STRENGH FOR UNSATURATED SOIL BY
TRIAXIAL COMPRESSION TEST
3.4.1. Modified triaxial compression
apparatus for unsaturated soil test
Modified triaxial compression apparatus used
in this experiment is similar to Fredlund and
Rahardjo one (1993) (Fig 3.23). The feature
of this pressure cell is to replace the base
porous disk by the high pressure ceramic one
to control and measure the pore pressure of
unsaturated soil. To control the pore air
pressure during the consolidation and shear,
the backpressure vane of the normal pressure
cell becomes the control vane of air pore
pressure (C). The high pressure disk in this
research is the 5 bar (500kPa) one;
3.4.2. Process and procedure of test
The triaxial compression test procedure for
saturated soil sample (Head, 1986) and for
unsaturated one (Fredlund vµ Rahardjo, 1993) have been used here. The initial matric
suctions of the specimens were established using the axis-translation technique (Hilf, 1956).
Figure 3.20. Extended Morh-Coulomb
failure envelope of Songsat specimen 3
0
100
200
300
0 100 200 300 400
Net normal stress, (
s
- u
a
) (kPa)
Shear strength,
f
(kPa)
ua - uw = 0 kPa
ua - uw = 20 kPa
ua - uw = 50 kPa
ua - uw = 100 kPa
ua - uw = 200 kPa
0
100
200
300
0 100 200 300
Matric suction, u
a
- u
w
(kPa)
Shear strength,
f
(kPa)
Figure 3.21. Relationship
between
f
and (s-u
a
) at
different matric suction
Figure 3.22. Relationship
between
f
and (u
a
-u
w
) at net
normal stress of zero 0 kPa
Figure 3.23. Modified triaxial cell for
unsaturated soils testing (after Fredlund
and Rahardjo, 1993)
’ = 13
o
- 14 -
Soil sample preparation
The soil samples are compacted at dry unit mass equal 95% of maximum unit one with
corresponding moisture content after compacting (table 3.2). The height and diameter of the
soil sample are respectively equal 100mm and 50mm.
Saturation phase of soil sample
All of the samples used in this experiment programme are saturated first aiming at creating
the identically initial moisture content. After that the samples are saturated by means of
gradually increasing the confining pressure steps (σ
3
) and backpressures, u
w
, under effective
stress equal 10kP until the coefficient of water pore pressure B attains proximity of 1.
Consolidation phase
After finishing saturation phase, the soil sample are consolidated under confined pressure,
σ
3
, and pore water pressure, u
w
, or in other words it is isotropically consolidated under
require effective stresses, (σ
3
-u
w
). The consolidation phase is considered to end when the
water volume escaped from the soil sample unchanged and the excess pore pressure is
completely dissipated. The time for consolidation phase is about 1 hour.
Phase of creating and balancing the matric suction in soil sample
The matric suction balancing phase is to create the matric suction inside the soil sample
when finishing the consolidation one. In the process of creating the matric suction, the soil
sample will be consolidated by the real confined pressure (s
3
- u
a
) and the matric suction (u
a
- u
w
). This phase is considered to finish when the escaped water is quasi 0. The time for
balancing the matric suction elongates about 3 to 5 days.
The shearing phase of soil sample
When attaining the condition of balancing the matrix suction phase under applied pressures
(i.e s
3
, u
a
vµ u
w
), the soil sample is sheared by axial pressure in conditions of air escape and
no for pore water (schema CW) or both air and pore water escape (schema CD), with
constant velocity of shearing. In this study, the displacement velocity of 0,02 mm/minute is
selected. The procedure of shearing is finished at maximun deviatoric stress. If the above
failure condition is not accessible, stop the experiment at 25% of axial deformation. The
shearing phase elongates in 24 hours.
3.4.3 Test programmed
Triaxial compression test was using the compacted soil samples of Khecat and Songsat 3, in
which 9 samples of Khecat (according to schema CD) and 18 samples of Songsat 3
(according to schema CD and CW).
3.4.4. The results of triaxial compression test using consolidated - Drained (CD)
schema
3.4.4.1 Experimental results of Khecat compacted samples
3.4.4.1.1 Shear strength properties of experimental soil samples
The figures 3.33 and 3.35 show the relationship between deviator stresses and axial strains
under different real confined pressure with the same matric suction equal 0 kPa and 200kPa.
0
200
400
600
800
1000
0 8 16 24 32 40
Axial strain,
(%)
Deviatoric stress, (
1
-
3
)
(kPa)
CD50-0
CD100-0
CD200-0
0
200
400
600
800
1000
0 8 16 24 32 40
Axial strain,
(%)
Deviatoric stress, (
1
-
3
) (kPa)
CD50-200
CD100-200
CD200-200
Figure 3.33. (s
1
-s
3
) versus with the
same initial matric suction of 0 kPa.
Figure 3.35. (s
1
-s
3
) versus with the
same initial matric suction of 200 kPa.
- 15 -
At the same matric suction equal 0 kPa, the more the samples sustained higher net confining
pressure, the more the peak deviator stress increases. At the same matric suction, when the
real confined pressure gradually increases on the soil sample, its shear strength also
increases correspondingly.
3.4.4.1.2. The extended Mohr-Coulomb failure
envelope surface
The extended Mohr-Coulomb failure envelope
surface is given in the figure 3.39. On the
figure 3.39, it is shown that the envelope
surface is curve along the matric suction axe.
Projection of the failure envelope surface on
the ~ (s – u
a
) plane gives the matric suction
contours as shown in the figure 3.40. These
lines have different cohesive intercepts belong
to their correspondent matric suctions. The
intercepts become effective cohesion c’ = 37
kPa when the matric suction tends to 0. All
identical matric suction lines have the same slope
angle ’ = 23º.
Projections of the failure
envelope surfaces on the
~ (u
a
- u
w
) plane are
curve lines shown in the
figure 3.41. These
projections show the
increase of shear strength
when the matric suction
increases at each real
normal stress.
The increasing law of the
shear strength with matric
suction is curvilinear. At
the same matric suction, the more real confined pressure is great, the more shear strength
increases.
3.4.4.2. Experimental results of Songsat 3 compacted samples
3.4.4.2.1. Shear strength properties of experimental soil sample
The relationships between deviator stress and strain under different confined pressures at the
same matric suction equal 0 kPa and 200 kPa are shown in the figures 3.44 and 3.46. From
figure 3.44, it is shown that the peak deviator stress is influenced by the real confined
pressure: the increase of confined pressure increases the peak deviator stress.
Figure 3.39. Extended Mohr-Coulomb
failure envelope of Khecat specimen for
CD tests
0
100
200
300
400
0 100 200 300 400 500 600
Net normal stress, (
s
- u
a
) (kPa)
Shear strength,
f
(kPa)
ua - uw = 0 kPa
ua - uw = 100 kPa
ua - uw = 200 kPa
0
100
200
300
400
500
0 100 200 300
Matric suction, (u
a
- u
w
) (kPa)
Shear strength,
f
(kPa)
= 0 kPa
= 50 kPa
= 100 kPa
= 200 kPa
s
3
- u
a
s
3
- u
a
s
3
- u
a
s
3
- u
a
Figure 3.40. Horizontal
projections of the failure envelope
onto the
f
versussu
a
) plane
Figure 3.41. Horizontal
projections of the failure
envelope onto the
f
versusu
a
– u
w
) plane
0
80
160
240
320
0 5 10 15 20 25 30
Axial strain,
(%)
Deviatoric stress, (
1
-
3
)
(kPa)
CD50-0
CD100-0
CD200-0
0
80
160
240
320
0 5 10 15 20 25 30
Axial strain,
(%)
Deviatoric stress, (
s
1
-
s
3
) (kPa)
CD50-200
CD100-200
CD200-200
Figure 3.44. (s
1
-s
3
) versus with the
same initial matric suction of 0 kPa.
Figure 3.46. (s
1
-s
3
) versus with the
same initial matric suction of 200 kPa.
- 16 -
With the matric suction equal 200 kPa, the
shear strength is more increased in comparison
with which equal 0 and 100 kPa. This is shown
that the matric suction increases the shear
strength of the sample.
3.4.4.2.2 The extended Mohr- Coulomb failure
envelope surface
The extended Mohr-Coulomb failure envelope
surface is shown in the figure 3.50. Figure 3.50
shows the trend of decreasing
b
when
increasing the matric suction however ’ nearly
unchanged and
b
= ’ when the matric suction
is less than the critical air entry value.
Projections of the failure envelope surfaces on
the ~ (s – u
a
) plane give the matric suction
contours. All identical
matric suction lines have
the same slope angle ’ =
13
0
.
Projections of the failure
envelope surfaces on the
~ (u
a
- u
w
) plane are shown
by the curves in the figure
3.52. The intersection lines
show the increase of shear
strength value when
increasing the matric
suction.
3.4.5. The results of triaxial compression test with unchanged moisture content (CW)
3.4.5.1. Shear strength characteristics of experimental soil samples
The figures 3.55 and 3.57 show the relationship between deviator stresses and axial strains
under different real confined pressures (50 kPa, 100 kPa and 200 kPa) acting upon soil
samples with each same matric suction equal 0 kPa and 200 kPa alternatively. This is shown
that the more unsaturated condition of the sample the more increase of the shearing strength.
3.4.5.2. Excess pore pressure
The figures 3.58 and 3.60 show the variation of pore water pressure during shear in triaxial
test with constant water content (CW) on saturated soil samples under different real confined
pressures at the same initial matric suction equal 0 kPa and 200 kPa respectively.
Figure 3.50. Extended Mohr-Coulomb
failure envelope of Songsat specimen 3
for CD tests
0
100
200
300
0 100 200 300 400
Net normal stress, (
s
- u
a
) (kPa)
Shear strength,
f
(kPa)
ua - uw = 0 kPa
ua - uw = 100 kPa
ua - uw = 200 kPa
0
100
200
300
0 100 200 300
Matric suction, (u
a
- u
w
) (kPa)
Shear strength,
f
(kPa)
= 0 kPa
= 50 kPa
= 100 kPa
= 200 kPa
s
3
- u
a
s
3
- u
a
s
3
- u
a
s
3
- u
a
Figure 3.51. Horizontal
projections of the failure envelope
onto the
f
versussu
a
) plane
Figure 3.52. Horizontal projections
of the failure envelope onto the
f
versusu
a
– u
w
) plane
0
80
160
240
320
0 5 10 15 20 25 30
Axial strain,
(%)
Deviatoric stress, (
1
-
3
)
(kPa)
CW50-0
CW100-0
CW200-0
0
80
160
240
320
0 5 10 15 20 25 30
Axial strain,
(%)
Deviatoric stress, (
s
1
-
s
3
) (kPa)
CW50-200
CW100-200
CW200-200
Figure 3.55. (s
1
-s
3
) versus with the
same initial matric suction of 0 kPa.
Figure 3.57. (s
1
-s
3
) versus with the
same initial matric suction of 200 kPa.
c’=14 kPa
- 17 -
3.4.5.3. The extended Mohr-Coulomb failure
envelope surface
The extended Mohr-Coulomb failure envelope
surface is shown in the figure 3.62. From this
figure, it is seen that: when increasing the matric
suction,
b
is reduced from
b
= ’ at the 0 kPa
until
b
= 4
0
in accordance with 200 kPa matric
suction. The angle of internal friction ’of the
soil sample seemed still to keep true to 13
0
despite the matric suction increases.
Projection of the failure envelope surface on the
~ (s – u
a
) plane is shown in figure 3.66. All of
identical matric suction lines have the same
slope angle ’ = 13
0
.
Projection of the failure
envelope surface on the
~ (u
a
- u
w
) plane is shown
in figure 3.67. The
intersection lines show the
increase of shear strength
when increasing the
matric suction. The
relationships in the figure
3.67 show that the shear
strength of the soil
samples increase when the matric suction increase. The real confined pressures increase also
make to increase the shear strength of the soil sample respectively.
3.5 ANALYSIS OF TEST RESULT
3.5.1. Comparison of test results
The figures 3.69, 3.70 and
3.71 show the comparison of
the shear strength versus
matric suction curves
according to CD and CW
methods in the triaxial
compression test with the
direct shear test curves, from
which it seems no much
0
40
80
120
0 5 10 15 20 25 30
Axial strain,
(%)
Variation of pore water pressure,
u
w
(kPa)
CW50-0
CW100-0
CW200-0
0
40
80
120
0 5 10 15 20 25 30
Axial strain,
(%)
Variation of pore water pressure,
u
w
(kPa)
CW50-200
CW100-200
CW200-200
Figure 3.58. u
w
versus with the same
initial matric suction of 0 kPa.
Figure 3.60. u
w
versus with the same
initial matric suction of 200 kPa.
Figure 3.62. Extended Mohr-
Coulomb failure envelope of Songsat
specimen 3 for CW tests
0
100
200
300
0 100 200 300 400
Net normal stress, (
s
- u
a
) (kPa)
Shear strength,
f
(kPa)
ua - uw = 0 kPa
ua - uw = 100 kPa
ua - uw = 200 kPa
0
100
200
300
0 100 200 300
Net normal stress, (u
a
- u
w
) (kPa)
Shear strength,
f
(kPa)
= 50 kPa
= 100 kPa
= 200 kPa
s
3
- u
a
s
3
- u
a
s
3
- u
a
Figure 3.66. Horizontal
projections of the failure envelope
onto the
f
versussu
a
) plane
Figure 3.67. Horizontal
projections of the failure envelope
onto the
f
versusu
a
– u
w
) plane
0
50
100
150
200
0 50 100 150 200 250
Matric suction, (u
a
- u
w
) (kPa)
Shear strength,
f
(kPa)
Direct shear tests
CD tests
0
50
100
150
200
0 50 100 150 200 250
Matric suction, u
a
- u
w
(kPa)
Shear strength,
f
(kPa)
Direct shear tests
CD tests
Figure 3.69.
f
versus (u
a
-
u
w
) of Khecat specimen
Figure 3.70.
f
versus (u
a
-
u
w
) of Songsat specimen 3
- 18 -
difference between the two
above results.
Figure 3.72 shows the
comparison of the shear
strength versus matric
suction curves of two
triaxial compression tests
carried out according to CD
and CW methods for the
SongSat 3 compacted soil
samples. It is shown that the
CW curve fairly near the CD one.
Table 3.6 gives the effective parameters of the shear strength (φ' and c') of test soil samples.
As seen in the table 3.6, the shear strength effective parameters (φ' and c') of the same
material done in different shear methods (direct shear, consolidated-drained and constant
water content shear) give nearly the same. As also seen that when the matric suction equal 0,
φ
b
φ' and when the matric suction increases until some value, the angle φ
b
gradually
decreases.
Table 3.6. Comparison of the effective parameters of shear strength
Khecat material quarry Songsat 3 material quarry
Effective parameters of shear
strength
Direct
shear test
CD test
Direct
shear test
CD test CW test
'(degree)
23°29' 23°11' 13°03' 13°02' 13°00'
c' (kPa) 34,00 37,00 13,53 14,20 14,00
b
(degree)
0 23,47 23,18 13,15 13,11 13,08
20 23,35 12,99
50 23,03 12,37
100 10,11 7,97 5,24 4,86 4,12
Matric suction (kPa)
200 8,35 6,28 4,40 4,01 3,60
3.5.2. Comparison between the test results and the results calculated from Fredlund
and Vanapalli's experimental formula(1996).
From the test results of shear strength for soil samples here, the method of successive
approximate is used by the author to define the
correction factor in the Fredlund and Vanapalli's
equation (1996) aiming at bringing into the
calculated results best fitted with experiment. The
relationship between and I
p
for all of these soils is
shown in the figure 3.73. The figures from 3.74 to
3.79 express the relationships between the shear
strength and matric suction (u
a
- u
w
) of the
compacted soil samples plotted from direct shear
and compression triaxial tests with correction factor
extracted from the plot 2.10 established by
Fredlund and Vanapalli (2001) and from our plot
3.73.
0
50
100
150
200
0 50 100 150 200 250
Matric suction, u
a
- u
w
(kPa)
Shear strength,
f
(kPa)
Direct shear tests
CW tests
0
50
100
150
200
0 50 100 150 200 250
Matric suction, u
a
- u
w
(kPa)
Shear strength,
f
(kPa)
CW tests
CD tests
Figure 3.71.
f
versus (u
a
-
u
w
) of Songsat specimen 3
Figure 3.72.
f
versus (u
a
-
u
w
) of Songsat specimen 3
y = 0,9535Ln(x) - 0,474
R
2
= 0,9964
0,0
1,0
2,0
3,0
4,0
5 10 15 20 25
Plasticity index, I
p
Fitting parameter,
Figure 3.73. The relationship
between the fitting parameter, , and
the plasticity index, I
p
.
clay
slight loam
loam
heavy loam
’ = 13
o
- 19 -
Experimental and calculated results for Yenbai soil samples are given in appendix III of the
thesis. From calculating results shown in figures from 3.74 to 3.79, it is seen that the
calculation of shear strength versus matric suction using our corrected coefficient will give
the relationship
f
~ (u
a
- u
w
) more adequate with test result.
3.6. CONCLUSION FOR CHAPTER 3.
(1) Test results to define the SWCC curve show that the more the high plasticity index I
p
of
soil, the more its great matric suction. The author proposes two formulas for the coefficients
m and n in the equation, so that to express more adequate some of experimented soils of
Vietnam. (2) When the state of test soil sample changes from saturate to unsaturated, its
matric suction increases, the internal friction angle ’quasi-unchanged while its cohesion
increases. The angle
b
= ’ when the matric suction is smaller than critical air-entry. The
angle
b
begins to be more reduced at matric suctions greater than critical air-entry. The
extended Mohr-Coulomb failure envelope surface for unsaturated soils is set up using the
add-on matric suction axe. (3) The results of experiment to define the shear strength using
compression triaxial and direct shear apparatus for the same soil type are not much different.
The determination of the corrected coefficient in the Fredlund and Vanapalli's equation
(1996) to bring into the calculated results best fitted with experiment.
CHAPTER 4
Application OF the RESEARCH resuLts FOR CALCULATING SOME OF
SLOPES IN VIETNAM
4.1. GENERAL INTRODUCTION OF STRUCTURE
4.1.1. Songsat reservoir
Songsat reservoir situates in the area of Phuocthang commune, Bacai district, Ninhthuan
province. The earth dam section is the 3 masses combined shape, with central impervious
core and cutoff dike placed at the central line of the dam.
0
100
200
300
0 100 200 300
Matric suction, (u
a
- u
w
) (kPa)
Shear strength,
f
(kPa)
Measured
Predicted (Fredlund and Vanapalli, 1996)
Predicted (Proposed Equation)
0
100
200
300
0 100 200 300
Matric suction, (u
a
- u
w
) (kPa)
Shear strength,
f
(kPa)
Measured
Predicted (Fredlund and Vanapalli, 1996)
Predicted (Proposed Equation)
0
100
200
300
0 100 200 300
Matric suction, (u
a
- u
w
) (kPa)
Shear strength,
f
(kPa)
Measured
Predicted (Fredlund and Vanapalli, 1996)
Predicted (Proposed Equation)
Figure 3.74.
f
versus (u
a
– u
w
) of Khecat specimen
from direct shear tests.
Figure 3.75.
f
versus (u
a
– u
w
) of Songsat specimen 2
from direct shear tests.
Figure 3.76.
f
versus (u
a
– u
w
) of Songsat specimen 3
from direct shear tests.
0
100
200
300
0 100 200 300
Matric suction, (u
a
- u
w
) (kPa)
Shear strength,
f
(kPa)
Measured
Predicted (Fredlund and Vanapalli, 1996)
Predicted (Proposed Equation)
0
100
200
300
0 100 200 300
Matric suction, (u
a
- u
w
) (kPa)
Shear strength,
f
(kPa)
Measured
Predicted (Fredlund and Vanapalli, 1996)
Predicted (Proposed Equation)
0
100
200
300
0 100 200 300
Matric suction, (u
a
- u
w
) (kPa)
Shear strength,
f
(kPa)
Measured
Predicted (Fredlund and Vanapalli, 1996)
Predicted (Proposed Equation)
Figure 3.77.
f
versus (u
a
– u
w
) of Khecat specimen
from CD tests.
Figure 3.78.
f
versus (u
a
– u
w
) of Songsat specimen 3
from CD tests.
Figure 3.79.
f
versus (u
a
– u
w
) of Songsat specimen 3
from CW tests.
- 20 -
4.1.2. Khecat
Khecat reservoir situates at the upstream of Khecat stream, Hailang commune, Tienyen
district, Quangninh province. It is a homogeneous earth dam.
4.1.3. Natural slope in Yenbai
This is the natural slope of a hillside situated along the national road of Yenbai province and
cut for building.
4.2. INTRODUCTION OF THE software
The SEEP/W, SLOPE/W in the GeoStudio 2004 is used to solve the main following
problems: seepage, slope stability. The couple of SLOPE/W and SEEP/W is used to consider
the influence of pore pressure to the safety factor of the slope
4.3. STABILITY ANALYSIS OF THE SONGSAT EARTH DAM SLOPE
4.3.1. Seepage analysis
The analysis result of the pore water pressure using SEEP/W (GEOSTUDIO 2004) is shown
in the figure 4.2. From this, it is seen
that the maximum value of negative
pore pressure in the area of dam core
is inferior -140 kPa, while in its
downstream incremental loading
area it is under -200 kPa.
4.3.2. Slope stability analysis
In order to study the influence of the
matric suction to the stability of the
embankment, the three following method is used:
* No consideration of
b
: this method is applied in case no consideration of the
influence of the unsaturated soil area above the saturation line.
* Assumption
b
= 1/2 ’: applied in case no having test practical material of
unsaturated soil.
* Total cohesion: in case to have enough test material parameters of unsaturated soil,
the total cohesion method will be applied in order to exactly analysis the actual working of
the earth dam.
4.3.2.1. Stability analysis according to no consideration of
b
method
The result of stability analysis for the downstream slope without consideration of
b
gives
the minimum factor of stability, F
s
, equal 1,195.
4.3.2.2.Stability analysis according to the assumption
b
= 1/2
’
The result of stability analysis for the downstream slope gives F
s
= 1,307.
4.3.2.3. Stability analysis
according to the total cohesion
method
In order to calculating in the
unsaturated area, the upstream,
the impermeable core, and the
downstream incremental loading
masses above the saturate line
are divided into thin layers
(figure 4.3).
The stability analysis results for
the downstream slope of the
earth dam using the total cohesion method gives the minimum stability factor according to
Fredlund and Vanapalli and mine are 1,412 and 1,478 respectively.
Upstream
Impervious
core
Downstream
Drainage
Toe drain
Bedrock
-
1
6
0
-
1
2
0
-
1
2
0
-
1
0
0
-
8
0
-
6
0
-40
-
2
0
0
0
2
0
1
0
0
20
0
2
8
0
Distance (m)
0 20 40 60 80 100 120 140 160 180 200
Elevation (m)
125
130
135
140
145
150
155
160
165
170
175
180
Figure 4.2. Pore pressure distribution lines in the
dam body and foundation (MC5A)
Impervious core
Downstream
Drainage
1
2
3
4
5
6
7
8
9
10
13
12
21
14
15
16
17
18
19
20
11
22
Figure 4.3. The stability analysis section according to
total cohesion method
- 21 -
4.4. STABILITY ANALYSIS OF THE KHECAT EARTH DAM SLOPE
4.4.1. Seepage analysis
The analysis result of
the pore water pressure
using SEEP/W
(GEOSTUDIO 2004)
is shown in the figure
4.5. From this, it is
seen that the value of
negative pore pressure
in the area above the saturation line is under -200 kPa.
4.4.2. Slope stability analysis
The slope stability analysis of Khecat earth dam is done by three methods: no consideration
of
b
; assumption
b
= 1/2 ’; total cohesion.
4.4.2.1. Slope stability analysis using no consideration of
b
method
The result of stability analysis of the downstream slope for the earth dam according to this
method gives the minimum stability factor, F
s
, equal 2,573.
4.4.2.2. Slope stability analysis using assumption
b
= 1/2 ’
The result of stability analysis of the downstream slope for the earth dam according to this
method gives the minimum stability factor, F
s
, equal 2,705.
4.4.2.3. Slope stability analysis using total cohesion method
Figure 4.6 is the cross section for
analyzing. The results of stability analysis
of the downstream slope for the earth dam
according to Fredlund and Vanapalli and
mine are 2,781 and 2,794 respectively.
4.5. NATURAL SLOPE STABILITY
ANALYSIS in Yenbai
4.5.1. Seepage analysis
The result of pore water pressure analysis
using SEEP/W (GEOSTUDIO 2004) is shown in the
figure 4.8. From this, it is seen that the negative pore
pressure value in the soil area above the saturation line
is inferior -180kPa. The saturation line is founded on
the measured data of actual underground level
4.5.2. Slope stability analysis
Slope stability analysis is done by three methods: no
consideration of
b
, assumption
b
= 1/2’ and total
cohesion methods.
4.5.2.1. Stability analysis using no consideration of
b
method
The result of slope stability analysis using this method
gives the slope minimum stability coefficient F
s
equal
1,018.
4.5.2.2. Stability analysis using assumption
b
= 1/2
’ method
The calculated result for slope stability gives the minimum stability coefficient F
s
equal
1,250.
Figure 4.5. The water pore pressure distribution line in the dam
body and its foundation (MC 0+200)
Figure 4.6. Cross section for analyzing
stability according to total cohesion method
Completely weathered
Residual soil
Bedrock
-160
-140
-120
-
9
0
-
7
0
-
6
0
-
4
0
-
2
0
0
Distance (m)
0 3 6 9 12 15 18 21 24 27 30
Elevation (m)
50
52
54
56
58
60
62
64
66
68
70
72
Figure 4.8. The pore water
pressure distribution lines in the
slope body and its foundation
- 22 -
4.5.2.3. Stability analysis using total cohesion
method
The calculated cross section is shown in the figure
4.9. The result of slope stability analysis using total
cohesion slope method gives the minimum stability
coefficient according to Fredlund and Vanapalli and
mine are 1,258 and 1,284 respectively.
4.6. Discussion of slope stability
analysis results
4.6.1. The slope stability analysis results of
Songsat dam
The factor of
safety of the earth
fill dam slope by
ignoring the
unsaturated soil state, assuming
b
=1/2’ and using total
cohesion method are shown in Figure 4.10. The factor of
safety is 1,307 when assuming
b
=1/2’ and increase to
9,37% compared with ignoring unsaturated soil properties
method (i.e., Fs=1,195). The factor of safety of slope gives
the biggest value by using total cohesion method (i.e.,
Fs=1,412) and increase to 18,16% compared with ignoring
unsaturated soil properties method. The factor of safety
obtained from slope stability analysis by using total
cohesion method with the
unsaturated soil properties
suggested by author increase about 4,67% compared with
the one calculated
following Fredlund and Vanapalli (i.e., F
s
=1,478).
4.6.2. The slope stability analysis results of Khecat
dam
Figure 4.11 show the factor of safety obtained from
Khecat dam slope stability analysis by three methods.
The factor of safety obtained when assuming
b
=1/2’
increase to 5,13% compared with ignoring unsaturated
soil properties method while the one given by using
total cohesion method increase to 8,08% (i.e.,
Fs=2,781).
The factor of safety obtained by using total cohesion
method with the
unsaturated soil properties
suggested
by author increase about 0,47% compared with the one
calculated following Fredlund and Vanapalli (i.e.,
F
s
=2,794).
4.6.3. The stability analysis results of natural slope
in Yenbai
The slope stability analysis results by three methods are shown in Figure 4.12. The factor of
safety obtained by assuming
b
=1/2’ method increase to 22,79% compared with ignoring
unsaturated soil properties method while the one given by using total cohesion method
increase to 23,58% (i.e., Fs=1,258).
2
1
3
4
5
6
7
8
9
10
11
12
13
14
Completely weathered
Residual soil
Bedrock
Distance (m)
0 3 6 9 12 15 18 21 24 27
Elevation (m)
50
52
54
56
58
60
62
64
66
68
70
72
Figure 4.9. Slope cross section for
stability analysis using total matric
suction method
1,15
1,21
1,27
1,33
1,39
1,45
1,51
1 2 3 3
Method
Fs
Figure 4.10
2,54
2,59
2,63
2,68
2,72
2,77
2,81
1 2 3 3
Method
Fs
Figure 4.11
Ignoring
b
b
=
2
1
’
Total
cohesion
by
F - V
Total
cohesion
by this
study
Ignoring
b
b
=
2
1
’
Total
cohesion
by
F - V
Total
cohesion
by this
study
- 23 -
The factor of safety obtained by using total cohesion
method with the
unsaturated soil properties
determined following author research increase to
2,07% compared with the one based on research of
Fredlund and Vanapalli (i.e., F
s
=1,284).
4.7. CONCLUSION OF CHAPTER 4
The slope stability analyses results illustrate the effect
of application of unsaturated soil properties in
calculation of slope stability. The shear strength of
unsaturated soil increase as increasing matric suction
making the factor of safety of the earth dam
increasing. The factor of safety obtained by using total
cohesion method with the unsaturated soil properties
calculated by using author experimental study results
increase to 4,67% for Songsat dam, 0,47% for Khecat
dam and 2,07% for natural slope in Yenbai compared
with the one calculated following research results of international scientists.
CONCLUSIONS AND future works
I. CONCLUSION
1.
This thesis has studied the theoretical basis about the saturated - unsaturated soil
environment and the characteristic parameters of unsaturated soil. Analyzing and
assessing the research and application situations of the characteristic parameters of
unsaturated soil in the world, make clear the necessary of the study to find out and
apply the unsaturated soil parameters in designing and constructing of structures in
Vietnam.
2.
The author has modified the normal triaxial apparatus at the Geotechnical Engineering
lab of Water Resources University. In accordance with Fredlund and Rahardjo's model
(1993) for researching. The part that was modified is the lower base of the triaxial cell
and the air conductor pipe system on the top of the sample. This contribution shows
that many labs in our country equipped with this type of apparatus can modify it in
order to define unsaturated soils properties for many different targets and purposes.
3.
The tests to find out unsaturated soil shear strength following different schema gave
the following results: when the soil sample turns from the saturated state to unsaturated
state, the matric suction inside it increases, the internal friction angle ’ is almost
unchanged, however, its cohesive increases. The angle
b
= ’ when the cohesive is
smaller than the limit input air pressure value. Angle
b
started to decrease
significantly at the cohesion values larger than the limit input air pressure value. The
extended Mohr-Coulomb failure envelope surface for unsaturated soil samples is
curved along the matric suction axis. The shear strength (’, c’ and
b
) of the same soil
obtained by different cutting method (direct shear test, consolidation drain triaxial test,
and shear with unchanged moisture content) gave approximately the same values, so
the author suggests that in case lacking of laboratory triaxial aparatus for unsaturated
soil, it is possible to use the direct shear one to find out the shear strength parameters
of unsaturated soil followed the procedure as announced in the thesis.
4.
Establish the curves that can be used to calculate SWCC parameters, permeability
coefficient and shear strength for some soil type in Vietnam to avoid using unsuitable
SWCC curves from other country. Establish a graph showing the relationship between
0,98
1,03
1,09
1,14
1,19
1,25
1,30
1 2 3 3
Method
Fs
8
Figure 4.12
Ignoring
b
b
=
2
1
’
Total
cohesion
by F - V
Total
cohesion
by this
study