nondestructive test methods for evaluation of concrete in structures
Bạn đang xem bản rút gọn của tài liệu. Xem và tải ngay bản đầy đủ của tài liệu tại đây (3.57 MB, 62 trang )
ACI 228.2R-98 became effective June 24, 1998.
Copyright 1998, American Concrete Institute.
All rights reserved including rights of reproduction and use in any form or by any
means, including the making of copies by any photo process, or by electronic or
mechanical device, printed, written, or oral, or recording for sound or visual reproduc-
tion or for use in any knowledge or retrieval system or device, unless permission in
writing is obtained from the copyright proprietors.
228.2R-1
ACI Committee Reports, Guides, Standard Practices, and
Commentaries are intended for guidance in planning, de-
signing, executing, and inspecting construction. This doc-
ument is intended for the use of individuals who are
competent to evaluate the significance and limitations
of its content and recommendations and who will ac-
cept responsibility for the application of the material it
contains. The American Concrete Institute disclaims any
and all responsibility for the stated principles. The Institute
shall not be liable for any loss or damage arising there-
from.
Reference to this document shall not be made in con-
tract documents. If items found in this document are de-
sired by the Architect/Engineer to be a part of the
contract documents, they shall be restated in mandatory
language for incorporation by the Architect/Engineer.
Nondestructive Test Methods for Evaluation of
Concrete in Structures
ACI 228.2R-98
Reported by ACI Committee 228
A. G. Davis
*†
Chairman
F. Ansari R. D. Gaynor
K. M. Lozen
*†
T. J. Rowe
H. Caratin F. D. Heidbrink V. M. Malhotra
B. P. Simons
*
N. J. Carino
‡
B. H. Hertlein
†
L. D. Olson
*
P. J. Sullivan
K. Choi K. R. Hindo S. P. Pessiki B. A. Suprenant
G. G. Clemeña
*
R. Huyke S. Popovics G. Teodoru
N. A. Cumming
*†
R. S. Jenkins
*
R. W. Poston
*
W. L. Vogt
R. L. Dilly M. E. Leeman
P. H. Read
*
A. B. Zoob
D. E. Dixon A. Leshchinsky
W. M. K. Roddis
*
B. Dragunsky H. S. Lew
M. J. Sansalone
*
* Task group members who contributed to preparation of report. Associate and Consulting Members
who contributed to the report include K. Maser, U. Halabe, J. Bungey. Former member R. W. Ross
also contributed to the early draft.
† Editorial task group.
‡ Chairman of report task group.
A review is presented of nondestructive test methods for evaluating the
condition of concrete and steel reinforcement in structures. The methods
discussed include visual inspection, stress-wave methods, nuclear meth-
ods, penetrability methods, magnetic and electrical methods, infrared ther-
mography and ground-penetrating radar. The principle of each method is
discussed and the typical instrumentation is described. The testing proce-
dures are summarized and the data analysis methods are explained. The
advantages and limitations of the methods are highlighted. The report con-
cludes with a discussion of the planning of a nondestructive testing pro-
gram. The report provides general information to individuals who are
faced with the task of evaluating the condition of a concrete structure and
are considering the applicability of nondestructive test methods to aid in
that evaluation.
Keywords: concrete; covermeter; deep foundations; half-cell potential;
infrared thermography; nondestructive testing; polarization resis-
tance; radar; radiography; radiometry; stress-wave methods; visual
inspection.
CONTENTS
Chapter 1—Introduction, p. 2
1.1—Scope
1.2—Needs and applications
1.3—Objective of report
Chapter 2—Summary of methods, p. 2
2.1—Visual inspection
2.2—Stress-wave methods for structures
2.3—Stress-wave methods for deep foundations
2.4—Nuclear methods
2.5—Magnetic and electrical methods
2.6—Penetrability methods
2.7—Infrared thermography
2.8—Radar
Chapter 3—Planning and performing
nondestructive testing investigations, p. 45
3.1—Selection of methods
3.2—Defining scope of investigation
228.2R-2 ACI COMMITTEE REPORT
3.3—Numerical and experimental simulations
3.4—Correlation with intrusive testing
3.5—Reporting results
Chapter 4—References, p. 56
4.1—Specified references
4.2—Cited references
Appendix A—Theoretical aspects of mobility plot
of pile, p. 61
CHAPTER 1—INTRODUCTION
1.1—Scope
Nondestructive test (NDT) methods are used to determine
hardened concrete properties and to evaluate the condition of
concrete in deep foundations, bridges, buildings, pavements,
dams and other concrete construction. For this report, nonde-
structive testing is defined as testing that causes no structur-
ally significant damage to concrete. While some people
regard coring and load testing as nondestructive, these are
not considered in this report, and appropriate information is
given in ACI 437R.
Nondestructive test methods are applied to concrete con-
struction for four primary reasons:
• quality control of new construction;
• troubleshooting of problems with new construction;
• condition evaluation of older concrete for rehabilitation
purposes; and
• quality assurance of concrete repairs.
Nondestructive testing technologies are evolving and re-
search continues to enhance existing methods and develop
new methods. The report is intended to provide an overview
of the principles of various NDT methods being used in prac-
tice, and to summarize their applications and limitations. The
emphasis is placed on methods that have been applied to
measure physical properties other than the strength of con-
crete in structures, to detect flaws or discontinuities, and to
provide data for condition evaluation. Methods to estimate
in-place compressive strength are presented in ACI 228.1R.
1.2—Needs and applications
Nondestructive test methods are increasingly applied for
the investigation of concrete structures. This increase in the
application of NDT methods is due to a number of factors:
• technological improvements in hardware and software
for data collection and analysis;
• the economic advantages in assessing large volumes of
concrete compared with coring;
• ability to perform rapid, comprehensive assessments of
existing construction; and
• specification of NDT methods for quality assurance of
deep foundations and concrete repairs.
This increased use of NDT methods is occurring despite
the lack of testing standards for many of the methods. The
development of testing standards is critical for proper appli-
cation and expanded use of NDT methods for evaluation of
concrete constructions.
Traditionally, quality assurance of concrete construction
has been performed largely by visual inspection of the con-
struction process and by sampling the concrete for perform-
ing standard tests on fresh and hardened specimens. This
approach does not provide data on the in-place properties of
concrete. NDT methods offer the advantage of providing in-
formation on the in-place properties of hardened concrete,
such as the elastic constants, density, resistivity, moisture
content, and penetrability characteristics.
Condition assessment of concrete for structural evaluation
purposes has been performed mostly by visual examination,
surface sounding,
*
and coring to examine internal concrete
conditions and obtain specimens for testing. This approach
limits what can be detected. Also, cores only provide infor-
mation at the core location and coreholes must be repaired.
Condition assessments can be made with NDT methods to
provide important information for the structural performance
of the concrete, such as:
• Member dimensions;
• Location of cracking, delamination, and debonding;
• Degree of consolidation, and presence of voids and
honeycomb;
• Steel reinforcement location and size;
• Corrosion activity of reinforcement; and
• Extent of damage from freezing and thawing, fire, or
chemical exposure.
1.3—Objective of report
This report reviews the state of the practice for nondestruc-
tively determining non-strength physical properties and con-
ditions of hardened concrete. The overall objective is to
provide the potential user with a guide to assist in planning,
conducting, and interpreting the results of nondestructive
tests of concrete construction.
Chapter 2 discusses the principles, equipment, testing pro-
cedures, and data analysis of the various NDT methods. Typ-
ical applications and inherent limitations of the methods are
discussed to assist the potential user in selecting the most ap-
propriate method for a particular situation. Chapter 3 dis-
cusses the planning and performance of NDT investigations.
Included in Chapter 3 are references to in-place tests covered
in ACI 228.1R and other applicable methods for evaluating
the in-place characteristics of concrete.
CHAPTER 2—SUMMARY OF METHODS
This chapter reviews the various NDT methods for evaluat-
ing concrete for characteristics other than strength. The under-
lying principles are discussed, the instrumentation is
described, and the inherent advantages and limitations of each
method are summarized. Where it is appropriate, examples of
test data are provided. Table 2.1 summarizes the methods to be
discussed. The first column lists the report section where the
method is described; the second column provides a brief expla-
nation of the underlying principles; and the third column gives
typical applications.
* Sounding refers to striking the surface of the object and listening to the character-
istics of the resulting sound.
228.2R-3NONDESTRUCTIVE TEST METHODS
Table 2.1—Summary of nondestructive testing methods
Most NDT methods are indirect tests because the condi-
tion of the concrete is inferred from the measured response
to some stimulus, such as impact or electromagnetic radia-
tion. For favorable combinations of test method and site
conditions, test results may be unambiguous and supplemen-
tal testing may be unnecessary. In other cases, the NDT re-
sults may be inconclusive and additional testing may be
needed. Supplemental testing can be another NDT method
or, often, it may be invasive methods to allow direct obser-
vation of the internal condition. Invasive inspection can
range from drilling small holes to removing test samples by
coring or sawing. The combination of nondestructive and in-
vasive inspection allows the reliability of the NDT method
to be assessed for the specific project. Once the reliability of
the NDT method is established, a thorough inspection of the
structure can be done economically.
2.1—Visual inspection
2.1.1
General
—Normally, a visual inspection is one of the
first steps in the evaluation of a concrete structure (Perenchio,
1989). Visual inspection can provide a qualified investigator
with a wealth of information that may lead to positive iden-
tification of the cause of observed distress. Broad knowledge
in structural engineering, concrete materials, and construc-
tion methods is needed to extract the most information from
the visual inspection. Useful guides are available to help
less-experienced individuals (ACI 201.1R, ACI 207.3R,
ACI 224.1R, ACI 362R). These documents provide informa-
tion for recognizing and classifying different types of dam-
age, and can help to identify the probable cause of the
distress.
Before doing a detailed visual inspection, the investigator
should develop and follow a definite plan to maximize the
228.2R-4 ACI COMMITTEE REPORT
quality of the recorded data. A suitable approach typically in-
volves the following activities:
• Cursory “walk-through” inspection to become familiar
with the structure;
• Gathering background documents and information on
the design, construction, ambient conditions, and opera-
tion of the structure;
• Planning the complete investigation;
• Laying out a control grid on the structure to serve as a
basis for recording observations;
• Doing the visual inspection; and
• Performing necessary supplemental tests.
Various ACI documents should be consulted for additional
guidance on planning and carrying out the complete investi-
gation (ACI 207.3R, ACI 224.1R, ACI 362R, ACI 437R).
2.1.2 Supplemental tools—Visual inspection is one of the
most versatile and powerful NDT methods. However, as
mentioned above, its effectiveness depends on the knowl-
edge and experience of the investigator. Visual inspection
has the obvious limitation that only visible surfaces can be
inspected. Internal defects go unnoticed and no quantitative
information is obtained about the properties of the concrete.
For these reasons, a visual inspection is usually supplement-
ed by one or more of the other NDT methods discussed in
this chapter. The inspector should consider other useful tools
that can enhance the power of a visual inspection.
Optical magnification allows a more detailed view of local
areas of distress. Available instruments range from simple
magnifying glasses to more expensive hand-held micro-
scopes. Some fundamental principles of optical magnifica-
tion can help in selecting the correct tool. The focal length
decreases with increasing magnifying power, which means
that the primary lens must be placed closer to the surface be-
ing inspected. The field of view also decreases with increas-
ing magnification, making it tedious to inspect a large area at
high magnification. The depth of field is the maximum dif-
ference in elevation of points on a rough textured surface that
Table 2.1—Continued
228.2R-5NONDESTRUCTIVE TEST METHODS
are simultaneously in focus; this also decreases with increas-
ing magnification of the instrument. To assure that the
“hills” and “valleys” are in focus simultaneously, the depth
of field has to be greater than the elevation differences in the
texture of the surface that is being viewed. Finally, the illu-
mination required to see clearly increases with the magnifi-
cation level, and artificial lighting may be needed at high
magnification.
A very useful tool for crack inspection is a small hand-
held magnifier with a built-in measuring scale on the lens
closest to the surface being viewed (ACI 224.1R). With such
a crack comparator, the width of surface cracks can be mea-
sured accurately.
A stereo microscope includes two viewing lenses that al-
low a three-dimensional view of the surface. By calibrating
the focus adjustment screw, the investigator can estimate the
elevation differences in surface features.
Fiberscopes and borescopes allow inspection of regions
that are otherwise inaccessible to the naked eye. A fiber-
scope is composed of a bundle of optical fibers and a lens
system; it allows viewing into cavities within a structure by
means of small access holes. The fiberscope is designed so
that some fibers transmit light to illuminate the cavity. The
operator can rotate the viewing head to allow a wide viewing
angle from a single access hole. A borescope is composed of
a rigid tube with mirrors and lenses and is designed to view
straight ahead or at right angles to the tube. The image is
clearer using a borescope, while the fiberscope offers more
flexibility in the field of view. Use of these scopes requires
drilling small holes if other access channels are absent, and
the holes must intercept the cavity to be inspected. Some
methods to be discussed in the remainder of the chapter may
be used to locate these cavities. Therefore, the fiberscope or
borescope may be used to verify the results of other NDT
methods without having to take cores.
A recent development that expands the flexibility of visual
inspection is the small digital video camera. These are used
in a similar manner to borescopes, but they offer the advan-
tage of a video output that can be displayed on a monitor or
stored on appropriate recording media. These cameras have
optical systems with a charge-coupled device (CCD), and
come in a variety of sizes, resolutions, and focal lengths.
Miniature versions as small as 12 mm in diameter, with a
resolution of 460 scan lines, are available. They can be in-
serted into holes drilled into the structure for views of inter-
nal cavities, or they can be mounted on robotic devices for
inspections in pipes or within areas exposed to biological
hazards.
In summary, visual inspection is a very powerful NDT
method. Its effectiveness, however, is to a large extent gov-
erned by the investigator’s experience and knowledge. A
broad knowledge of structural behavior, materials, and con-
struction methods is desirable. Visual inspection is typically
one aspect of the total evaluation plan, which will often be
supplemented by a series of other NDT methods or invasive
procedures.
2.2—Stress-wave methods for structures
Several test methods based on stress-wave propagation
can be used for nondestructive testing of concrete structures.
The ultrasonic
*
through-transmission method can be used for
locating abnormal regions in a member. The echo methods
can be used for thickness measurements and flaw detection.
The spectral analysis of surface waves (SASW) method can
be used to determine the thickness of pavements and elastic
moduli of layered pavement systems. The following sub-sec-
tions describe the principles and instrumentation for each
method. Section 2.3 discusses stress-wave methods for in-
tegrity testing of deep foundations. Additional information is
given in Sansalone and Carino (1991).
Stress waves occur when pressure or deformation is ap-
plied suddenly, such as by impact, to the surface of a solid.
The disturbance propagates through the solid in a manner
analogous to how sound travels through air. The speed of
stress-wave propagation in an elastic solid is a function of the
modulus of elasticity, Poisson’s ratio, the density, and the
geometry of the solid. This dependence between the proper-
ties of a solid and the resultant stress-wave propagation be-
havior permits inferences about the characteristics of the
solid by monitoring the propagation of stress waves.
When pressure is applied suddenly at a point on the sur-
face of a solid half-space, the disturbance propagates through
the solid as three different waves. The P-wave and S-wave
propagate into the solid along hemispherical wavefronts.
The P-wave, also called the dilatational or compression
wave, is associated with the propagation of normal stress and
particle motion is parallel to the propagation direction. The
S-wave, also called the shear or transverse wave, is associat-
ed with shear stress and particle motion is perpendicular to
the propagation direction. In addition, an R-wave travels
away from the disturbance along the surface. In an isotropic,
elastic solid, the P-wave speed C
p
is related to Young’s mod-
ulus of elasticity E; Poisson’s ratio ν; and the density ρ as
follows (Krautkrämer and Krautkrämer, 1990)
(2.1)
The S-wave propagates at a slower speed C
s
given by (Krau-
tkrämer and Krautkrämer, 1990)
(2.2)
where G = the shear modulus of elasticity.
A useful parameter is the ratio of S-wave speed to P-wave
speed
C
p
E 1 ν–()
ρ 1 ν+()12ν–()
=
C
s
G
ρ
=
* “Ultrasonic” refers to stress waves above the audible range, which is usually
assumed to be above a frequency of 20 kHz.
228.2R-6 ACI COMMITTEE REPORT
(2.3)
For a Poisson’s ratio of 0.2, which is typical of concrete, this
ratio equals 0.61. The ratio of the R-wave speed C
r
to the S-
wave speed may be approximated by the following formula
(Krautkrämer and Krautkrämer, 1990)
(2.4)
For a Poisson’s ratio between 0.15 and 0.25, the R-wave
travels from 90 to 92 percent of the S-wave speed.
Eq. (2.1) represents the P-wave speed in an infinite solid.
In the case of bounded solids, the wave speed is also affected
by the geometry of the solid. For wave propagation along the
axis of slender bar, the wave speed is independent of Pois-
son’s ratio and is given by the following
(2.5)
where C
b
is the bar wave speed. For a Poisson’s ratio be-
tween 0.15 and 0.25, the wave speed in a slender bar is from
3 to 9 percent slower than the P-wave speed in a large solid.
When a stress wave traveling through Material 1 is inci-
dent on the interface between a dissimilar Material 2, a por-
tion of the incident wave is reflected. The amplitude of the
reflected wave is a function of the angle of incidence and is
a maximum when this angle is 90 deg (normal incidence).
For normal incidence, the reflection coefficient R is given by
the following
(2.6)
where
R = ratio of sound pressure of the reflected wave to the
sound pressure of the incident wave,
Z
2
= specific acoustic impedance of Material 2, and
Z
1
= specific acoustic impedance of Material 1.
The specific acoustic impedance is the product of the
wave speed and density of the material. The following are
approximate Z-values for some materials (Sansalone and
Carino, 1991)
Material Specific acoustic impedance, kg/(m
2
s)
Air 0.4
Water
1.5
×
10
6
Soil
0.3 to 4
×
10
6
Concrete
7 to 10
×
10
6
Limestone
7 to 19
×
10
6
Granite
15 to 17
×
10
6
Steel
47
×
10
6
C
s
C
p
12
ν
–
21
ν
–
()
=
C
r
C
s
0.87 1.12
ν
+
1
ν
+
=
C
b
E
ρ
=
R
Z
2
Z
1
–
Z
2
Z
1
+
=
Thus, for a stress wave that encounters an air interface as
it travels through concrete, the absolute value of the reflec-
tion coefficient is nearly 1.0 and there is almost total reflec-
tion at the interface. This is why NDT methods based on
stress-wave propagation have proven to be successful for lo-
cating defects within concrete.
2.2.1 Ultrasonic through transmission method—One of
the oldest NDT methods for concrete is based on measuring
the travel time over a known path length of a pulse of ultra-
sonic compressional waves. The technique is known as ultra-
sonic through transmission, or, more commonly, the
ultrasonic pulse velocity method. Naik and Malhotra (1991)
provide a summary of this test method, and Tomsett (1980)
reviewed the various applications of the technique.
The development of field instruments to measure the pulse
velocity occurred nearly simultaneously in the late 1940s in
Canada and England (Whitehurst, 1967). In Canada, there
was a desire for an instrument to measure the extent of crack-
ing in dams (Leslie and Cheesman, 1949). In England, the
emphasis was on the development of an instrument to assess
the quality of concrete pavements (Jones, 1949).
Principle—As mentioned above, the speed of propagation
of stress waves depends on the density and the elastic con-
stants of the solid. In a concrete member, variations in den-
sity can arise from nonuniform consolidation, and variations
in elastic properties can occur due to variations in materials,
mix proportions, or curing. Thus, by determining the wave
speed at different locations in a structure, it is possible to
make inferences about the uniformity of the concrete. The
compressional wave speed is determined by measuring the
travel time of the stress pulse over a known distance.
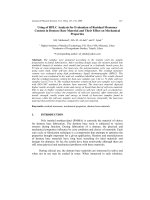
The testing principle is illustrated in Fig. 2.2.1(a),
*
which
depicts the paths of ultrasonic pulses as they travel from one
side of a concrete member to the other side. The top case rep-
resents the shortest direct path through sound concrete, and
it would result in the shortest travel time, or the fastest appar-
ent wave speed. The second case from the top represents a
path that passes through a portion of inferior concrete, and
the third case shows a diffracted path around the edge of a
large void (or crack). In these latter cases, the travel time
would be greater than the first case. The last case indicates a
travel path that is interrupted by a void. This air interface re-
sults in total reflection of the stress waves and there would be
no arrival at the opposite side. The apparent wave speeds
would be determined by dividing the member thickness by
the measured travel time. A comparison of the wave speeds
at the different test points would indicate the areas of anom-
alies within the member. It may also be possible to use signal
attenuation as an indicator of relative quality of concrete, but
this requires special care to ensure consistent coupling of the
transducers at all test points (Teodoru, 1994).
Apparatus for through-transmission measurements has
also been used on the same surface as shown in Fig. 2.2.2(a).
* The first two numbers of a figure or table represent the chapter and section in
which the figure or table is first mentioned.
228.2R-7NONDESTRUCTIVE TEST METHODS
This approach has been suggested for measuring the depth of
a fire-damaged surface layer having a lower wave speed than
the underlying sound concrete (Chung and Law, 1985) and
for measuring the depth of concrete damaged by freezing
(Teodoru and Herf, 1996). The test is carried out by measur-
ing the travel time as a function of the separation X between
transmitter and receiver. The method assumes that stress-
wave arrival at the receiver occurs along two paths: Path 1,
which is directly through the damaged concrete, and Path 2,
which is through the damaged and the sound concrete. For
small separation, the travel time is shorter for Path 1, and for
large separation the travel time is shorter for Path 2. By plot-
ting the travel time as a function of the distance X, the pres-
ence of a damaged surface layer is indicated by a change in
the slope of the data. The distance X
o
, at which the travel
times for the two paths are equal, is found from the intersec-
tion of the straight lines as shown in Fig. 2.2.2(b). The slopes
of the two lines are reciprocals of the wave speeds in the
damaged and sound concrete. The depth of the damaged lay-
er is found from the following (Chung and Law, 1985)
(2.7)
The surface method relies on measuring the arrival time
of low amplitude waves, and the user should understand the
capabilities of the instrument to measure the correct arrival
times. The user should also be familiar with the underlying
theory of seismic refraction (Richart et al., 1970) that forms
the basis of Eq. (2.7). The method is only applicable if the
upper layer has a slower wave speed than the lower layer.
Instrumentation—The main components of modern de-
vices for measuring the ultrasonic pulse velocity are shown
schematically in Fig. 2.2.1(b). A transmitting transducer is
positioned on one face of the member and a receiving trans-
ducer is positioned on the opposite face. The transducers
contain piezoelectric ceramic elements. Piezoelectric mate-
rials change dimension when a voltage is applied to them, or
they produce a voltage change when they are deformed. A
d
X
o
2
V
s
V
d
–
V
s
V
d
+
=
pulser is used to apply a high voltage to the transmitting
transducer (source), and the suddenly applied voltage causes
the transducer to vibrate at its natural frequency. The vibra-
tion of the transmitter produces the stress pulse that propa-
gates into the member. At the same time that the voltage
pulse is generated, a very accurate electronic timer is turned
on. When the pulse arrives at the receiver, the vibration is
changed to a voltage signal that turns off the timer, and a dis-
play of the travel time is presented. The requirements for a
suitable pulse-velocity device are given in ASTM C 597.
The transducers are coupled to the test surfaces using a
viscous material, such as grease, or a non-staining ultrasonic
Fig. 2.2.1—(a) Effects of defects on travel time of ultrasonic pulse; and (b) schematic of
through-transmission test system.
Fig. 2.2.2—(a) Wave paths for ultrasonic testing on surface
of concrete having damaged surface layer; and (b) travel
time as a function of distance between transmitter and
receiver.
228.2R-8 ACI COMMITTEE REPORT
gel couplant if staining of the concrete is a problem. Trans-
ducers of various resonant frequencies have been used, with
50-kHz transducers being the most common. Generally, low-
er-frequency transducers are used for mass concrete (20 kHz)
and higher-frequency transducers (> 100 kHz) are used for
thinner members where accurate travel times have to be mea-
sured. In most applications, 50-kHz transducers are suitable.
2.2.2 Ultrasonic-echo method—Some of the drawbacks of
the through-transmission method are the need for access to
both sides of the member and the lack of information on the
location (depth) of a detected anomaly. These limitations can
be overcome by using the echo methods, in which the testing
is performed on one face of the member and the arrival time
of a stress wave reflected from a defect is determined. This
approach has been developed for testing metals, and it is
known as the pulse-echo method. Since the 1960s, a number
of different experimental ultrasonic-echo systems have been
developed for concrete (Bradfield and Gatfield, 1964;
Howkins, 1968). Successful applications have been limited
mainly to measuring the thickness of and detecting flaws in
thin slabs, pavements, and walls (Mailer, 1972; Alexander
and Thornton, 1989).
Principle—In the pulse-echo method, a stress pulse is in-
troduced into an object at an accessible surface by a transmit-
ter. The pulse propagates into the test object and is reflected
by flaws or interfaces. The surface response caused by the ar-
rival of reflected waves, or echoes, is monitored by the same
transducer acting as a receiver. This technique is illustrated
in Fig. 2.2.3(a). Due to technical problems in developing a
suitable pulse-echo transducer for testing concrete, success-
ful ultrasonic-echo methods have, in the past, used a separate
receiving transducer located close to the transmitting trans-
ducer. Such a system is known as pitch-catch, and is illustrat-
ed in Fig. 2.2.3(b). The receiver output is displayed on an
oscilloscope as a time-domain waveform. The round-trip
travel time of the pulse can be obtained from the waveform
by determining the time from the start of the transmitted
pulse to the reception of the echo. If the wave speed in the
material is known, this travel time can be used to determine
the depth of the reflecting interface.
Instrumentation—The key components of an ultrasonic-
echo test system are the transmitting and receiving transduc-
er(s), a pulser, and an oscilloscope. Transducers that transmit
and receive short-duration, low-frequency
*
(≈ 200 kHz), fo-
cused waves are needed for testing concrete. However, it is
difficult to construct such transducers, and often their dimen-
sions become very large, making the transducers cumber-
some and difficult to couple to the surface of the concrete
(Mailer, 1972). Recent advances have resulted in improved
transducers (Alexander and Thornton, 1989), but their pene-
tration depths are limited to about 250 mm.
A true pulse-echo system (source and receiver are one
transducer) has been developed and applied to concrete with
small-sized aggregate (Hillger, 1993). This system uses a
heavily damped 500-kHz transducer as both the source and
receiver. A micro-computer is used to process the data and
display the results using conventional techniques, as in ultra-
sonic testing of metals. One of these display methods is the
B-scan, in which successive time-domain traces, obtained as
the transducer is scanned over the test object, are oriented
vertically and placed next to each other. The resulting plot is
a cross-sectional view of the object showing the location of
reflecting interfaces along the scan line. Fig. 2.2.4(a) shows
a concrete specimen made with 8-mm aggregate and con-
taining an artificial defect at a depth of 65 mm. Fig. 2.2.4(b)
shows the B-scan produced as the transducer was moved
across the surface of the specimen (Hillger, 1993). The use
of very high frequencies with the pulse-echo method may be
beneficial in terms of improved defect resolution. However,
the penetration depth is limited, and the performance in con-
crete with larger aggregates is not known. At this time, not
much field experience has been accumulated with the ultra-
sonic pulse-echo method for concrete.
2.2.3 Impact-echo method—Using an impact to generate a
stress pulse is an old idea that has the advantage of eliminat-
ing the need for a bulky transmitting transducer and provid-
ing a stress pulse with greater penetration ability. However,
the stress pulse generated by impact at a point is not focused
like a pulse from an ultrasonic transducer. Instead, waves
propagate into a test object in all directions, and reflections
may arrive from many directions. Since the early 1970s, im-
pact methods, usually referred to as seismic-echo (or sonic-
echo) methods, have been widely used for evaluation of con-
crete piles and drilled shaft foundations (Steinbach and Vey,
1975). These foundation NDT methods are discussed in Sec-
tion 2.3.1. Beginning in the mid-1980s, the impact-echo
technique was developed for testing of concrete structural
members (Sansalone and Carino, 1986; Sansalone, 1997).
Applications of the impact-echo technique include: deter-
mining the thickness of and detecting flaws in plate-like
structural members, such as slabs and bridge decks with or
Fig. 2.2.3—Schematic of ultrasonic pulse-echo and pitch-
catch methods.
* A frequency of 200 kHz is considered low compared to higher frequencies used
in pulse-echo systems for testing metals, where frequencies in excess of 1 MHz are
common.
228.2R-9NONDESTRUCTIVE TEST METHODS
without overlays; detecting flaws in beams, columns and
hollow cylindrical structural members; assessing the quality
of bond in overlays; and crack-depth measurement (Sansa-
lone and Streett, 1997; Sansalone and Carino, 1988, 1989a,
1989b; Lin [Y.] and Sansalone, 1992a, 1992b, 1992c; Cheng
and Sansalone, 1993; Lin [J. M.] and Sansalone, 1993,
1994a, 1994b, 1996; Lin and Su, 1996).
Principle—The principle of the impact-echo technique is
illustrated in Fig. 2.2.5(a). A transient stress pulse is intro-
duced into a test object by mechanical impact on the surface.
The P- and S-waves produced by the stress pulse propagate
into the object along hemispherical wavefronts. In addition,
a surface wave travels along the surface away from the im-
pact point. The waves are reflected by internal interfaces or
external boundaries. The arrival of these reflected waves, or
echoes, at the surface where the impact was generated pro-
duces displacements that are measured by a receiving trans-
ducer and recorded using a data-acquisition system.
Interpretation of waveforms in the time domain has been
successful in seismic-echo applications involving long slen-
der structural members, such as piles and drilled shafts
(Steinbach and Vey, 1975; Olson and Wright, 1990). In such
cases, there is sufficient time between the generation of the
stress pulse and the reception of the wave reflected from the
bottom surface, or from an inclusion or other flaw, so that
the arrival time of the reflected wave is generally easy to de-
termine even if long-duration impacts produced by hammers
are used.
For relatively thin structural members such as slabs and
walls, time-domain analysis is feasible if short-duration im-
pacts are used, but it is time-consuming and can be difficult
depending on the geometry of the structure (Sansalone and
Carino, 1986). The preferred approach, which is much
quicker and simpler, is frequency analysis of displacement
waveforms (Carino et al., 1986). The underlying principle of
frequency analysis is that the stress pulse generated by the
impact undergoes multiple reflections between the test sur-
face and the reflecting interface (flaw or boundaries). The
frequency of arrival of the reflected pulse at the receiver de-
pends on the wave speed and the distance between the test
surface and the reflecting interface. For the case of reflec-
tions in a plate-like structure, this frequency is called the
thickness frequency, and it varies as the inverse of the mem-
ber thickness.
In frequency analysis, the time-domain signal is trans-
formed into the frequency domain using the fast Fourier
transform technique. The result is an amplitude spectrum
that indicates the amplitude of the various frequency compo-
nents in the waveforms. The frequency corresponding to the
arrival of the multiple reflections of the initial stress pulse,
that is, the thickness frequency, is indicated by a peak in the
amplitude spectrum. For a plate-like structure, the approxi-
mate
*
relationship between the distance D to the reflecting
interface, the P-wave speed C
p
and the thickness frequency f
is as follows
(2.8)
As an example, Fig. 2.2.5(b) shows the amplitude spectrum
obtained from an impact-echo test of a 0.5-m-thick concrete
slab. The peak at 3.42 kHz corresponds to the thickness fre-
quency of the solid slab, and a velocity of 3,420 m/s is calcu-
lated. Fig. 2.2.5(c) shows the amplitude spectrum for a test
over a void within the same slab. The peak has shifted to a fre-
quency of 7.32 kHz, indicating that the reflections are occur-
ring from an interface within the slab. The ratio 3.42 kHz/
7.32 kHz = 0.46 indicates that the interface is at approximate-
ly the middle of the slab with a calculated depth of 0.23 m.
In using the impact-echo method to determine the loca-
tions of flaws within a slab or other plate-like structure, tests
can be performed at regularly spaced points along lines
marked on the surface. Spectra obtained from such a series
of tests can be analyzed with the aid of computer software
that can identify those test points corresponding to the pres-
ence of flaws and can plot a cross-sectional view along the
test line (Pratt and Sansalone, 1992).
Frequency analysis of signals obtained from impact-echo
tests on bar-like structural elements, such as reinforced con-
crete beams and columns, bridge piers, and similar members,
is more complicated than the case of slab-like structural
members. The presence of the side boundaries gives rise to
transverse modes of vibration of the cross section. Thus, pri-
or to attempting to interpret test results, the characteristic fre-
quencies associated with the transverse modes of vibration
of a solid structural member have to be determined. These
frequencies depend upon the shape and dimensions of the
cross section. It has been shown that the presence of a flaw
disrupts these modes, making it possible to determine that a
flaw exists (Lin and Sansalone, 1992a, 1992b, 1992c).
D
C
p
2f
=
Fig. 2.2.4—Example of ultrasonic pulse-echo test on con-
crete: (a) test specimen with artificial defect; and (b) B-scan
showing location of defect (adapted from Hillger, 1993).
* For accurate assessment of plate thickness, the P-wave speed in Eq. (2.8) should
be multiplied by 0.96 (Sansalone and Streett 1997).
228.2R-10 ACI COMMITTEE REPORT
Instrumentation—An impact-echo test system is com-
posed of three components: an impact source; a receiving
transducer; and a data-acquisition system that is used to cap-
ture the output of the transducer, store the digitized wave-
forms, and perform signal analysis. A suitable impact-echo
test system can be assembled from off-the-shelf components.
In 1991, a complete field system (hardware and analysis soft-
ware) became commercially available.
The selection of the impact source is a critical aspect of a
successful impact-echo test system. The impact duration de-
termines the frequency content of the stress pulse generated
by the impact, and determines the minimum flaw depth that
can be determined. As the impact duration is shortened, high-
er-frequency components are generated. In evaluation of
piles, hammers are used that produce energetic impacts with
long contact times (greater than 1 ms) suitable for testing
long, slender structural members. Impact sources with short-
er-duration impacts (20 to 80 µs), such as spring-loaded
spherically-tipped impactors, have been used for detecting
flaws within structural members less than 1 m thick.
In evaluation of piles, geophones (velocity transducers) or
accelerometers have been used as the receiving transducer.
For impact-echo testing of slabs, walls, beams, and columns,
a broad-band, conically-tipped, piezoelectric transducer
(Proctor, 1982) that responds to surface displacement has
been used as the receiver (Sansalone and Carino, 1986).
Small accelerometers have also been used as the receiver. In
this case, additional signal processing is carried out in the
frequency domain to obtain the appropriate amplitude spec-
trum (Olson and Wright, 1990). Such accelerometers must
have resonant frequencies well above the anticipated thick-
ness frequencies to be measured.
2.2.4 Spectral analysis of surface waves (SASW) meth-
od—In the late 1950s and early 1960s, Jones reported on the
use of surface waves to determine the thickness and elastic
stiffness of pavement slabs and of the underlying layers
(Jones, 1955; Jones, 1962). The method involved determining
the relationship between the wavelength and velocity of sur-
face vibrations as the vibration frequency was varied. Apart
from the studies reported by Jones and work in France during
the 1960s and 1970s, there seems to have been little addition-
al use of this technique for testing concrete pavements. In the
early 1980s, however, researchers at the University of Texas
at Austin began studies of a surface wave technique that in-
volved an impactor or vibrator that excited a range of fre-
quencies. Digital signal processing was used to develop the
relationship between wavelength and velocity. The tech-
nique was called spectral analysis of surface waves (SASW)
(Heisey et al., 1982; Nazarian et al., 1983). The SASW
method has been used successfully to determine the stiffness
Fig. 2.2.5—(a) Schematic of impact-echo method; (b) amplitude spectrum for test of solid
slab; and (c) amplitude spectrum for test over void in slab.
228.2R-11NONDESTRUCTIVE TEST METHODS
profiles of soil sites, asphalt and concrete pavement systems,
and concrete structural members. The method has been ex-
tended to the measurement of changes in the elastic proper-
ties of concrete slabs during curing, the detection of voids,
and assessment of damage (Bay and Stokoe, 1990; Kalinski
et al., 1994).
Principle—The general test configuration is illustrated in
Fig. 2.2.6 (Nazarian and Stokoe, 1986a). An impact is used
to generate a surface or R-wave. Two receivers are used to
monitor the motion as the R-wave propagates along the sur-
face. The received signals are processed and a subsequent
calculation scheme is used to infer the stiffnesses of the un-
derlying layers.
Just as the stress pulse from impact contains a range of fre-
quency components, the R-wave also contains a range of
components of different frequencies or wavelengths. (The
product of frequency and wavelength equals wave speed.)
This range depends on the contact time of the impact; a
shorter contact time results in a broader range. The longer-
wavelength (lower-frequency) components penetrate more
deeply, and this is the key to using the R-wave to gain infor-
mation about the properties of the underlying layers (Rix and
Stokoe, 1989). In a layered system, the propagation speed of
these different components is affected by the wave speed in
those layers through which the components propagate. A
layered system is a dispersive medium for R-waves, which
means that different frequency components of the R-wave
propagate with different speeds, which are called phase ve-
locities.
Phase velocities are calculated by determining the time it
takes for each frequency (or wavelength) component to trav-
el between the two receivers. These travel times are deter-
mined from the phase difference of the frequency
components arriving at the receivers (Nazarian and Stokoe,
1986b). The phase differences are obtained by computing
the cross-power spectrum of the signals recorded by the two
receivers. The phase portion of the cross-power spectrum
gives phase differences (in degrees) as a function of frequen-
cy. The phase velocities are determined as follows
(2.9)
where
C
R(f)
= surface wave speed of component with frequency
f,
X = distance between receivers (see Fig. 2.2.6), and
φ
f
= phase angle of component with frequency f.
The wavelength λ
f
, corresponding to a component fre-
quency, is calculated using the following equation
(2.10)
By repeating the calculations in Eq. (2.9) and (2.10) for
each component frequency, a plot of phase velocity versus
C
Rf
()
X
360
φ
f
f
=
λ
f
X
360
φ
f
=
wavelength is obtained. Such a plot is called a dispersion
curve. Fig. 2.2.7(a) shows an example of a dispersion curve
obtained by Nazarian and Stokoe (1986a) from tests on a
concrete pavement. The short-wavelength components have
higher speeds because they correspond to components trav-
eling through the concrete slab.
A process called inversion
*
is used to obtain the approxi-
mate stiffness profile at the test site from the experimental
dispersion curve (Nazarian and Stokoe, 1986b; Nazarian and
Desai, 1993; Yuan and Nazarian, 1993). The test site is mod-
eled as layers of varying thickness. Each layer is assigned a
density and elastic constants. Using this information, the so-
lution for surface wave propagation in a layered system is
obtained and a theoretical dispersion curve is calculated for
the assumed layered system. The theoretical curve is com-
pared with the experimental dispersion curve. If the curves
match, the problem is solved and the assumed stiffness pro-
file is correct. If there are significant discrepancies, the as-
sumed layered system is changed or refined and a new
theoretical curve is calculated. This process continues until
there is good agreement between the theoretical and experi-
mental curves.
Instrumentation—There are three components to a SASW
test system: the energy source is usually a hammer but may be
a vibrator with variable frequency excitation; two receivers
that are geophones (velocity transducers) or accelerometers;
and a two-channel spectral analyzer for recording and pro-
cessing the waveforms.
The required characteristics of the impact source depend
on the stiffnesses of the layers, the distances between the two
receivers, and the depth to be investigated (Nazarian et al.,
1983). When investigating concrete pavements and structur-
al members, the receivers are located relatively close togeth-
er. In this case, a small hammer (or even smaller impactor/
vibrator) is required so that a short-duration pulse is pro-
duced with sufficient energy at frequencies up to about 50 to
100 kHz. As the depth to be investigated increases, the dis-
tance between receivers is increased, and an impact that
Fig. 2.2.6—Schematic of spectral analysis of surface wave
(SASW) method.
* Although it is called “inversion,” the technique actually uses forward modeling,
with trial and error, until there is agreement between the measured and computed dis-
persion curves.
228.2R-12 ACI COMMITTEE REPORT
generates a pulse with greater energy at lower frequencies is
required. Thus, heavier hammers, such as a sledge hammer,
are used.
The two receiving transducers measure vertical surface ve-
locity or acceleration. The selection of transducer type de-
pends, in part, on the test site (Nazarian and Stokoe, 1986a).
For tests where deep layers are to be investigated and larger
receiver spacings are required, geophones are generally used
because of their superior low-frequency sensitivity. For tests
of concrete pavements, the receivers must provide accurate
measurements at higher frequencies. Thus, for pavements, a
combination of geophones and accelerometers is often used.
For concrete structural members, small accelerometers and
small impactors or high-frequency vibrators are typically
used (Bay and Stokoe, 1990).
The receivers are first located close together, and the spac-
ing is increased by a factor of two for subsequent tests. As a
check on the measured phase information for each receiver
spacing, a second series of tests is carried out by reversing
the position of the source. Typically, five receiver spacings
are used at each test site. For tests of concrete pavements, the
closest spacing is usually about 0.15 m (Nazarian and Stokoe
1986b).
2.2.5 Advantages and limitations—Each of the stress-
wave propagation methods have distinct advantages and lim-
itations, as summarized in Table 2.2. The ultrasonic pulse ve-
locity method is the only technique that has been
standardized by ASTM,
*
and a variety of commercial devic-
es are available. The various echo-methods are not standard-
ized, have relatively little research and field experiences, and
commercial test systems are just beginning to be available.
The SASW method suffers from the complexity of the signal
processing, but efforts were begun to automate this signal
processing (Nazarian and Desai, 1993).
2.3—Stress-wave methods for deep foundations
Since the 1960s, test methods based on stress-wave prop-
agation have been commercially available for the nonde-
structive testing of concrete deep foundations and mass
concrete. First developed in France and Holland, they are
now routinely specified as quality control tools for new pile
construction in western Europe, northern Africa, and parts of
eastern Asia. Their present use on the North American con-
tinent is less widespread. Recent improvements in electronic
hardware and portable computers have resulted in more reli-
able and faster testing systems that are less subject to operator
influence both in testing procedure and in the analysis of test
results.
Two distinct groupings of stress-wave methods for deep
foundations are apparent:
• Reflection techniques, and
• Direct transmission through the concrete.
2.3.1 Sonic-echo method—This method is the earliest of
all NDT methods to become commercially available
(Paquet, 1968; Steinbach and Vey, 1975; Van Koten and
Middendorp, 1981) for deep-foundation integrity or length
evaluation. This method is known variously as the seismic-
echo, sonic-echo, or PIT (Pile Integrity Test) (Rausche and
Seitz, 1983).
Principle—The sonic-echo method uses a small impact de-
livered at the head of the deep foundation (pile or shaft), and
measures the time taken for the stress wave generated by the
impact to travel down the pile and to be reflected back to a
transducer (usually an accelerometer) coupled to the pile
head. The impact is typically from a small sledgehammer
(hand sledge) with an electronic trigger. The time of impact
* In 1998, a standard on using the impact-echo method to measure thickness of con-
crete members was approved by ASTM with the designation C 1383.
Fig. 2.2.7—(a) Dispersion curve obtained from SASW testing of concrete pavement; (b) S-
wave speed obtained from inversion of experimental dispersion curve; and (c) soil profile
based on boring (adapted from Nazarian and Stokoe, 1986a).
228.2R-13NONDESTRUCTIVE TEST METHODS
and the pile head vertical movement after impact are record-
ed either by an oscilloscope or by a digital data acquisition
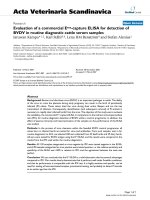
device that records the data on a time base. Fig. 2.3.1 illus-
trates the results of a sonic-echo test on a concrete shaft.
If the length of the pile shaft is known and the transmis-
sion time for the stress wave to return to the transducer is
measured, then its velocity can be calculated. Conversely, if
the velocity is known, then the length can be deduced. Since
the velocity of the stress wave is primarily a function of the
dynamic elastic modulus and density of the concrete, the cal-
culated velocity can provide information on concrete quali-
ty. Where the stress wave has traveled the full length of the
shaft, these calculations are based on the formula
(2.11)
where
C
b
= bar wave speed in concrete
L = shaft length
∆t = transit time of stress wave
Empirical data have shown that a typical range of values
for C
b
can be assumed, where 3800 to 4000 m/s would indi-
cate good-quality concrete, with a compressive strength on
the order of 30 to 35 MPa (Stain, 1982). The actual strength
will vary according to aggregate type and mixture
propor-
tions, and these figures should be used only as a broad guide
to concrete quality.
Where the length of the shaft is known, an early arrival of
the reflected wave means that it has encountered a reflector
(change in stiffness or density) other than the toe of the shaft.
This may be a break or defect in the shaft, a significant
change in shaft cross section, or the point at which the shaft
is restrained by a stiffer soil layer. In certain cases, the polar-
ity of the reflected wave (whether positive or negative with
respect to the initial impact) can indicate whether the appar-
ent defect is from an increase or decrease of stiffness at the
reflective point.
The energy imparted to the shaft by the impact is small,
and the damping effect of the soils around the shaft will
C
b
2L
∆t
=
progressively dissipate that energy as the stress wave travels
down and up the shaft. To increase information from the test,
the signal response can be progressively amplified with time.
Depending on the stiffness of the lateral soils, a limiting
length-to-diameter ratio (L/d) exists beyond which all the
wave energy is dissipated and no response is detected at the
shaft head. In this situation, the only information that can be
derived is that there are no significant defects in the upper
portion of the shaft, since any defect closer to the head than
the critical L/d ratio would reflect part of the wave. This lim-
iting L/d ratio will vary according to the adjacent soils, with
a typical value of 30 for medium stiff clays.
2.3.2 Impulse-response (mobility) method—This method
was originally developed as a steady state vibration test in
France (Davis and Dunn, 1974), where a controlled force
was applied to the pile shaft head by a swept-frequency gen-
erator. The vertical shaft response was recorded by geophone
velocity transducers, and the input force from the vibrator
was continuously monitored. The resulting response curve
plotted the shaft mobility (geophone particle velocity/vibra-
tor force v/F) against frequency, usually in the useful fre-
quency range of 0 to 2000 Hz.
Table 2.2—Advantages and limitations of stress-wave methods for
structures
Fig. 2.3.1—Example of sonic-echo test result (signal is
amplified by function at bottom of graph).
228.2R-14 ACI COMMITTEE REPORT
The evolution of data-processing equipment during the
1980s and 1990s allowed the use of computers on site to
transform the shaft response due to a hammer impact (simi-
lar to that used in the sonic-echo method) into the frequency
domain (Stain, 1982; Olson et al., 1990). This reduced the
effort to obtain the mobility as a function of frequency. Oth-
er studies demonstrated that the impulse-response method
could be applied to integrity testing of other structures be-
sides deep foundations (Davis and Hertlein, 1990).
Principle—A blow on the shaft head by a small sledge-
hammer equipped with a load cell generates a stress wave
with a wide frequency content, which can vary from 0 to
1000 Hz for soft rubber-tipped hammers to 0 to 3000 Hz for
metal-tipped hammers. The load cell measures the force in-
put, and the vertical response of the shaft head is monitored
by a geophone.
The force and velocity time-base signals are recorded by
a digital acquisition device, and then processed by computer
using the fast Fourier transform (FFT) algorithm to convert
the data to the frequency domain. Velocity is then divided by
force to provide the unit response, or transfer function,
which is displayed as a graph of shaft mobility versus fre-
quency.
An example of a mobility plot for a pile shaft is given in
Fig. 2.3.2. This response curve consists of two major por-
tions, which contain the following information:
• At low frequencies (< 100 Hz), lack of inertial effects
cause the pile/soil composite to behave as a spring, and
this is shown as a linear increase in amplitude from
zero with increasing frequency. The slope of this por-
tion of the graph is known as the compliance or flexi-
bility, and the inverse of flexibility is the dynamic
stiffness. The dynamic stiffness is a property of the
shaft/soil composite, and can therefore be used to
assess shafts on a comparative basis, either to establish
uniformity, or as an aid to selecting a representative
shaft for full-scale load testing by either static or
dynamic means.
• The higher-frequency portion of the mobility curve
represents longitudinal resonance of the shaft. The fre-
quencies of these resonances are a function of the shaft
length and the degree of shaft toe anchorage, and their
relative amplitude is a function of the lateral soil damp-
ing. The frequency difference between adjacent peaks
is constant and is related to the length of the shaft and
the wave speed of the concrete according to Eq. (A.1)
in Appendix A. The mean amplitude of this resonating
portion of the curve is a function of the impedance of
the pile shaft, which depends, in turn, upon the shaft
cross-sectional area, the concrete density, and the bar
wave propagation velocity C
b
(see Appendix A).
As with the sonic-echo test, when the shaft length is
known, a shorter apparent length measurement will indicate
the presence of an anomaly. Appendix A describes how ad-
ditional information can be derived from the mobility-fre-
quency plot, such as the pile cross section and dynamic
stiffness, which can help in differentiating between an in-
crease or a reduction in cross section.
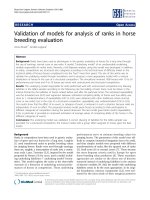
Fig. 2.3.3 shows a mobility plot of a 9.1-m-long pile with
similar soil conditions to the pile in Fig. 2.3.2, but with a
necked section at 3.1 m. The pile tip reflection from 9.1 m is
clearly visible on the plot, as indicated by the constant fre-
quency spacing between resonant peaks of 215 Hz. The
frequency spacing of 645 Hz between the two most promi-
nent peaks corresponds to the reflection from the necked sec-
tion at a depth of 3.1 m.
In common with the sonic-echo test, a relatively small
amount of energy is generated by the hammer impact, and
soil damping effects limit the depth from which useful
information may be obtained. However, even where no mea-
surable shaft base response is present, the dynamic stiffness
is still a useful parameter for comparative shaft assessment.
2.3.3 Impedance logging—A recent approach to interpret-
ing the responses from a combination of both sonic-echo and
mobility surface reflection methods is impedance logging
(Paquet, 1991), where the information from the amplified
time-domain response of the sonic echo is combined with the
characteristic impedance of the shaft measured with the mo-
bility test.
Principle—Even though the force applied to the head of
the shaft by the surface reflection methods is transient, the
Fig. 2.3.2—Example of impulse-response (mobility) plot for
test of pile.
Fig. 2.3.3—Impulse-response (mobility) plot of pile with
necked section at distance of 2.4 m from top.
228.2R-15NONDESTRUCTIVE TEST METHODS
wave generated by the blow is not. This wave contains infor-
mation about changes in shaft impedance as it proceeds
downward, and this information is reflected back to the shaft
head. The reflectogram so obtained in the sonic-echo test
can not be quantified. However, it is possible with modern
recording equipment to sample both wave reflection and im-
pedance properties of tested shafts. Measurements of force
and velocity response are stored as time-base data, with a
very wide band-pass filter and rapid sampling. Resolution of
both weak and strong response levels are thus favored. In the
reflectogram, a complete shaft defect (zero impedance) is
equivalent to 100 percent reflection, while an infinitely long
shaft with no defects would give zero reflection.
If either a defect or the shaft tip is at a considerable dis-
tance from the shaft head, the reflected amplitude is reduced
by damping within the shaft. With uniform lateral soil con-
ditions, this damping function has the form e
-
σ
L
, where L is
the shaft length and
σ
is the damping factor (see Appendix
A), and the reflectogram can be corrected using such an am-
plification function to yield a strong response over the total
shaft length, as is frequently done in the treatment of sonic-
echo data. Fig. 2.3.4 shows an example of a reflectogram
corrected in this way.
The frequency-domain (impedance) analysis obtained
from the impulse-response test confirms shaft length and
gives the shaft dynamic stiffness and characteristic imped-
ance I
(2.12)
where
ρ
c
= density of shaft concrete,
A
c
= shaft cross-sectional area, and
C
b
= concrete bar wave velocity.
I
ρ
c
A
c
C
b
=
In addition, simulation of the tested shaft and its surround-
ing soil can be carried out most efficiently in the frequency
domain. The reflectogram and the characteristic impedance
can then be combined to give dimensions to the reflectogram
to produce a trace referred to as the impedance log [Fig.
2.3.4(c)]. The output of this analysis is in the form of a ver-
tical section through the shaft, giving a calculated visual rep-
resentation of the pile shape. The final result can be adjusted
to eliminate varying soil reflections by use of the simulation
technique.
Field testing equipment must have the following require-
ments:
• Hammer load cell and the velocity transducer or accel-
erometer must have been correctly calibrated (within
the six months prior to testing);
• Data acquisition and storage must be digital, for future
analysis; and
• Both time and frequency-domain test responses must be
stored.
2.3.4 Crosshole sonic logging—The crosshole sonic log-
ging method is designed to overcome the depth limitation of
the sonic-echo and mobility methods on longer shafts, and is
for use on mass concrete foundations such as slurry trench
walls, dams and machinery bases (Levy, 1970; Davis and
Robertson, 1975; Baker and Khan, 1971).
Principle—The method requires a number of parallel met-
al or plastic tubes to be placed in the structure prior to con-
crete placement, or core holes to be drilled after the concrete
has set. A transmitter probe placed at the bottom of one tube
emits an ultrasonic pulse that is detected by a receiver probe
at the bottom of a second tube. A recording unit measures the
time taken for the ultrasonic pulse to pass through the con-
crete between the tubes. The probes are sealed units, and the
Fig. 2.3.4—(a) Planned defects in experimental pile; (b) reflectogram obtained by signal
processing of sonic-echo data; and (c) impedance log obtained by combining information
from reflectogram and characteristic impedance obtained from impulse-response analysis.
228.2R-16 ACI COMMITTEE REPORT
tubes are filled with water to provide coupling between the
probes and the concrete.
The probe cables are withdrawn over an instrumented
wheel that measures the cable length and thus probe depth, or
the cables can be marked along their lengths so that the probe
depths are known. Continuous pulse measurements are made
during withdrawal, at height increments ranging from 10 to
50 mm, providing a series of measurements that can be print-
ed out to provide a vertical profile of the material between
the tubes. A typical test result for a specific commercial sys-
tem is shown in Fig. 2.3.5. The presence of a defect is indi-
cated by the absence of a received signal.
The ultrasonic pulse velocity (UPV) is a function of the
density and dynamic elastic constants of the concrete. If the
signal path length is known and the transit time is recorded,
the apparent UPV can be calculated to provide a guide to the
quality of the concrete. A reduction in modulus or density
will result in a lower UPV. If the path length is not known,
but the tubes are reasonably parallel, the continuous mea-
surement profile will clearly show any sudden changes in
transit time caused by a lower pulse velocity due to low mod-
ulus or poor-quality material, such as contaminated concrete
or inclusions. Voids will have a similar effect by forcing the
pulse to detour around them, thus increasing the path length
and the transit time. By varying the geometric arrangement
of the probes, the method can resolve the vertical and
hor-
izontal extent of such defects, and locate fine cracks or dis-
continuities.
The method provides a direct measurement of foundation
depth, and can be used to assess the quality of the interface
between the shaft base and the bedrock if the access holes are
extended below the base. The major limitation of the method
is the requirement for the installation of access tubes either
before concrete placement or by core drilling afterwards.
The major advantage is that the method has no depth limita-
tion, unlike the surface reflection methods.
The information obtained is limited to the material imme-
diately between pairs of tubes. Hence, in piles the access
tubes should be arranged as close to the shaft periphery as
possible, and in a pattern that allows the maximum coverage
of the concrete between them. No information will be ob-
tained about increases or decreases in shaft cross section out-
side the area covered by the access tubes.
2.3.5 Parallel-seismic method—All of the above methods
depend upon clear access to the head of the pile shaft, and are
therefore easiest and most practical to perform during the
construction phase as foundation heads later may be inacces-
sible. The parallel-seismic method was developed specifical-
ly for situations arising after the foundation has been built
upon, as in the evaluation of older, existing structures, where
direct access to the pile head is no longer possible without
some demolition (Davis, 1995).
Principle—A small-diameter access bore hole is drilled
into the soil parallel and close to the foundation to be tested.
The bore hole must extend beyond the known or estimated
depth of the foundation, and is normally lined with a plastic
tube to retain water as an acoustic couplant. An acoustic re-
ceiving probe is placed in the tube at the top, and the struc-
ture is struck as close to the head of the foundation as
possible with a trigger hammer. The signals from the ham-
mer and receiver are recorded on a data acquisition unit as
the time taken for the impact stress wave to travel through
the foundation and adjacent soil to the receiving probe. The
probe is then lowered in uniform increments and the process
repeated at each stage, with the impact at the same point each
time. The recorded data are plotted as a vertical profile with
each wave transit time from the point of impact to each posi-
tion down the access tube (Fig. 2.3.6).
The velocity of the wave will be lower through soil than
through the concrete. If the access tube is reasonably parallel
to the foundation, the effect of the soil between the tube and
the pile shaft will be effectively constant. However, transit
time will increase, proportional to the increase in foundation
depth. When the receiver has passed beyond the foundation
base, the transit time of the signal will be extended by the
lower velocity of the additional intervening soil, and the
lines linking signal arrival points on the graph will show a
distinct discontinuity at the level of the foundation base.
Similarly, any significant discontinuity or inclusion in the
foundation will force the signal to detour around it, increas-
ing the path length and transit time.
2.3.6 Advantages and limitations—Table 2.3 summarizes
the advantages and limitations of stress-wave methods for
deep foundations.
2.4—Nuclear methods
2.4.1 Introduction—Nuclear methods for nondestructive
evaluation of concrete can be subdivided into two groups:
Fig. 2.3.5—Example of crosshole sonic log (absence of sig-
nal arrival at a depth of about 10 m indicates presence of
defect).
228.2R-17NONDESTRUCTIVE TEST METHODS
radiometric methods and radiographic methods. Both in-
volve gaining information about a test object due to interac-
tions between high-energy electromagnetic radiation and the
material in the test object. A review of the early develop-
ments in the use of nuclear methods (also called radioactive
method) was presented by Malhotra (1976), and more recent
developments were reviewed by Mitchell (1991). These
methods use radioactive materials, and test personnel re-
quire specialized safety training and licensing.
Radiometry is used to assess the density of fresh or hard-
ened concrete by measuring the intensity of electromagnetic
radiation (gamma rays) that has passed through the concrete.
The radiation is emitted by a radioactive isotope, and the ra-
diation passing through the concrete is sensed by a detector.
The detector converts the received radiation into electrical
pulses, which can be counted or analyzed by other methods
(Mitchell, 1991). Radiometry can be further subdivided into
two procedures. One is based on measurement of gamma
rays after transmission directly through the concrete, and the
other is based on measurement of gamma rays reflected, or
backscattered, from within the concrete. These procedures
are analogous to the ultrasonic through-transmission method
and the pitch-catch method using stress waves.
Radiography involves the use of the radiation passing
through the test object to produce a “photograph” of the
internal structure of the concrete. Typically, a radioactive
source is placed on one side of the object and special photo-
graphic film is placed on the opposite side to record the in-
tensity of radiation passing through the object. The higher
the intensity of the radiation, the greater the exposure of the
film. This method is identical to that used to produce medi-
cal “x-rays.”
2.4.2 Direct transmission radiometry for density—Direct
transmission techniques can be used to detect reinforcement.
However, the main use of the technique is to measure the in-
place density, both in fresh and hardened concrete. Struc-
tures of heavyweight and roller-compacted concretes are
cases where this method is of particular value.
Principle—The direct transmission radiometric method is
analogous to the ultrasonic through-transmission technique.
The radiation source is placed on one side of the concrete
element to be tested and the detector is placed on the oppo-
site side. As the radiation passes through the concrete, a por-
tion is scattered by free electrons (Compton scattering) and a
smaller amount is absorbed by the atoms. The amount of
Compton scattering depends on the density of the concrete
and the amount of absorption depends on chemical composi-
tion (Mitchell, 1991). If the source-detector spacing is held
constant, a decrease (or increase) in concrete density leads to
a change in the intensity of the detected radiation.
Instrumentation—Fig. 2.4.1 shows the arrangement of
source and detector for direct measurement through a con-
crete member. This arrangement could also be used for test-
ing fresh concrete with allowance made for the effects of the
formwork material. The most widely used source is the ra-
dioactive isotope cesium-137 (
137
Cs). The common detector
is a Geiger-Müller tube, which produces electrical pulses
when radiation enters the tube. Other detectors can be scin-
tillation crystals that convert the incident radiation into light
pulses.
Fig. 2.4.2 is a schematic of a commercially available nu-
clear transmission gauge that can be used in fresh concrete
by pushing the source assembly into the concrete. It can also
be used in hardened concrete by drilling a hole and inserting
Fig. 2.3.6—Example of results from parallel-seismic test (depth of pile shaft is indicated
by change in slope of line representing arrival time of stress pulse as function of depth).
228.2R-18 ACI COMMITTEE REPORT
Table 2.3—Advantages and limitations of stress-wave methods for deep
foundations
the source assembly. The equipment is portable and provides
an immediate readout of the results. Most of the available
units
were developed for monitoring soil compaction and measur-
ing the in-place density of asphalt concrete.
The VUT density meter was developed (in Czechoslova-
kia) specifically for testing fresh concrete (Hönig, 1984).
Fig. 2.4.3 is a schematic of this device. The source can be
lowered up to a depth of 200 mm into a hollow steel needle
that is pushed into the fresh concrete. A spherical lead shield
suppresses the radiation when the source is in its retracted
position. Detectors are located beneath the treads used to
push the needle into the concrete. The unit is claimed to have
a resolution of 10 kg/m
3
(Hönig, 1984).
The direct transmission gauges mentioned above provide
a measurement of the average density between the source
and detector. Fig. 2.4.4 is a schematic of a two probe source/
detector system for measuring the density of fresh concrete
as a function of depth (Iddings and Melancon, 1986). The
source and detector are moved up and down within metal
tubes that are pushed into the fresh concrete, thus making it
possible to measure density as a function of depth.
ASTM C 1040 provides procedures for using nuclear
methods to measure the in-place density of fresh or hardened
concrete. The key element of the procedure is development
of the calibration curve for the instrument. This is accom-
plished by making test specimens of different densities and
determining the gauge output for each specimen. The gauge
output is plotted as a function of the density, and a best-fit
curve is determined.
2.4.3 Backscatter radiometry for density—Backscatter
techniques are particularly suitable for applications where a
large number of in situ measurements are required. Since back-
scatter measurements are affected by the top 40 to 100 mm,
the
method is best suited for measurement of the surface zone of
a concrete element. A good example of the use of this meth-
od is the monitoring of the density of bridge deck overlays.
Non-contacting equipment has been developed that is used
Fig. 2.4.1—Direct transmission radiometry with source and
detector external to test object.
Fig. 2.4.2—Schematic of direct transmission nuclear gage.
228.2R-19NONDESTRUCTIVE TEST METHODS
for continuous monitoring of concrete pavement density
during slip-form operations.
Principle—In the measurement of density by backscatter,
the radiation source and the detector are placed on the same
side of the sample (analogous to the pitch-catch method for
stress waves). The difference between this procedure and di-
rect transmission is that the detector receives gamma rays
scattered within the concrete rather than those which pass
through the concrete. The scattered rays are lower in energy
than the transmitted ones and are produced when a photon
collides with an electron in an atom. Part of the photon ener-
gy is imparted to the electron, and a new photon emerges,
traveling in a new direction with lower energy. As men-
tioned, this process is known as Compton scattering (Mitch-
ell, 1991).
Procedures for using backscatter methods to measure con-
crete density are given in ASTM C 1040. As is the case with
direct transmission measurements, it is necessary to estab-
lish a calibration curve prior to using a nuclear backscatter
gauge to measure in-place density.
Instrumentation—Fig. 2.4.5 is a schematic of a backscatter
nuclear gauge for density measurement. Many commercial
gauges are designed so that they can be used in either direct
transmission or backscatter mode. To operate in backscatter
mode, the source is positioned so that it located above the sur-
face of the concrete. Shielding is provided to prevent radiation
from traveling directly from the source to the detector.
Certain specialized versions of backscatter equipment
have been developed. Two of particular interest are de-
scribed below:
ETG probe—The ETG probe was developed in Denmark
to use backscatter measurements for estimating density vari-
ation at different depths in a medium. The technique in-
volves determination of the intensity of backscattered
gamma radiation as a function of energy level. A beam of
parallel (collimated) gamma rays is used and multiple
measurements are made with the beam at slightly different
angles of penetration. By comparing the radiation spectra for
the multiple measurements, information can be obtained
about the density in a specific layer of the concrete. In addi-
tion to permitting measurement of density at discrete layers,
the ETG probe also permits density measurements at greater
depths (up to 150 mm) than are possible by ordinary back-
scatter gauges.
Consolidation monitoring device—This equipment was
developed for continuous monitoring of pavement consolida-
tion during slip-form construction (Mitchell et al., 1979). The
device is mounted on the rear of a highway paving machine
and traverses across the finished pavement at a height of
about 25 mm above the pavement surface. An air gap com-
pensating device allows for air gap variations of ±10 mm. The
devices measures the average density within the top 100 mm
of the pavement.
2.4.4 Radiography—Radiography provides a means of ob-
taining a radiation-based photograph of the interior of con-
crete because denser materials block more of the radiation.
From this photograph, the location of reinforcement, voids in
concrete, or voids in grouting of post-tensioning ducts can be
identified.
Fig. 2.4.3—Schematic of nuclear gage for measuring
density of fresh concrete (based on Hönig, 1984).
Fig. 2.4.4—Schematic of direct transmission nuclear gage
for measuring density of fresh concrete at different depth
(adapted from Iddings and Melancon, 1986).
228.2R-20 ACI COMMITTEE REPORT
Principle—A radiation source is placed on one side of the
test object and a beam of radiation is emitted. As the radia-
tion passes through the member, it is attenuated by differing
amounts depending on the density and thickness of the mate-
rial that is traversed. The radiation that emerges from the op-
posite side of the object strikes a special photographic film
(Fig. 2.4.6). The film is exposed in proportion to the intensity
of the incident radiation. When the film is developed, a two-
dimensional visualization (a photograph) of the interior
structure of the object is obtained. The presence of a high-
density material, such as reinforcement, is shown on the de-
veloped film as a light area, and a region of low density, such
as a void, is shown as a dark area.
The British Standards Institute has adopted a standard for
radiographic testing of concrete (BS 1881: Part 205). The
standard provides recommendations for investigators consid-
ering radiographic examinations of concrete (Mitchell,
1991).
Instrumentation—In x-radiography, the radiation is pro-
duced by an x-ray tube (Mitchell, 1991). The penetrating
ability of the x-rays depends on the operating voltage of the
x-ray tube. In gamma radiography, a radioactive isotope is
used as the radiation source. The selection of a source de-
pends on the density and thickness of the test object and on
the exposure time that can be tolerated. The most intense
source is cobalt-60 (
60
Co), which can be used to penetrate up
to 500 mm of concrete. For members with thickness of 150
mm or less, iridium-192 (
192
Ir) or cesium-137(
137
Cs) can be
used (Mitchell, 1991). The film type will depend on the
thickness and density of the member being tested.
Most field applications have used radioactive sources be-
cause of their greater penetrating ability (higher energy radi-
ation) compared with x-rays. A system known as “Scorpion
II,” developed in France, uses a linear accelerator to produce
very high energy x-rays that can penetrate up to 1 m of con-
crete. This system was developed for the inspection of pre-
stressed members to establish the condition and location of
prestressing strands and to determine the quality of grouting
in tendon ducts (Mitchell, 1991).
2.4.5 Gamma-gamma logging of deep foundations—Used
to evaluate the integrity of drilled shaft and slurry wall foun-
dations, this method tests the density of material surrounding
access tubes or holes in concrete deep foundations. Gamma-
gamma logging uses a radioactive source and counter that
may be either in separate probes (direct transmission) or
housed in the same unit (backscatter) (Preiss and Caiserman,
1975; Davis and Hertlein, 1994).
Principle—The most common method is by backscatter,
with the probe lowered down a single dry plastic access tube,
and raised in steps to the surface. Low density zones, such as
soil inclusions within 50 to 100 mm from the probe, will in-
crease the radiation count, since less radiation is absorbed
than in a zone of intact concrete (Fig. 2.4.7). A limitation of
the method is the need for stronger radiation sources to in-
crease the zone of influence of the probe around the tube.
The effect of different access tube materials on radiation
count density is demonstrated in Fig. 2.4.7, which shows
plots of radiation counts from an experimental drilled shaft
with four access tubes: two of plastic and two of steel (Baker
et al., 1993). The response from the shaft constriction at 11
to 12 m is attenuated by the steel tubes. The figure also
shows that a small elliptical inclusion at 4 m is not detected
in any of the traces, demonstrating the limitation of the meth-
od to locate small anomalies or defects.
When gamma-gamma logging is used in the direct trans-
mission mode in parallel tubes (Preiss, 1971), the data can be
analyzed in a similar manner to that from sonic logging. This
technique requires a very strong source, and dedicated equip-
ment for this purpose does not exist in North America at
present.
2.4.6 Advantages and limitations—Table 2.4 summarizes
the advantages and limitations of the nuclear methods. Direct
transmission radiometry requires a drilled hole in hardened
concrete, and it provides for rapid determination of the in-
place density of concrete. The equipment is reasonably por-
table, making it suitable for use in the field. Minimal opera-
tor skills are needed to make the measurements. For the
commercially available equipment, the source/detector
Fig. 2.4.5—Schematic of backscatter nuclear density gage.
Fig. 2.4.6—Schematic of radiographic method.
228.2R-21NONDESTRUCTIVE TEST METHODS
separation is limited to a maximum of about 300 mm. Further-
more, the most commonly available equipment measures an
average density between the immersed source and the surface
detector. It is not able to identify areas of low compaction at
specific depths. All immersed-probe techniques for fresh con-
crete have the further drawback that the immersion of the
probe may have a localized influence on the concrete being
measured. Test results may be affected by the presence of re-
inforcing steel located near the source-detector path.
Backscatter tests can be used on finished surfaces where
direct transmission measurements would be impractical or
disruptive. The equipment is portable and tests can be con-
ducted rapidly. However, the precision of backscatter gages
is less than that of direct transmission devices. ASTM C
1040 requires that a suitable backscatter gauge for density
measurement should result in a standard deviation of less
than 16 kg/m
3
; for a suitable direct-transmission gauge, the
standard deviation is less than 8 kg/m
3
. According to ASTM
C 1040, backscatter gauges are typically influenced by the
top 75 to 125 mm of material. The top 25 mm determines 50
to 70 percent of the count rate and the top 50 mm determines
80 to 95 percent of the count rate. When the material being
tested is homogenous, this inherent characteristic of the
method is not significant. However, when a thin overlay is
placed on existing concrete, this effect has to be considered
in interpreting the results. Also, the presence of reinforcing
steel within the influence zone will affect the count rate.
Radiographic methods allow the possibility of seeing
some of the internal structure of a concrete member where
density variations exist. Although both gamma ray and x-ray
sources can be used for radiography, x-ray equipment is
comparatively expensive and cumbersome for field applica-
tion. Because of this, less costly and more portable gamma-
ray equipment is generally chosen for field use. However, x-
ray equipment has the advantage that it can be turned off
when its not being used. In contrast, gamma rays are emitted
continuously from a radioactive source and heavy shielding
is required to protect personnel. In addition, x-ray equipment
can produce more energetic radiation than radioactive sourc-
es, which permits the inspection of thicker members or the
use of shorter exposure times.
The main concern in the use of all nuclear methods is safe-
ty. In general, personnel who perform nuclear tests must ob-
tain a license from the appropriate governmental agency
(Mitchell, 1991). Testing across the full thickness of a con-
crete element is particularly hazardous and requires exten-
sive precautions, skilled personnel, and highly specialized
equipment. Radiographic procedures are costly and require
evacuation of the structure by persons not involved in the ac-
tual testing. The use of x-ray equipment poses an additional
danger due to the high voltages that are used. There are lim-
its on the thicknesses of the members that can be tested by
radiographic methods. For gamma-ray radiography the max-
imum thickness is about 500 mm, because thick members re-
quire unacceptably long exposure times. Radiography is not
very useful for locating crack planes perpendicular to the
radiation beam.
2.5—Magnetic and electrical methods
Knowledge about the quantity and location of reinforce-
ment is needed to evaluate the strength of reinforced concrete
members. Knowing whether there is active corrosion of rein-
forcement is necessary to assess the need for remedial actions
before structural safety or serviceability is jeopardized. This
section discusses some of the magnetic and electrical methods
used to gain information about the layout and condition of em-
bedded steel reinforcement (Malhotra, 1976; Bungey, 1989;
Lauer, 1991). Devices to locate reinforcing bars and estimate
the depth of cover are known as covermeters. Corrosion activ-
ity can be monitored using the half-cell potential technique,
and information on the rate of corrosion can be obtained from
linear-polarization methods.
2.5.1 Covermeters—As is common with other nondestruc-
tive test methods used to infer conditions within concrete,
covermeters “measure” the depth of cover by monitoring the
interaction of the reinforcing bars with some other process.
For most covermeters, the interaction is between the bars and
a low-frequency, electromagnetic field. The basic relation-
ships between electricity and magnetism are the keys for un-
derstanding the operation of covermeters. One of the
important principles is electromagnetic induction, which
means that an alternating magnetic field intersecting an
Fig. 2.4.7—Gamma-gamma backscatter log on experimen-
tal shaft with planned defects (Baker et al., 1993).
228.2R-22 ACI COMMITTEE REPORT
Table 2.4—Advantages and limitations of nuclear methods
electrical circuit induces an electrical potential in that circuit.
According to Faraday’s law, the induced electrical potential
is proportional to the rate of change of the magnetic flux
through the area bounded by the circuit (Serway, 1983).
Commercial covermeters can be divided into two classes:
those based on the principle of magnetic reluctance, and
those based on eddy currents. These differences are summa-
rized below (Carino, 1992).
Magnetic reluctance meters—When current flows through
an electrical coil, a magnetic field is created and there is a flow
of magnetic flux lines between the magnetic poles. This leads
to a magnetic circuit, in which the flow of magnetic flux be-
tween poles is analogous to the flow of current in an electrical
circuit (Fitzgerald et al., 1967). The resistance to flow of mag-
netic flux is called reluctance, which is analogous to the resis-
tance to flow of current in an electrical circuit.
Fig. 2.5.1 is a schematic of a covermeter based upon
changes in the reluctance of a magnetic circuit caused by the
presence or absence of a bar within the vicinity of the search
head. The search head is composed of a ferromagnetic U-
shaped core (yoke), an excitation coil, and a sensing coil.
When alternating current (less than 100 Hz) is applied to the
excitation coil, an alternating magnetic field is created, and
magnetic flux flows between the poles of the yoke. In the ab-
sence of a bar [Fig. 2.5.1(a)], the magnetic circuit, composed
of the yoke and the concrete between ends of the yoke, has a
high reluctance and the alternating magnetic flux flowing be-
tween the poles will be small. The alternating flux induces a
small, secondary current in the sensing coil. If a ferromagnetic
bar is present [Fig. 2.5.1(b)], the reluctance decreases, the
magnetic flux amplitude increases, and the sensing coil cur-
rent increases. Thus, the presence of the bar is indicated by a
change in the output from the sensing coil. For a given rein-
forcing bar, the reluctance of the magnetic circuit depends
strongly on the distance between the bar and the poles of the
yoke. An increase in concrete cover increases the reluctance
and reduces the current in the sensing coil. If the meter out-
put were plotted as a function of the cover, a calibration re-
lationship would be established that could be used to
measure the cover. Since the size of the bar affects the reluc-
tance of the magnetic circuit, there would be a separate rela-
tionship for each bar size. These aspects are discussed
further later in this section.
Eddy-current meters—If a coil carrying an alternating cur-
rent is brought near an electrical conductor, the changing
magnetic field induces circulating currents, known as eddy
currents, in the conductor. Because any current flow gives
rise to a magnetic field, eddy currents produce a secondary
magnetic field that interacts with the field of the coil. The
second class of covermeters is based on monitoring the
effects of the eddy currents induced in a reinforcing bar.
There are two categories of eddy-current meters: one is
based on the continuous excitation of the coil by an alternat-
ing current (usually at about 1 kHz) and the other is based
upon pulsed excitation. The latter is not discussed here, but
the interested reader is referred to additional information in
Carino (1992).
Fig. 2.5.2 is a schematic of a continuous eddy-current cover-
meter. In the absence of a reinforcing bar, the magnitude of the
alternating current in the coil depends on the coil impedance.
*
If the coil is brought near a reinforcing bar, alternating eddy
currents are established within the surface skin of the bar.
The eddy currents give rise to an alternating secondary mag-
netic field that induces a secondary current in the coil. In ac-
cordance with Lenz’s law (Serway, 1983), the secondary
current opposes the primary current. As a result, the net cur-
rent flowing through the coil is reduced, and the apparent im-
pedance of the coil increases (Hagemaier, 1990). Thus, the
presence of the bar is inferred by monitoring the change in
current flowing through the coil.
In summary, magnetic reluctance covermeters are based
on monitoring changes in the magnetic flux flowing through
the magnetic circuit composed of the path through the yoke,
* When direct current is applied to a circuit, the amount of current equals the volt-
age divided by the electrical resistance of the circuit. When alternating current is
applied to the coil, the amount of current is governed by the value of the applied volt-
age, the resistance, and another quantity called inductance. The vector sum of resis-
tance and inductance defines the impedance of the coil.
228.2R-23NONDESTRUCTIVE TEST METHODS
concrete, and the reinforcing bar. For a given cover, the
meter output depends on the area of the reinforcing bar and
its magnetic properties (affected by alloy composition and
type of mechanical processing). On the other hand, eddy-
current covermeters depend on the electrical conductivity of
the bar, and they will detect magnetic as well non-magnetic,
metallic objects. However, a ferromagnetic material produc-
es a stronger signal because of the enhanced strength of the
secondary magnetic field created by the eddy currents. The
response of magnetic reluctance covermeters is affected by
the presence of iron-bearing aggregates in the concrete,
while eddy-current meters are not.
Limitations—A reinforcing bar is detected by a coverme-
ter when the bar lies within the zone of influence of the
search head (yoke or coil). Fig. 2.5.3(a) illustrates that influ-
ence zone of the search head. The response is maximum
when the search head lies directly above the reinforcing bar.
An important characteristic of a covermeter is the relation-
ship between meter amplitude and the horizontal distance
from the center of the bar to the center of the search head,
that is, the horizontal offset. Fig. 2.5.3(b) shows the varia-
tion in amplitude with horizontal offset for a magnetic reluc-
tance covermeter when the search head is moved away from
a No. 6 bar (19 mm) with a cover depth of 21 mm. The vari-
ation is approximately a bell-shaped curve. The width of the
curve in Fig. 2.5.3(b) defines the zone of influence of the
search head. Fig. 2.5.3(c) shows the relationships between
amplitude and horizontal offset for two different search
heads (probes) of an eddy-current meter. One search head
has a smaller zone of influence than the other, which means
that it is a more focused search head. A covermeter with a fo-
cused search head can discern individual bars when they are
closely spaced.
However, focused search heads generally
have less penetrating ability and are not able to locate bars
with deep
cover. The influence zone of the search head also
affects the
accuracy with which the end of a reinforcing bar
can be detected (Carino, 1992).
An important distinction between covermeters is the direc-
tionality characteristics of the search heads. Due to the shape
of the yoke, a magnetic reluctance meter is directional com-
pared with a continuous eddy-current meter with a symmet-
rical coil. Maximum response occurs when the yoke is
aligned with the axis of the bar. This directionality can be
used to advantage when testing a structure with an orthogo-
nal gridwork of reinforcing bars (Tam et al., 1977).
As mentioned previously, each covermeter has a unique
relationship between meter amplitude and depth of cover.
Fig. 2.5.4(a) shows a technique that can be used to develop
these relationships for different bar diameters. A single bar is
placed on a nonmagnetic and nonconducting surface and the
meter amplitude is determined as a function of the distance
between the search head and the top of the bar. Fig. 2.5.4(b)
and 2.5.4(c) show these relationships for a magnetic reluc-
tance and for an eddy-current meter, respectively. These re-
lationships illustrate a basic limitation of covermeters. Since
the amplitude is a function of bar diameter and depth of cov-
er, one cannot determine both parameters from a single mea-
surement. As a result, a dual measurement is needed to be
able to estimate both depth of cover and diameter (BS 1881:
Part 204; Das Gupta and Tam, 1983). This is done by record-
ing the meter amplitude first with the search head in contact
with the concrete, and then when the search head is located a
Fig. 2.5.1—Covermeter based on principle of magnetic
reluctance (adapted from Carino, 1992): (a) small current
induced in sensing coil when no bar is present, and (b)
presence of bar increases flux and increases current in
sensing coil.
Fig. 2.5.2—Covermeter based on eddy current principle
(adapted from Carino, 1992): (a) coil in air results in
characteristic current amplitude, and (b) interaction with
reinforcing bar causes changes in coil impedance and
current amplitude.
228.2R-24 ACI COMMITTEE REPORT
known distance above the concrete. The differences in am-
plitudes and the amplitude-cover relationships are used to es-
timate the cover and bar diameter. The accuracy of this
spacer technique depends on how distinct the amplitude-cov-
er relationships are for the different bar sizes. Because these
relationships are generally similar for adjacent bar sizes, it is
generally only possible to estimate bar diameter within two
sizes (Bungey, 1989).
The single-bar, amplitude-cover relationships are only val-
id when the bars are sufficiently far apart so that there is little
interference by adjacent bars. Fig. 2.5.5(a) shows a technique
used to investigate the effect of bar spacing on covermeter re-
sponse (Carino, 1992). For multiple, closely-spaced bars, the
amplitude may exceed the amplitude for a single bar at the
same cover depth. If they are closer than a critical amount,
the individual bars cannot be discerned. The critical spacing
depends on the type of covermeter and the cover depth. In
general, as cover increases, the critical spacing also increases.
Fig. 2.5.5(b) and 2.5.5(c) show the response for multiple bars
at different spacing using a magnetic reluctance meter. The
horizontal line is the single-bar amplitude for the same bar
size and cover depth. For the 75-mm center-to-center spac-
ing, the meter is just barely able to discern the locations of the
individual bars, and the amplitude is not too much higher
than the single-response. Fig. 2.5.5(d) and 2.5.5(e) show the
responses for an eddy-current meter. The locations of the in-
dividual bars are easily identified for the 70-mm spacing, but
the amplitude is greater than the single-bar amplitude. Thus,
the cover would be underestimated if the single-bar, ampli-
tude-cover relationship were used. The response of a cover-
meter to the presence of multiple, closely-spaced bars
depends on its design. Teodoru (1996) reports that problems
may be encountered when bar spacings are less than approx-
imately the lateral dimensions of the search head.
The presence of two layers of reinforcement within the
zone of influence cannot generally be identified with ordi-
nary covermeters (Bungey, 1989; Carino, 1992). The upper
layer produces a much stronger signal than the deeper second
layer, so that the presence of the second layer cannot be dis-
cerned. However, it has been shown that it may be possible
to determine lap length when bars are in contact (Carino,
1992).
Table 2.5 summarizes the advantages and limitations of
covermeters. These devices are effective in locating individ-
ual bars provided that the spacing exceeds a critical value
that depends on the meter design and the cover depth. By us-
ing multiple measurement methods, bar diameter can gener-
ally be estimated within two adjacent bar sizes if the spacing
exceeds certain limits that are also dependent on the particu-
lar meter. Meters are available that can estimate bar diameter
without using spacers to make multiple measurements.
Again, the accuracy of these estimates decreases as bar spac-
ing decreases. To obtain reliable measurements, it is advis-
able to prepare mock-ups of the expected reinforcement
Fig. 2.5.3—(a) Zone of influence of covermeter search head; variation of amplitude with
horizontal offset for: (b) magnetic reluctance covermeter, and (c) eddy current covermeter
(adapted from Carino, 1992).
228.2R-25NONDESTRUCTIVE TEST METHODS
configuration to establish whether the desired accuracy is
feasible. The mock-ups can be made without using concrete,
provided the in-place concrete does not contain significant
amounts of iron-bearing aggregates.
2.5.2 Half-cell potential method—Electrical methods are
used to evaluate corrosion activity of steel reinforcement. As
is the case with other NDT methods, an understanding of the
underlying principles of these electrical methods is needed
to obtain meaningful results. In addition, an understanding
of the factors involved in the corrosion mechanism is essen-
tial for reliable interpretation of data from this type of test-
ing. This section and the one to follow provide basic
information about these methods. However, actual testing
and interpretation of test results should be done by experi-
enced personnel.
The half-cell potential method is used to delineate those
portions of the structure where there is a high likelihood of
corrosion activity. Before describing the test procedure, a
brief discussion of the basic principles of corrosion testing is
provided. Readers should consult ACI 222R for additional in-
formation on the factors affecting corrosion of steel in concrete.
Principle—Corrosion is an electrochemical process in-
volving the flow of charges (electrons and ions). Fig. 2.5.6
shows a corroding steel bar embedded in concrete. At active
sites on the bar, called anodes, iron atoms lose electrons and
move into the surrounding concrete as ferrous ions. This
process is called a half-cell oxidation reaction, or the anodic
reaction, and is represented as follows
(2.13)
The electrons remain in the bar and flow to sites called cath-
odes, where they combine with water and oxygen present in
the concrete. The reaction at the cathode is called a reduction
reaction and is represented as follows
2H
2
O + O
2
+ 4e
-
→ 4OH
-
(2.14)
To maintain electrical neutrality, the ferrous ions migrate
through the concrete to these cathodic sites where they com-
bine to form hydrated iron oxide, or rust. Thus, when the bar
is corroding, electrons flow through the bar and ions flow
through the concrete. When the bar is not corroding, there is
no flow of electrons and ions.
As the ferrous ions move into the surrounding concrete,
the electrons left behind in the bar give the bar a negative
charge. The half-cell potential method is used to detect this
negative charge and thereby provide an indication of corro-
sion activity.
Instrumentation—The standard test method is given in
ASTM C 876 and is illustrated Fig. 2.5.7. The apparatus
includes a copper-copper sulfate (or electrically similar) half
Fe Fe
2+
2e
-
+→
Fig. 2.5.4—Covermeter amplitude versus cover: (a) testing configuration; (b) results for
magnetic reluctance meter; and (c) results for eddy current meter (adapted from Carino,
1992).