surface engineering of zno nanostructures for semiconductor sensitized solar cells
Bạn đang xem bản rút gọn của tài liệu. Xem và tải ngay bản đầy đủ của tài liệu tại đây (5.03 MB, 31 trang )
©
2014 WILEY-VCH Verlag GmbH & Co. KGaA, Weinheim
1
www.advmat.de
www.MaterialsViews.com
wileyonlinelibrary.com
REVIEW
Surface Engineering of ZnO Nanostructures for
Semiconductor-Sensitized Solar Cells
Jun Xu , Zhenhua Chen , Juan Antonio Zapien , Chun-Sing Lee ,* and Wenjun Zhang*
DOI: 10.1002/adma.201400403
1. Introduction
With the advance of nanotechnology, a variety of novel photo-
voltaic (PV) devices based on nanostructures have been devel-
oped in recent years.
[ 1–7 ]
These include dye-sensitized solar cells
(DSSCs),
[ 8–11 ]
colloidal nanocrystal thin-fi lm solar cells,
[ 12,13 ]
and three-dimensional (3D) nanostructured semiconductor
junction solar cells,
[ 14–17 ]
among others. These new types of
devices can be classifi ed as the third-generation solar cells, fol-
lowing the fi rst generation of crystalline silicon bulk solar cells
that followed by a second generation of thin fi lms cells based
on a variety of materials including amorphous Si, polycrystal-
line cadmium telluride, or copper indium gallium selenide
(CIGS). As compared with their bulk and thin-fi lm counter-
parts, nanomaterials often have unique and, importantly, tun-
able electronic and optical properties resulting from their sizes
Semiconductor-sensitized solar cells (SSCs) are emerging as promising
devices for achieving effi cient and low-cost solar-energy conversion. The
recent progress in the development of ZnO-nanostructure-based SSCs is
reviewed here, and the key issues for their effi ciency improvement, such as
enhancing light harvesting and increasing carrier generation, separation, and
collection, are highlighted from aspects of surface-engineering techniques.
The impact of other factors such as electrolyte and counter electrodes on
the photovoltaic performance is also addressed. The current challenges and
perspectives for the further advance of ZnO-based SSCs are discussed.
Dr. J. Xu, Dr. Z. Chen, Dr. J. A. Zapien, Prof. C S. Lee,
Prof. W. J. Zhang
Center of Super-Diamond and
Advanced Films (COSDAF)
Department of Physics and Materials Science
City University of Hong Kong
Hong Kong SAR, P. R. China;
Shenzhen Research Institute
City University of Hong Kong
Shenzhen P. R. China
E-mail: ;
Dr. J. Xu
School of Electronic Science and Applied Physics
Hefei University of Technology
Hefei 230009 , P. R. China
via quantum confi nement effects and sur-
face-area effects.
[ 18–20 ]
These advantages
offer new possibilities for a variety of new
solar cell structures with reduced cost and
improved effi ciency. It is expected that the
nanostructured cells, through band struc-
ture engineering of the nanomaterials and
new device design concepts, could achieve
a power conversion effi ciency (PCE) even
greater than the thermodynamic limit
of bulk single junction solar cells (33%
under 1 Sun illumination).
[ 21 ]
Among the nanostructured solar cells,
the DSSC has shown to be an important solar cell design
with considerable superiority given its simple device structure
as well as facile, scalable, and low cost fabrication.
[ 7–10 ]
How-
ever, the advances of DSSC techniques have been seriously
obstructed by stability and lifetime issues often caused by
degradation of organic dyes.
[ 22,23 ]
Semiconductor sensitizers,
in particular semiconductor quantum dots (QDs), have been
regarded as a superb alternative to replace dye sensitizers.
Compared to organic dyes, QDs in SSCs have: i) better stabili-
ties; ii) higher optical absorption coeffi cients; iii) lower costs
and iv) more tunable properties as they can be easily prepared
with controllable size, shape and composition at low costs.
[ 23–26 ]
Furthermore, QDs may also enable utilization of hot electrons
or generating multiple charge carriers with a single photon,
which could boost the theoretical PCE of SSCs by up to 44%
higher than the Shockley and Queisser limit (33%).
[ 27–30 ]
So
far, various QDs with their bandgaps covering a wide spectrum
range such as CdS,
[ 31–34 ]
CdSe,
[ 35–38 ]
CdTe,
[ 39,40 ]
CdS
x
Se
1− x
,
[ 41,42 ]
CdSe
x
Te
1− x
,
[ 43 ]
Zn
x
Cd
1− x
Se,
[ 44 ]
PbS,
[ 45–47 ]
PbSe,
[ 48,49 ]
Bi
2
S
3
,
[ 50,51 ]
In
2
S
3
,
[ 52–55 ]
InP,
[ 56,57 ]
InAs,
[ 58 ]
and CuInS
2
[ 59–61 ]
have been
employed in SSCs.
A number of metal oxide (MO) semiconductors such as
TiO
2
,
[ 35,43,62–64 ]
ZnO,
[ 32,36 ]
SnO
2
,
[ 65,66 ]
Zn
2
SnO
4
,
[ 67,68 ]
Nb
2
O
5
,
[ 69 ]
W
2
O
3
,
[ 70 ]
and In
2
O
3
,
[ 54,55 ]
have also been used as scaffolding for
hosting semiconductor sensitizers and to provide effi cient elec-
tron transport in SSCs. TiO
2
-nanostructure electron transporter
has been studied most comprehensively following its successful
application in DSSCs, and a record PCE beyond 6% has been
achieved in TiO
2
-based SSCs very recently.
[ 43,71 ]
However, as an
electron transporter, ZnO presents attractive properties which
in some aspects are superior to those of TiO
2
and has received
increasing research interest in the past few years. ZnO is a
direct bandgap semiconductor with similar band structure and
physical properties as those of TiO
2
. Signifi cantly, ZnO has the
Adv. Mater. 2014,
DOI: 10.1002/adma.201400403
2
www.advmat.de
www.MaterialsViews.com
wileyonlinelibrary.com
©
2014 WILEY-VCH Verlag GmbH & Co. KGaA, Weinheim
REVIEW
highest reported electron mobility and the highest conduction
band edge among various candidates to electron transporters
( Table 1 ) that would respectively benefi t electron transport with
less recombination and enable the possibility for a larger open-
circuit voltage ( V
OC
). As-synthesized ZnO shows n-type con-
ductivity due to oxygen vacancies and interstitial Zn which can
be further tuned by substituting Zn with Al, Ga, and In.
[ 84–86 ]
Moreover, the ease of crystallization and anisotropic growth of
ZnO allows the preparation of ZnO nanostructures in various
morphologies. In addition to its electronic, optoelectronic, and
photocatalytic applications, recent studies on ZnO-nanostruc-
ture-based SSCs have demonstrated some new concepts and
led to a better understanding of photo-electrochemical energy
conversion.
In this paper, we start with a brief discussion of the working
principle of SSCs and the factors determining the perfor-
mance of SSCs. Then we review the approaches for growing
ZnO nanostructures with controlled morphologies on trans-
parent conductive oxide (TCO) substrates, their post-treat-
ments for crystallinity and conductivity enhancements, and
the recently developed techniques for tuning the band struc-
ture of ZnO nanostructures and surface sensitization with
QDs and noble metal nanoparticles by different chemical and
physical methods. Next, we highlight a number of strategies
for improving the device performance including optical engi-
neering of ZnO morphologies for enhanced light absorption,
bandgap engineering and co-sensitization of QDs for improved
photoelectron injection and transport, and suppression of
charge recombination by surface passivation. We also address
the impacts of counter electrodes (CEs) and electrolyte on the
photovoltaic performance of SSCs. Finally, the challenges and
perspectives of SSCs based on ZnO nanostructures for future
practical applications are discussed.
2. Working Principle of SSCs
A typical SSC consists of three major components: a photoanode,
a counter electrode (CE), and electrolyte with redox couples. A
Jun Xu obtained his Ph.D.
degree from the City
University of Hong Kong in
2012, and then continued as
a senior research associate at
the Center of Super-Diamond
and Advanced Films
(COSDAF), City University of
Hong Kong. He joined Hefei
University of Technology in
2013, and currently works
as a Professor at the School
of Electronic Science and Applied Physics. His research
interest focuses on multinary chalcogenide photovoltaic
materials, semiconductor sensitized solar cells, and opto-
electronic devices.
Chun-Sing Lee obtained his
Doctor of Philosophy degree
in 1991 from the University
of Hong Kong. He then
moved to the University of
Birmingham to carry out
postdoctoral research with
the support of a Croucher
Foundation Fellowship. He
joined the faculty of the City
University of Hong Kong in
1994 and is currently a Chair
Professor in materials science. He co-founded COSDAF
in 1998 and is currently the center’s Director. Prof. Lee’s
main research interest is on surface and interface physics,
organic electronics and nanomaterials.
Wenjun Zhang obtained
his Doctor of Philosophy
degree in 1994 from Lanzhou
University. He was a postdoc
at the Fraunhofer Institute for
Surface Engineering and Thin
Films (1995 to 1997) and at
the City University of Hong
Kong (1997 to 1998). From
1998 to 2000, he worked as
a Science and Technology
Agency Fellow at National
Institute for Research in Inorganic Materials. He joined
CityU in 2000 again as a Senior Research Fellow. He is cur-
rently a Professor in Department of Physics and Materials
Science; and he is also a core member of COSDAF. His
research focuses on thin fi lms, semiconducting nanomate-
rials, surface science and modifi cation, and ions/materials
interactions.
Adv. Mater. 2014,
DOI: 10.1002/adma.201400403
Table 1. Structural and electronic characteristics of ZnO, SnO
2
and
TiO
2
.
ZnO TiO
2
SnO
2
Reference
Crystal Structure Wurtzite Rutile, Anatase Rutile [72–75]
Bandgap [eV] 3.2–3.4 3.0–3.2 3.6–3.8 [72–76]
Conduction Band
Minimum [eV]
−4.36 −4.41 −4.88
[77]
Electron Effective
Mass
0.26 9 0.275 [78–80]
Static Dielectric
Constant (
ε
⊥,//
)
9.26, 8.2 86, 170 14, 9 [81]
Electron Mobility
[cm
2
V
−1
s
−1
]
130–200 0.1–4 200–250 [72,80,82]
Effective Electron
Diffusion
Coeffi cient
[cm
2
s
−1
]
1.1 × 10
−4
(nanoporous
fi lm)
4.3 × 10
−4
(nanoporous
fi lm)
7.3 × 10
−5
(nanoporous
fi lm)
[83]
3
www.advmat.de
www.MaterialsViews.com
wileyonlinelibrary.com
©
2014 WILEY-VCH Verlag GmbH & Co. KGaA, Weinheim
REVIEW
schematic diagram showing the working principle of an ideal
SSC is shown in Figure 1 A. The photoanode in an SSC is typi-
cally constructed with a wide bandgap MO semiconductor (such
as TiO
2
, SnO
2
, and ZnO) scaffold coated with a layer of semi-
conductor sensitizer typically in thin fi lm or QDs formats. The
MO scaffolds also act as electron acceptor and transporter. Upon
photoirradiation, electron-hole pairs (excitons) are generated in
QDs. The excited electrons are then injected into the conduction
band (CB) of MO, leaving the QDs in their oxidized states. The
injected electrons in MO are collected by the TCO substrate (col-
lector) and transported through the external load to the CE. The
oxidized QDs are restored to their ground state through hole
scavenging by reduced species (e.g., S
2−
in the redox couples of
S
2−
/S
n
2−
) in the electrolyte. The oxidized species (S
n
2−
) diffuse to
the CE where they are reduced by electrons from the external
circuit, resulting in electrolyte regeneration.
[ 7,87,88 ]
Photovoltaic performance of a solar cell is typically gauged
with its PCE , short-circuit current density ( J
SC
), open-circuit
voltage ( V
OC
), and fi ll factor ( FF ). The PCE of a solar cell is
defi ned as the ratio of the actual maximum electrical power
generated to the incident optical power ( P
in
):
SC OC
in
PCE
FF J V
P
=
××
(1)
J
SC
can also be calculated using the equation:
SC
JqFIPCEd
∫
λλλ
() ()
=
(2)
where q is the electron charge, F (
λ
) is the incident photon fl ux
density. In Equation 2 , IPCE (
λ
) is the incident photon to charge
carrier effi ciency, also known as the external quantum effi -
ciency (EQE), which relates the ratio charge carriers collected
at electrodes to the number of incident photons, and IPCE (
λ
)
can be given by:
%
inj col ET
IPCE LHE LHE
φη
()
=××=×Φ
(3)
LHE is the light harvesting effi ciency by the photoanode in an
SSC, which depends on the extinction coeffi cient of QDs, the
amount of QDs loaded on MO surface, the optical absorption
range of QDs, and the optical path length of the incident light
within the photoanode.
ϕ
inj
is the electron injection effi ciency
from the photoexcited QDs to the MO, and
η
col
is the charge
collection effi ciency at the electrodes. A high
ϕ
inj
requires
appropriate energy band alignment at the MO/QD interfaces.
It has been reported that in DSSCs an over-potential (−Δ G ) of
approximately 0.2 V between the conduction band minimum
(CBM) of the MO and the lowest unoccupied molecular orbital
(LUMO) level of the dye, and a −Δ G of 0.3 V between the
highest occupied molecular orbital (HOMO) level of the dye
and the redox potential of the electrolyte are needed for effi cient
electron injection from dye to MO and regeneration of the oxi-
dized dye by hole scavenging.
[ 89 ]
Due to the similarity in struc-
ture and working mechanism of DSSCs and SSCs, these data
can be considered as a reference for SSCs.
Φ
ET
is the electron transfer yield, which is the product of
ϕ
inj
and
η
col
. In a SSC system,
Φ
ET
is seriously infl uenced by var-
ious recombination processes, including direct recombination
of photogenerated electron-hole pairs within the QD, interfacial
recombination of electrons in the CB of MO with holes in the
valence band (VB) of QD and oxidized species in the electrolyte
(electron capture), and interfacial recombination of electrons in
the CB of QD by electron capture in electrolyte.
[ 90,91 ]
Traps in
QDs and MO also play an important role in carrier recombina-
tion. In an SSC, the charge-transfer and -transport processes
must be much faster than recombination to obtain effi cient
photovoltaic performance.
V
OC
is determined by the potential different between the
quasi-Fermi level ( E
F
*) of electrons in the MO under illumina-
tion and the Fermi level ( E
F
) of the photoanode in dark (being
equal to the redox potential (E
redox
) of the electrolyte),
[ 92,93 ]
as
indicated in Figure 1 A. It can be expressed as:
ln
OC
B
Credox
Bc
C
V
kT
q
EE
kT
q
n
N
()
=−+
(4)
where k
B
is the Boltzmann constant, T is temperature, E
C
is the
CBM of the MO, n
c
is the free electron density in the CB of
the MO under illumination, and N
C
is the density of accessible
states in the CB of the MO. According to Equation 4 , either an
Adv. Mater. 2014,
DOI: 10.1002/adma.201400403
Figure 1. A) Schematic diagram showing the working principle of an SSC.
B) A simplifi ed equivalent circuit model of an SSC. R
TCO
include the sheet
resistance of the TCO and the TCO/MO contact resistance; R
CT(P)
and
C
µ
are the back electron transfer resistance and the capacitance at the
photoanode/electrolyte interface, respectively; R
CT(CE)
and C
CE
are the
charge transfer resistance and the capacitance at the CE/electrolyte inter-
face, respectively. Z
d
is the Warburg diffusion impedance of ions transport
in electrolyte. The sum of R
TCO
, R
CT(CE)
and Z
d
corresponds to the series
resistance ( R
s
) of the SSC.
4
www.advmat.de
www.MaterialsViews.com
wileyonlinelibrary.com
©
2014 WILEY-VCH Verlag GmbH & Co. KGaA, Weinheim
REVIEW
upward shift of E
C
or an increase in n
c
would give rise to an
enlarged V
OC
. It should be noted that n
c
is not only determined
by the photoelectron generation yield in the QDs, but also by
the electron injection rate from the QDs to the MO, which,
however, is strongly infl uenced by photoelectron recombination
in the QDs, and in particular at the MO/QDs, the QDs/electro-
lyte, and the MO/electrolyte interfaces.
To further analyze the dynamic information on charge trans-
port and recombination, Figure 1 B shows a simplifi ed elec-
trochemical impedance equivalent circuit of an SSC.
[ 94–97 ]
In
such an equivalent circuit, R
CT(P)
is the back electron transfer
resistance at the MO/QDs/electrolyte interfaces which display
a diode-like behavior. Combination of the sheet resistance of
TCO ( R
TCO
), the charge transfer resistance at the CE/electrolyte
interface ( R
CT(CE)
), and diffusion resistance of the redox species
in the electrolyte (Z
d
) gives the series resistance ( R
s
), i.e., R
s
=
R
TCO
+ R
CT(CE)
+ Z
d
.
[ 98,99 ]
The shunt resistance ( R
sh
) represents
the effects that divert photogenerated carriers from fl owing in
the external circuit. R
CT(P)
, which is associated with the trap-
ping and recombination of photogenerated carriers at inter-
faces of MO/QDs, MO/electrolyte, and QDs/electrolyte, could
be considered as a part of R
sh
. An ideal solar cell should have
a large R
sh
and a small R
s
to attain high values of J
SC
, V
OC
and
FF . Therefore, a larger R
CT(P)
and smaller R
CT(CE)
and R
TCO
are
desirable. R
CT(CE)
can be regarded as an indicator to reveal the
electrocatalytic activities of CE materials, which has signifi cant
infl uences on the J
SC
and the FF . A smaller R
CT(CE)
facilitates
electron transfer from the CE to the electrolyte for catalyzing
electrolyte regeneration, consequently results in less interfacial
recombination.
Overall, the performance ( J
SC
, V
OC
and FF ) of an SSC asso-
ciated with
Φ
CT
, n
c
, R
sh
, and R
s
is strongly infl uenced by the
surface trap states and the recombination of photoelectrons in
QDs and MO, and at MO/QDs, QDs/electrolyte, MO/electrolyte
and CE/electrolyte interfaces. The least charge recombination
in the processes of photoelectron generation, and charge sepa-
ration and transport is desired for pursuing high photovoltaic
performance. Therefore, suppression of carrier recombina-
tion by surface/interface engineering is an important key for
improving the PCE of SSCs.
3. Controllable Synthesis and Post-Treatments of
ZnO Nanostructures on TCO Substrates
ZnO has been shown both experimentally and theoretically to
be a promising electron transfer semiconductor for low-cost and
high-performance SSCs.
[ 16 ]
ZnO nanostructures offer a scaffold
for effective loading of QDs, and they play important roles in
light scatting, charge separation and transportation in SSCs.
These particular behaviors require growing ZnO nanostruc-
tures with controllable and tunable morphologies, sizes and
crystallinity which have direct effects on carrier transport and
photon trapping and scattering.
[ 100,101 ]
Various ZnO nanostruc-
tures have thus far been developed, including particles,
[ 102,103 ]
rods,
[ 104,105 ]
wires,
[ 106,107 ]
belts,
[ 108,109 ]
tubes,
[ 110–112 ]
rings,
[ 113,114 ]
sheets,
[ 115,116 ]
combs,
[ 117,118 ]
nails,
[ 119,120 ]
tetrapods,
[ 121,122 ]
branched structures
[ 123–126 ]
and hierarchical structures.
[ 127–129 ]
ZnO nanostructures have been synthesized by a variety of
approaches, e.g., the sol-gel method,
[ 130–132 ]
hydrothermal/
solvothermal growth,
[ 104–106 ]
physical or chemical vapor depo-
sition,
[ 107,108,122 ]
and electrochemical deposition.
[ 110,111 ]
For
applications in solar cells, two approaches, i.e., deposition of
pre-synthesized ZnO nanostructures and direct growth of ZnO
nanostructures on TCO substrates, have been mostly used.
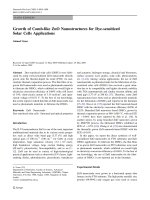
Figure 2 A shows different types of ZnO nanostructures on
TCO substrates, including disordered nanostructures (i and
ii), 1D nanoarrays (iii and iv), and hierarchical nanostructures
Adv. Mater. 2014,
DOI: 10.1002/adma.201400403
Figure 2. A) Scheme of ZnO nanostructures deposited on TCO substrates including disordered nanostructures (i and ii), 1D nanoarrays (iii and iv)
and hierarchical structures based on 1D nanoarrays (v and vi). B) Typical SEM images of the corresponding ZnO nanostructures on TCO substrates:
(i) Nanoparticles. Reproduced with permission.
[ 140 ]
Copyright 2013, The Royal Society of Chemistry. (ii) Disordered nanorods. Reproduced with permis-
sion.
[ 105 ]
Copyright 2013, The Royal Society of Chemistry. (iii) Array of nanorods. Reproduced with permission.
[ 110 ]
Copyright 2007, Elsevier. (iv) Array
of nanotubes. Reproduced with permission.
[ 110 ]
Copyright 2007, Elsevier. (v) Array of nanoforests. Reproduced with permission.
[ 125 ]
Copyright 2008,
American Chemical Society. (vi) Bilayer structures. Reproduced with permission.
[ 156 ]
Copyright 2009, Elsevier.
5
www.advmat.de
www.MaterialsViews.com
wileyonlinelibrary.com
©
2014 WILEY-VCH Verlag GmbH & Co. KGaA, Weinheim
REVIEW
based on 1D nanoarrays (v and vi). The typical SEM images of
these ZnO nanostructures are presented in Figure 2 B.
3.1. Coating of Pre-synthesized ZnO Nanostructures on TCO
Substrates
Various ZnO nanostructures (nanoparticles, nanorods, nano-
tetrapods and nanospheres, etc.) have been prepared ex situ by
different chemical and physical methods. The pre-synthesized
ZnO nanostructures were deposited on TCO substrates for
SSC applications (Panel i and ii of Figure 2 A) by the methods
including spin coating,
[ 131,132 ]
screen printing,
[ 133,134 ]
spray
coating,
[ 135,136 ]
and doctor-blade methods.
[ 137–141 ]
As a typical
example, ZnO nanoparticles can be synthesized by preparing
ZnO sols in a homogeneous alcoholic solution (such as meth-
anol, ethanol, propanol and butanol) containing zinc acetate
precursor and additives (such as alkali metal hydroxides, car-
boxylic acids, alkanolamines, alkylamines, acetylacetone and
polyalcohols).
[ 132 ]
Such sol containing ZnO nanoparticles, with
average diameter in the ten to several tens nanometers, have
been coated onto the TCO substrates by spin or dip coating
resulting in a change from liquid sol into solid wet gel. Drying
and heat treatments were then used to generate a porous-struc-
ture fi lm on the TCO glass substrate.
[ 132 ]
Besides the spin/dip coating, screen printing and doctor-blade
methods are also used to deposit pre-synthesized ZnO nano-
structures onto the TCO substrates. In general, a suffi ciently
viscous paste of ZnO nanostructures can be prepared by mixing
the nanostructures with organic binders, such as polyethylene
glycol,
[ 137 ]
acetyl acetone,
[ 138 ]
butanol
[ 139 ]
or mixture of ethyl cel-
lulose and terpineol.
[ 140,141 ]
The ZnO paste can then be spread
onto the TCO substrates by the screen printing process or the
doctor-blade method. Uniform fi lms of ZnO nanostructures
with controlled thickness and pore size on TCO substrates can
be obtained by suitable heat treatment to remove the residual
organic binders and solvents. These deposition approaches have
advantages on manipulating the morphology and size of the
pre-synthesized ZnO nanostructures. However, an additional
deposition process is required, which might also cause organic
contamination and affect the quality of the ZnO/TCO con-
tacts. Moreover, the electron transport pathway in photoanodes
of such ex situ prepared ZnO nanostructures is random and
winding, which increase the probability of carrier recombina-
tion due to the increased grain boundaries and diffusion length.
3.2. Direct Growth of 1D ZnO Nanoarrays on TCO Substrates
Compared with the coating of pre-synthesized ZnO nanostruc-
tures, direct growth of 1D ZnO arrays (nanorods, nanowires,
and nanotubes) on TCO substrates has obvious advantages for
photovoltaic applications. Firstly, the 1D ZnO nanorods/nanow-
ires (Panel iii of Figure 2 A) can provide a direct conduction path
in the interior of a crystal bulk for electron transport, reducing
their scattering at grain-boundaries. It has been shown that the
electron diffusivity in ZnO nanowires ( D
n
= 0.05–0.5 cm
2
s
−1
)
which is several hundred times larger than that ( D
n
≤ 10
−4
cm
2
s
−1
)
in semiconductor nanoparticle fi lms.
[ 9,142 ]
On the other hand,
the array structure can also enhance optical absorption due to
light scattering and trapping.
[ 143 ]
The direct growth of ZnO nanowire arrays on TCO sub-
strates is commonly performed by seed-assisted hydrothermal
process.
[ 9,144 ]
Compared with vapor based methods, the hydro-
thermal process can be conducted at low temperatures, which
decrease the possibility of fi lm cracking and nanowires sepa-
ration from the substrates, and enables ZnO nanowire growth
even on fl exible plastic substrates.
[ 145–147 ]
Also, it is possible to
control the density, length and diameter of the ZnO nanowires
via manipulating the reaction duration, precursor concentra-
tion, and number of repeated growth cycles.
[ 9 ]
In addition, ZnO
nanowires prepared by hydrothermal growth are generally free
of metal catalyst and other possible contaminants, which is ben-
efi cial for applications in electronic and optoelectronic devices.
The use of 1D ZnO nanowire arrays provide several advan-
tages related to charge separation and transfer as follows. The
formation of ZnO/QDs core/shell nanocables with type II
staggered energy band structure gives a stepwise energy band
alignment.
[ 148 ]
Electrons and holes would be preferably trans-
ferred across the interface in opposite directions to achieve the
formation of an excitonic charge separation state. The shells
in the nanocables can also provide effective passivation that
inhibits non-radiative recombination of percolated electrons in
1D ZnO with electrolyte and suppresses corrosion of the ZnO
cores by electrolyte. More signifi cantly, the core/shell nano-
cables have large-area interfacial heterojunction. As a result,
effi cient carrier separation occurs in the radial, instead of the
long axial direction, leading to a smaller carrier collection dis-
tance comparable to the minority carrier diffusion length.
[ 1,17,149 ]
While 1D ZnO nanowire arrays provide a base for effi cient
loading of QDs, the loading of QDs and the junction area can be
further increased by the use of arrays of ZnO nanotubes (panel
iv of Figure 2 A). In this case not only the outer surface but also
the inner surface of the tubes could be coated with sensitizers
for promoting light absorption.
[ 150–152 ]
She et al. reported the
synthesis of ZnO nanotube arrays using a two-step process, i.e.,
electrodeposition of ZnO nanorod arrays on TCO substrates, fol-
lowed by selective etching of ZnO nanorods to form ZnO nano-
tubes.
[ 110,111 ]
The formation of ZnO nanotubes was proposed
to be due to the defect-selective etching of the core of the ZnO
nanorods along the c axis by high concentration OH
−
or H
+
in
solutions. Enhanced photo-electrochemical properties were
demonstrated after ZnO nanorods were converted to ZnO nano-
tubes. While the CdS sensitized ZnO nanorods array showed a
photocurrent density of 7.00 mA cm
−2
at 0 V vs saturated cal-
omel electrode (SCE), the CdS sensitized ZnO nanotube arrays
increased the photocurrent density to 10.64 mA cm
−2
.
[ 150 ]
Yang et
al. also observed an obvious increase of J
SC
from 1.86 mA cm
−2
for the CdS sensitized ZnO nanorod SSC to 4.07 mA cm
−2
for
the CdS sensitized ZnO nanotube SSC under 1 Sun illumina-
tion, correspondingly PCE increased from 0.33% to 0.87%.
[ 151 ]
3.3. Growth of 3D Hierarchical ZnO Nanostructures on TCO
Substrates
To maintain the merit of 1D nanostructure for providing
direct electron conduction pathway and meanwhile to further
Adv. Mater. 2014,
DOI: 10.1002/adma.201400403
6
www.advmat.de
www.MaterialsViews.com
wileyonlinelibrary.com
©
2014 WILEY-VCH Verlag GmbH & Co. KGaA, Weinheim
REVIEW
increase the surface area of ZnO nanostructure for light har-
vesting and QD loading, a vertically-aligned branched-nanowire
“forest” (Panel v of Figure 2 A) has been synthesized. The ZnO
“nanoforests” were typically obtained by following three steps:
i) growth of ZnO nanowires arrays on TCO substrates, ii) depo-
sition of a ZnO seeding layer on the ZnO nanowire surface,
and iii) growth of branched nanorods on the surface of ZnO
nanowires.
[ 123–126,153,154 ]
Bilayer architectures have also been used for SSC aplica-
tions; these consist of ZnO nanorod array as the bottom layer
and ZnO nanostructures (such as nanofl owers, nanospheres,
and nano-tetrapods) as the upper layer.
[ 155–157 ]
In the bilayer
fl ower-rod structure illustrated in Panel vi of Figure 2 A, an
array of ZnO nanorods with a uniform density is fi rst prepared
on a TCO substrate followed by the growth of ZnO nanofl owers
on the top surfaces of the nanorods. The top layer increases the
roughness factor (RF) of the ZnO photoanode and consequently
improves the effective loading density of QDs and overall PCE
of the fabricated SSCs.
3.4. Post-Treatment of ZnO Nanostructures
Among the mentioned synthesis methods, the solution
approach is of considerable interest since it is environmen-
tally friendly, and has low production cost and low synthesis
temperature. However, the ZnO nanostructures prepared at
low temperatures especially by the solution methods are typi-
cally featured with high defect densities, low conductivities,
and probable residual organic contamination on their surfaces.
Various post-treatments, such as plasma modifi cation,
[ 36,158,159 ]
UV irradiation,
[ 160 ]
and in particular annealing under dif-
ferent conditions,
[ 161–165 ]
have been demonstrated to be feasible
approaches enabling improved crystallinity, increased conduc-
tivity, and/or enhanced stability of ZnO nanostructures. For
example, exposure of ZnO nanowire arrays to oxygen plasma
was shown to be effective for removing the surface con-
tamination and thus enhancing the QDs adsorption (as dis-
cussed in more details in Section 4.1.1).
[ 36 ]
The donor density
(5.19 × 10
19
cm
−3
) of the as-grown ZnO nanorods could be
increased to 1.79 × 10
20
cm
−3
by hydrogen plasma treatment and
decreased to 1.65 × 10
19
cm
−3
by oxygen plasma treatment.
[ 158 ]
Annealing has been demonstrated to be a powerful tool
for improving the crystallinity and thermal stability of as-
grown ZnO nanostructures; and annealing parameters, e.g.,
atmosphere, temperature, and duration, have been shown to
have signifi cant infl uences on the properties of ZnO nano-
structures.
[ 161–165 ]
Zhang and Li et al. reported that annealing
in air could signifi cantly improve the crystal structure and
reduce defects but had little effect on hole-trapping. In con-
trast, annealing in hydrogen atmosphere leads to a reduction
in hole-trapping due to the passivation of Zn vacancy trap
states. As a consequence, samples fi rst annealed in air fol-
lowed by hydrogen treatment showed decreased hole-trapping
and increased conductivity.
[ 163 ]
The shape and intensity of
defect photoluminescence emission from ZnO were founded
to depend strongly on the annealing atmosphere and temper-
ature.
[ 161,164 ]
Cabot and co-workers reported recently that the
ZnO nanowires annealed in Ar exhibited a four-fold decrease
in electrical resistivity (15.6 Ω cm down to 3.6 Ω cm). The
improved conductivity was attributed to the reduced negatively
charged oxygen-containing species (CO
2
, O
2
−
, O
2−
, O
−
, OH
−
, or
H
2
O) adsorbed on the ZnO surface and the higher concentra-
tion of oxygen vacancies induced during argon Ar annealing.
As a result, the DSSCs composed of Ar-annealed ZnO nanow-
ires exhibited 50% increase in J
SC
, and yielded 30% enhance-
ment in PCE as compared with the cells based on air-annealed
ZnO nanowires.
[ 165 ]
Furthermore, doping of ZnO nanostructures could be
achieved by annealing in atmospheres containing gases such as
NH
3
.
[ 166,167 ]
Controllable N concentrations (atomic ratio of N to
Zn) up to ca. 4% was achieved by varying the annealing time.
IPCE studies revealed that the ZnO:N nanowire arrays yielded
an obvious increase of photoresponse in the visible region com-
pared to the undoped ZnO nanowires. An increase of photocur-
rent density by one order of magnitude and a photoconversion
effi ciency of 0.15% at an applied potential of +0.5 V (vs Ag/
AgCl) were obtained for the ZnO:N nanowires in the applica-
tion for water splitting.
[ 166 ]
It should be noted that the post-treatments of ZnO and their
impact on the applications of ZnO in electronic and optoelec-
tronic devices,
[ 159 ]
DSSCs,
[ 165 ]
and water splitting
[ 166,167 ]
have
been extensively studied. However, there have been only lim-
ited reports for the ZnO nanostructures employed in SSCs.
Further studies are still needed to explore the benefi cial effects
of post-treatments on the performance improvement of ZnO
nanostructure based SSCs.
4. Surface Sensitization of ZnO Nanostructures
While ZnO is an excellent electron transporting material, it
cannot effectively harvest visible light due to its wide bandgap.
Therefore, surface sensitization of ZnO nanostructures is
essential to enhance the light absorption capability, and carrier
generation and separation of ZnO-based photovoltaic devices.
Thus far, various chemical and physical technologies have been
developed to modify the surface of ZnO nanostructures with
QDs and noble metal nanoparticles.
4.1. Sensitization with QDs Using Solution Methods
Loading of suitable narrow bandgap QDs on the surfaces of
ZnO nanostructures is an effective way to enable harvesting
of visible light. Two main strategies are mostly employed to
decorate nanostructured ZnO with QDs: i) ex situ growth
of colloidal QDs and subsequent attachment of the pre-
synthesized QDs to the surface of ZnO nanostructures via
bifunctional linker molecules;
[ 36,143,168–172 ]
ii) in situ growth
of QDs on the ZnO surface by chemical reaction of ionic spe-
cies using the methods including chemical bath deposition
(CBD),
[ 32,152,173–175 ]
successive ionic layer adsorption and reac-
tion (SILAR),
[ 115,151,176–181 ]
ion-exchange,
[ 48,182–187 ]
and electro-
chemical deposition.
[ 146,150,188–194 ]
In comparison with ex situ
process, the in situ approach involve direct nucleation and
growth of QDs on ZnO surface, typically leading to improve-
ments in effective loading and uniform coverage of QDs;
Adv. Mater. 2014,
DOI: 10.1002/adma.201400403
7
www.advmat.de
www.MaterialsViews.com
wileyonlinelibrary.com
©
2014 WILEY-VCH Verlag GmbH & Co. KGaA, Weinheim
REVIEW
however, it increases the diffi culties in controlling the size dis-
tribution of the deposited QDs.
4.1.1. Attachment of Pre-synthesized QDs by Molecular Linkers
The pre-synthesized QDs are typically attached to the surface
of ZnO nanostructures using bifunctional molecular linkers.
Commonly used linkers include thioglycolic acid (TGA), mer-
captopropionic acid (MPA), mercaptoalkanoic acid (MAA),
methoxybenzoic acid (MBA), and cysteine (CYS), as shown in
the right column of Figure 3 . A typical feature of these linkers
is that they bear simultaneously carboxylate and thiol functional
groups.
[ 6 ]
The carboxylic acid group (–COOH) and the thiol
group (–SH) can respectively bind to ZnO and metal chalco-
genide QDs, respectively. Other linker molecules such as oxalic
acid (OA), malonic acid (MA), hexandithiol (HDT), thioacetic
acid (TAA), and thiolactic acid (TLA) have also been reported
for decorating QDs on ZnO nanostructure surface.
[ 6,168,169 ]
The effect of molecular linkers has been studied taking the
assembly of pre-synthesized PbS QDs on ZnO porous fi lms as
an example.
[ 168 ]
The ZnO fi lms, with a thickness between 300
and 400 nm, were prepared by spin coating ZnO nanoparticles
onto ITO (ITO-ZnO) substrates. After annealing, the ITO-ZnO
substrates were put into a solution of molecule linker (e.g., OA,
MA, TAA, TGA, MPA, and HDT) in tetrahydrofuran (THF)
for surface treatment. Then the linker modifi ed ITO-ZnO
substrates were immersed in a THF solution containing pre-
synthesized PbS QDs. A clear color change from almost trans-
parent to a distinct brown coloration was observed, while there
was no change discernible by eye on the ITO-ZnO substrates
without linker modifi cation. The degree of the coloration could
provide a visual aid to evaluate the amount of PbS adsorbed on
the surface. The gained absorption spectrum of the ITO-ZnO-
linker-PbS substrate showed a weak absorption shoulder in the
NIR, which matched well with the solution phase absorption of
PbS nanoparticles.
The attachment of colloidal QDs through molecular linkers
enables the use of QDs with precise control of their shape and
size of the QDs. This technique has achieved great success in
high performance SSCs using TiO
2
mesoporous fi lms as photo-
anodes.
[ 37,43,71 ]
However, it still faces diffi culties in achieving
uniform coverage and suffi cient loading of QDs onto the ZnO
nanostructured photoanode, probably due to the large dimen-
sion and different surface chemical states of ZnO nanostruc-
tures, which limits their light harvesting and corresponding
photovoltaic performance.
[ 36,169,170 ]
On the other hand, surface
states of ZnO, such as surface charging, dangling bonds, and
surface contamination, seriously affect the attachment of col-
loidal QDs. Therefore, treatment of ZnO surface is generally
required to improve QD loading. Aydil et al. reported that
enhanced coverage of colloidal MPA-capped CdSe QDs on ZnO
nanowire surface can be achieved by exposing the ZnO nanow-
ires to oxygen plasma.
[ 36 ]
The treatment removed the surface-
bound contaminants (surface hydroxyl and hydrocarbon
groups) which prevented the colloidal QDs from attaching to
the ZnO nanowire surface through the carboxyl group. It was
demonstrated that oxygen plasma treatment of ZnO nanowires
increased J
SC
to 2.1 mA cm
−2
and PCE to 0.4%, which were
more than one order of magnitude higher as compared with
those of the SSC assembled using untreated ZnO nanowires.
The molecular linkers serve as a binding bridge between
ZnO and QDs; however, they also act as in-series component in
the charge transfer processes (Figure 3 ). The linker molecules
impose a barrier potential between ZnO and QDs, which has
to be overcome for electron transfer.
[ 195 ]
Therefore, the nature
of the molecular bridges is an important issue to be concerned
for electron transfer processes. Much effort has been devoted
to optimizing the photoelectron injection rates and photo-
electrochemical responses of the cells by changing the linker
molecules, particularly by varying the alkyl chain length and
by selecting molecules ending with different acid and/or thiol
groups as the attachment moieties.
[ 169,195 ]
4.1.2. CBD of QDs on ZnO Surface
CBD is one of the most commonly used methods for direct
growth of QDs onto ZnO nanostructures. In this one-pot syn-
thesis method, the ZnO nanostructures are immersed in an
intended QD precursor solution for certain duration. For SSC
applications, effective loading and homogeneous coverage
of QDs on ZnO surface are desired, but aggregation of QDs
should be minimized to enhance light absorption and reduce
charge recombination ( Figure 4 A,B). Aggregation of QDs on
ZnO surface (Figure 4 A) increases the diffusion length and the
probability of recombination of photogenerated electrons, and
thus results in a reduced injection rate of photoelectrons into
ZnO.
[ 172,173 ]
CdS QDs have been deposited on ZnO nanowires in a
chemical bath solution of CdSO
4
, thiourea, and ammonia. It
was shown that the quality of QDs depends strongly on the pH
value of the solution, the precursor concentration, its reaction
temperature, and the reaction duration in CBD process. Reac-
tion in dilute solutions improved the coverage of CdS QDs on
ZnO surface, but led to reduced QDs loading. On the other
hand, prolonging the reaction duration was revealed to induce
aggregation of the CdS QDs.
[ 175 ]
Adv. Mater. 2014,
DOI: 10.1002/adma.201400403
Figure 3. Schematic illustration of QDs sensitized ZnO by molecular
linker.
8
www.advmat.de
www.MaterialsViews.com
wileyonlinelibrary.com
©
2014 WILEY-VCH Verlag GmbH & Co. KGaA, Weinheim
REVIEW
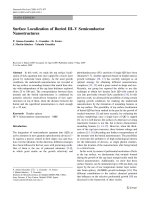
Sulfurization of ZnO nanostructure surface has been
shown to enable a signifi cant improvement of CdS QDs cov-
erage.
[ 175,185 ]
The SEM images in Figure 4 C and D depict CdS
QDs synthesized in ammonia/thiourea bath on the surfaces
of ZnO nanorods without and with sulfi de treatment, respec-
tively. By converting the surfaces of ZnO to ZnS with an alka-
line sulfi de solution treatment, a CdS QD layer with thick-
nesses of ca. 10 nm was uniformly covered on ZnO nanorod
surface. Similar results were also observed in the deposition
of CdSe QDs on ZnO nanorods by CBD. By incorporating sur-
face sulfurization, the coverage of CdSe QD layer was obviously
improved, as shown in Figure 4 E and F.
4.1.3. SILAR Method for Depositing QDs on ZnO Surface
The SILAR method is another approach used for in situ depo-
sition of QDs on nanostructured ZnO surfaces by alternative
adsorption of cations and anions in respective solutions.
[ 176,177 ]
The growth of QDs is controlled by tuning the number of
cycles, solvents and precursor concentrations. For CdS QD
deposition, the SILAR method involves successive immersion
of ZnO nanostructure in solutions of Cd
2+
and S
2−
ions and
rinsing between dips ( Figure 5 A) while the desired CdS thick-
ness is obtained by repeating the processes as needed. The
correlations between the number of SILAR cycles and the thick-
ness of CdS QD layer can be demonstrated through high-reso-
lution TEM analyses, as shown in Figure 5 B. In an ideal SILAR
process, the thickness should increase with cycling number,
regardless of the sample surface area and dipping time.
[ 176 ]
The
absorption spectra of the ZnO/CdS core/shell nanowire arrays
with different CdS shell thicknesses are presented in Figure 5 C.
An absorption edge shorter than 420 nm is observed for the
bare ZnO nanowire array, and it continuously red shifted to the
visible light region with increasing number of SILAR cycles.
Such cycle-dependent layer-by-layer growth in the solution-
phase SILAR process has been shown to be a powerful thin-
fi lm growth technique in current semiconductor processing.
During the SILAR process, the ZnO surface is fi rst converted
to ZnS by ion exchange in sulfi de solution. Therefore, similar
to the CBD approach on a sulfi de-treated ZnO surface,
[ 175,185 ]
the SILAR method typically is characteristic with an even cov-
erage of QDs on ZnO nanostructures. Comparing with CBD,
the SILAR process typically gives a better control on the thick-
ness uniformity of the QD layer, but many repeating cycles are
required to achieve suffi cient QD layer thickness.
4.1.4. Ion Exchange for ZnO Surface Sensitization
Surface sensitization of ZnO nanostructures by ion exchange
technique is based on the large difference in solubility product
constant ( K
sp
) between the precursor and the target semicon-
ductors. The K
sp
is the equilibrium constant for a chemical
reaction in which an ionic compound dissolves to produce its
ions in a solution. An ionic compound with a smaller K
sp
is
more diffi cult to be dissolved in a solution than that with a
lager K
sp
. For example, in an ion exchange reaction, AB + C
−
= AC + B
−
, when the K
sp
value of target semiconductor (AC)
is suffi ciently smaller than that of precursor semiconductor
(AB), the C
−
ions in solution are driven to replace the B
−
ions
in precursor semiconductor, leading to the formation of target
semiconductor (AC) on the surface of precursor semiconductor
(AB).
[ 196 ]
In ion exchange reactions, ZnO can be easily converted to
ZnS by surface sulfurization or to ZnSe by surface seleniz-
ation due to the much larger K
sp
value of Zn(OH)
2
(10
−16.5
) with
respect to those of ZnS (10
−23.8
) and ZnSe (10
−25.4
).
[ 197–200 ]
For
example, the following reaction takes place in the surface sele-
nization process:
ZnO Se H O ZnSe 2OH
2
2
K
++ +
−−
(5)
A large equilibrium constant of the reaction:
[OH ]
[Se ]
[Zn ][OH ]
[Zn ][Se ]
(Zn(OH) )
(ZnSe)
10
2
2
22
22
sp 2
sp
8.9
K
K
K
== = =
−
−
+−
+−
(6)
indicates that the reaction is spontaneous.
Adv. Mater. 2014,
DOI: 10.1002/adma.201400403
Figure 4. Schematic transport path of photogenerated electron in ZnO
nanorod-based photoanodes with (A) aggregated, and (B) uniformly cov-
ered QD sensitization layer. SEM images showing the effect of sulfi de
treatment on ZnO surface coverage by (C,D) CdS from ammonia/thio-
urea bath, and (E,F) CBD CdSe. Left column images (C,E) are untreated
ZnO rods, right column images (D,F) show sulfi de-treated ZnO rods. The
insets are higher magnifi cation backscattered images. A–F) Reproduced
with permission.
[ 175 ]
Copyright 2010, American Chemical Society.
9
www.advmat.de
www.MaterialsViews.com
wileyonlinelibrary.com
©
2014 WILEY-VCH Verlag GmbH & Co. KGaA, Weinheim
REVIEW
ZnSe (or ZnS) has a relatively larger K
sp
value as com-
pared with some other metal chalcogenides (selenides and
sulfi des), such as CdS (10
−26.1
), CdSe (10
−35.2
), Ag
2
S (10
−49.2
),
Ag
2
Se (10
−63.7
), CuS (10
−35.2
), CuSe (10
−48.1
), PbS (10
−27.1
),
PbSe (10
−42.1
), HgS (10
−52.4
), HgSe (10
−59
), CoS (10
−24.7
), CoSe
(10
−31.2
), NiS (10
−24
), NiSe (10
−32.7
), In
2
S
3
(10
−73.24
) and Sb
2
S
3
(10
−92.8
). Therefore, ZnSe (or ZnS) can further act as precursors
to prepare more stable metal chalcogenides, obtaining a series
of chalcogenide semiconductor sensitized ZnO photo anodes.
By successive anion and cation exchange reactions, single or
double shelled semiconductor sensitizers could be coated on
ZnO surface, e.g., arrays of ZnO/ZnSe/CdSe trilayer nano-
cables
[ 183 ]
and bilayer ZnO/Zn
x
Cd
1– x
Se nanocables.
[ 184 ]
The ion exchange method could gen-
erate a continuous and uniform layer of QD
shell on ZnO surface. Figure 6 A illustrates
the synthesis process of copper indium
selenide (CIS) shells on ZnO nanorod sur-
faces by successive ion exchange.
[ 182 ]
In
the fi rst stage, the ZnO nanorods arrays
were grown on TCO substrates by the seed-
assisted growth method as discussed above.
The Se
2−
solution is prepared by reducing
Se powder with NaBH
4
in distilled water.
As the K
sp
of Zn(OH)
2
is much larger than
that of ZnSe, the ZnO nanorod array can
be used as a sacrifi cial template to synthe-
size more stable ZnSe by anion exchange
(Equation 5 ). Upon immersing a ZnO
nanorod array into a Se
2−
ion solution, ion
exchange reaction between Se
2−
and ZnO
takes place, which produces a continuous
ZnSe layer on the surface of ZnO nanorods
resulting in ZnO/ZnSe core/shell nanoca-
bles. The ZnO/ZnSe core/shell nanocable
arrays are then immersed in a Cu
2+
ion solu-
tion. Due to the smaller K
sp
value of CuSe
compared to that of ZnSe, Cu
2+
ions replace
Zn
2+
ions in ZnSe shells to form CuSe
shells, leading to the formation of ZnO/
CuSe core/shell nanocables. Finally, CIS is
synthesized by reacting CuSe shells with
In
3+
via a polyol reduction process. In this
step, the ZnO/CuSe core/shell nanocable
array is immersed in In
3+
ion contained tri-
ethylene glycol (TEG) solvent. The growth of
CIS shell is accompanied with the gradual
dissolution of ZnO cores, and prolonging
the reaction time may lead to complete
etching of ZnO cores and the formation of
CIS nanotube array. The TEM image and
corresponding electron energy loss spectro-
scopic (EELS) elemental mappings in Figure
6 B further confi rm the uniform thickness of
the nanotube and homogeneous distribution
of Cu, In and Se throughout the tube wall.
It is interesting to note that subjecting ZnO/
ZnSe and ZnO/CuSe nanocable arrays to
acidic etching could be used to prepare ZnSe
and CuSe nanotube arrays, respectively.
4.1.5. Electrochemical Deposition of Semiconductor Sensitizers
Various semiconductors such as CdS,
[ 188–190 ]
CdSe,
[ 191,192 ]
CdTe,
[ 193,194 ]
and PbSe,
[ 49 ]
have been deposited on ZnO
nanowire/nanorod arrays using electrochemical deposition.
The electrochemical deposition is usually carried out in a three-
electrode electrochemical workstation. Standard saturated
calomel electrode (SCE) and Pt foil are used normally as the
reference and counter electrodes, respectively, while the ZnO
nanostructures grown on TCO substrate used as the working
Adv. Mater. 2014,
DOI: 10.1002/adma.201400403
Figure 5. A) Schematic diagram showing the SILAR deposition processes of CdS QDs on ZnO
nanowires. A) Reproduced with permission.
[ 176 ]
Copyright 2013, Elsevier. B) HRTEM observa-
tions of CdS QD layer thickness upon cycle numbers in SILAR process. C) UV–vis absorption
spectra of the as-prepared ZnO nanowire and the ZnO/CdS core/shell nanowire arrays, where
the shell thickness increases with the number of SILAR cycles (5, 10, 15, 30, 60, 90, 120 cycles).
The photoanodes were grown on Ti foil substrates. B,C) Reproduced with permission.
[ 177 ]
Copy-
right 2009, The Royal Society of Chemistry.
10
www.advmat.de
www.MaterialsViews.com
wileyonlinelibrary.com
©
2014 WILEY-VCH Verlag GmbH & Co. KGaA, Weinheim
REVIEW
electrode. The electrolyte selection is a key factor for the elec-
trochemical deposition of QDs and a critical prerequisite is that
the electrolyte does not etch the ZnO nanostructures. The elec-
trochemical deposition is usually performed in galvanostatic
or potentiostatic mode. In contrast to the deposition methods
mentioned above, electrical current is the driving force for pro-
cessing the deposition; the deposition rate and quality of QDs,
however, are also controlled by the operation mode, precursor
concentration in electrolyte, and deposition duration.
Li et al. reported the electrochemical synthesis of ZnO/CdTe
core-shell nanocables.
[ 193 ]
The deposition of CdTe was performed
at a fi xed potential of −1.0 V vs SCE. Figure 7 shows a single
ZnO/CdTe nanocable, revealing a clear ZnO/CdTe core-shell
structure. It should be pointed out that complete coverage of the
ZnO core by a CdTe shell was achieved without any interfacial
void formation. CdTe is a promising photovoltaic material with
advantages of high optical absorption coeffi cient (ca. 10
4
cm
−1
)
and a band gap of ca. 1.5 eV. The ideal absorption properties
of the CdTe shell and the type II staggered band alignment
(Figure 7 E) would make the ZnO/CdTe core/shell nanocables a
promising photoelectrode for solar energy conversion.
4.2. Sensitization of ZnO Using Vapor Phase Methods
In addition to the above chemical solution approaches, various
vapor phase methods, including chemical vapor deposition
(CVD), pulsed laser deposition (PLD), thermal evaporation,
and sputtering, have been employed to deposit narrow bandgap
semiconductors onto ZnO nanostructures.
[ 201–207 ]
As compared
with the chemical solution methods, vapor phase methods typi-
cally need elevated temperatures to grow the semiconductor
sensitization layers resulting in high crystalline quality and even
epitaxial growth of the sensitizers on the ZnO nanostructure
surfaces. Due to the reduced defect density, epitaxial growth of
high quality semiconductors on ZnO surface could decrease
the extent of non-radiative recombination and carrier scattering
loss particularly at the ZnO/sensitizer interface, and benefi t the
charge separation and transport.
[ 205,207 ]
Nevertheless, much less
work has been reported on gas phase synthesis of sensitizer on
Adv. Mater. 2014,
DOI: 10.1002/adma.201400403
Figure 6. A) Ion exchange processes for the formation of ZnO-based
nanocables and corresponding nanotubes. B) TEM image of a CIS nano-
tube and the corresponding Cu, In, and Se elemental EELS mappings of
the same region. A,B) Reproduced with permission.
[ 182 ]
Copyright 2010,
American Chemical Society.
Figure 7. A) TEM image of a single ZnO/CdTe nanocable. B) Elemental
profi le obtained from STEM-EDX showing the distribution of the com-
positional elements (Zn, O, Te, and Cd) along the radial direction of the
nanocable (indicated by the red arrow in panel (A)). C,D) HRTEM image
and SAED pattern taken from the same ZnO/CdTe nanocable. E) Sche-
matic of the operation of ZnO/CdTe nanocable grown on ITO substrate
for SSC application. A–E) Reproduced with permission.
[ 193 ]
Copyright
2010, American Chemical Society.
11
www.advmat.de
www.MaterialsViews.com
wileyonlinelibrary.com
©
2014 WILEY-VCH Verlag GmbH & Co. KGaA, Weinheim
REVIEW
ZnO nanostructures, mainly due to the more expensive and
complicated high-vacuum deposition facilities usually required
by vapor phase methods.
CVD technology has been widely used for synthesizing nano-
materials and surface coating for electronic and optoelectronic
applications. This method provides a great controllability on
the composition, morphology, and crystallinity of the materials
deposited by tuning the reactive gas composition, pressure, and
substrate temperature. Recently, much effort has been devoted
to synthesizing nanostructured ternary chalcogenide alloys
with controllable composition using the CVD approach. ZnO/
CdS
x
Se
1−
x
,
[ 201 ]
ZnO/Zn
x
Cd
1−
x
Se,
[ 44,202 ]
and ZnO/ZnS
x
Se
1−
x
[ 204 ]
core/shell nanocables with tunable shell composition have been
successfully synthesized. Park et al. reported CVD synthesis of
ZnO/CdS
x
Se
1– x
core/shell nanocables with tunable shell com-
position in a full range (0 ≤ x ≤ 1) where the ZnO nanorod
substrates were placed downstream apart from the CdS/CdSe
mixed powder precursors in a CVD reactor.
[ 201 ]
Thickness of
the deposited CdS
x
Se
1− x
shell was then controlled by adjusting
the growth temperature or duration. Figure 8 A shows a TEM
image of a ZnO/CdS
0.5
Se
0.5
core/shell nanocable with a shell
thickness of 50 (±10) nm. The lattice-resolved image of the
interface region revealed a single-crystalline wurtzite shell with
the (001) planes parallel to the ZnO (001)
planes, as shown in Figure 8 B; and the Fast
Fourier Transform (FFT) and electron diffrac-
tion (ED) pattern also verifi ed the alignment
of [0001] CdS
0.5
Se
0.5
with [0001] ZnO (insets).
Energy dispersive spectroscopic (EDS) map-
ping in Figure 8 C and the line-scanning in
Figure 8 D demonstrated the formation of
ZnO/CdS
0.5
Se
0.5
core/shell structure with Zn
confi ned in the core only. The stoichiometry
of the ternary CdS
x
Se
1– x
shell could be well
controlled by changing the ratio of CdS and
CdSe source powder. Measurements on the
composition-dependent optical absorption
reveal a decrease in bandgap with increasing
Se content.
[ 201 ]
The ZnO/CdS nanocables
exhibited a bandgap of 2.35 eV with CdS
shell thickness of ca. 50 nm, and the ZnO/
CdS
0.5
Se
0.5
nanocables showed a red shift
to 1.95 eV, matching well to that of the bulk
CdS
0.5
Se
0.5
. The bandgap of ZnO/CdSe nano-
cables was estimated to be 1.66 eV.
Pulsed laser deposition (PLD) is a physical
deposition technique that uses a high power,
short-pulse laser beam focused on the surface
of the source material (target). This material
is thus vaporized from the target in the form
of a plasma plume which can then deposit as
a thin fi lm onto a substrate in an ultra-high
vacuum or in the presence of a back-fi lled,
inert or reactive gas. The PLD processing
parameters include the target-to-substrate
distance, deposition duration, pulse rep-
etition frequency, and laser energy density.
Wang et al. reported the use of PLD tech-
nique for coating ZnSe on ZnO nanowire
arrays.
[ 205 ]
The TEM image of the resulting
ZnO/ZnSe core/shell nanocable, Figure 9 A, indicates the ZnSe
shell can grow on the ZnO nanowire surface with a thickness
of about 5–8 nm in the radial direction. A sharp interface of the
ZnO/ZnSe core/shell nanocable is confi rmed by the HRTEM
image in Figure 9 B, which reveals that ZnO and ZnSe present
Wurtzite (WZ) and zinc blende (ZB) crystalline structures,
respectively. Figure 9 C and D show the FFT patterns of the (WZ)
ZnO core and the (ZB) ZnSe shell, with zone axes [2–1–10]
and [011], respectively, which further confi rms the epitaxial
growth. The spatial distributions of the atomic composition
across the ZnO/ZnSe core/shell nanocable are shown in the
EDS line-scan analysis (marked by a line in Figure 9 A), showing
the homogeneous coating of the ZnO nanowire (Figure 9 E).
4.3. Sensitization with Noble Metal Nanoparticles
Noble metal nanoparticles (NPs), such as Au and Ag, have also
been decorated on ZnO NWs to enhance light absorption based
on localized surface plasmon resonance (LSPR) effects.
[ 208–210 ]
LSPR is originated from the interaction of incident light with
electrons in the metal NPs, and it has been extensively studied
Adv. Mater. 2014,
DOI: 10.1002/adma.201400403
Figure 8. A) TEM image of a ZnO/CdS
x
Se
1− x
( x = 0.5) core/shell nanorod. B) HRTEM image
of the ZnO/CdS
x
Se
1− x
interface region, showing the epitaxial growth single-crystalline wurtzite
CdS
x
Se
1− x
( x = 0.5) on ZnO. The corresponding FFT and ED patterns confi rm the parallel align-
ment of the [0001] CdS
x
Se
1− x
( x = 0.5) with [0001] ZnO (insets). C) EDS mapping of the ZnO/
CdS
x
Se
1− x
( x = 0.5) core/shell nanocable. D) Line-scan of the ZnO/CdS
x
Se
1− x
( x = 0.5) core/shell
nanocable, showing Zn and O elements in the core, and Cd, S, and Se elements in the shell.
A–D) Reproduced with permission.
[ 201 ]
Copyright 2010, American Chemical Society.
12
www.advmat.de
www.MaterialsViews.com
wileyonlinelibrary.com
©
2014 WILEY-VCH Verlag GmbH & Co. KGaA, Weinheim
REVIEW
in enhancement of Raman scattering, biomedicine, and solar
cells.
[ 211–213 ]
The plasmon resonance wavelength depends
strongly on the size and composition of the material as well
as on its local dielectric environment,
[ 211 ]
which give us oppor-
tunity to design and tailor the optical properties of the noble
metal NPs sensitized photoanodes.
There have been two major approaches for chemical coating
of noble metal NPs on ZnO nanostructure: ex situ growth by
assembling the pre-prepared metal nanoparticles and in situ
growth of the metal nanoparticles by chemical deposition. Au
NPs typically served as the most commonly used plasmonic
material to reveal plasmon induced effects on ZnO, because
its resonant wavelength is in the visible region,
[ 211,212 ]
which
extended the wavelengths region absorbed by ZnO. Some
research groups reported Au NPs decorated ZnO nanostruc-
tures by directly reducing HAuCl
4
solution.
[ 208,214,215 ]
On the
other hand, pre-prepared Au NPs with controlled size and
shape could be attached to ZnO nanostructures by using a
bifunctional molecular linker.
[ 209,216 ]
Recent studies showed that Au NPs coated ZnO nanorod
arrays present distinct chemical and physical properties, as com-
pared with uncoated ZnO nanorods arrays, due to enhanced
separation of excited electron-hole pairs. For example, a
photovoltaic device with a single ZnO nanorod decorated with
Au NPs has been reported to show a high photocurrent of
22.6 µA at a bias of 1.0 V under UV illumination, showing the
photocurrent increased nearly 1.5 times in comparison with a
device using a pristine ZnO nanorod.
[ 209 ]
ZnO nanorod arrays
decorated with Au NPs have been reported to show approxi-
mately 8× increase in photocatalytic activity under UV irradia-
tion compared to bare ZnO.
[ 209 ]
Plasmonic enhancement is a useful and important approach
for development of high performance photovoltaic devices.
Introducing Au plasmonic material onto ZnO photoanodes
has been reported to markedly enhance their photovoltaic per-
formance, which was proposed to involve the coupling of hot
electrons formed by plasmons and the electromagnetic fi eld.
[ 216 ]
Figure 10 A shows the UV–vis absorption spectra of ZnO
nanorod arrays coated with different amounts of Au NPs. Other
than the strong ultraviolet absorption, the bare ZnO nanorods
showed no absorption between 400 and 800 nm. In contrast,
the Au-ZnO composite arrays show obvious absorption band
in the visible region due to the LSPR of Au NPs. The LSPR-
related absorbance increases with the increasing loading of Au
NPs, which was controlled by varying the deposition duration
and conditions. Figure 10 B is a schematic diagram showing
the mechanism of photocurrent enhancement by LSPR in the
Au-ZnO nanostructure. Upon irradiation, electrons in the VB
of ZnO rod will be excited to the CB. Simultaneously, upon irra-
diation, plasmon will be induced on the surface of Au NPs that
in turn generate hot electrons and a secondary electromagnetic
fi eld. The plasmon-induced hot electrons would also be injected
into the CB of ZnO leading to an increase in photocurrent. On
the other hand, the LSPR can generate a strong electromag-
netic fi eld close to the surfaces of the Au NPs. The electromag-
netic fi eld can modify the band structure at the Au-ZnO inter-
face and create more vacancies at the bottom of the ZnO CB.
It would further facilitate the generation of photoelectrons by
photoexcitation.
Chen et al. reported enhanced photovoltaic performance of
solar cell based on Au NPs sensitized ZnO nanorod arrays.
[ 217 ]
Figure 10 C showed the J – V curves of the cells before and after
Au NP sensitization using iodide-based electrolyte. While the
device with bare ZnO nanorods did not show measurable
photocurrent, the cell with Au NPs coated ZnO nanorod array
Adv. Mater. 2014,
DOI: 10.1002/adma.201400403
Figure 9. A) Low-magnifi cation TEM image of a ZnO/ZnSe core/shell
nanowire. A thin layer of ZnSe was coated on the ZnO nanowire. B) High-
resolution TEM image of the interface of the core/shell heterostructure,
enlarged from the rectangular area outlined in (A), showing the epitaxial
growth relationship of the ZnO WZ core and ZnSe ZB shell. C,D) FFT pat-
terns of the rectangular areas outlined in (B). E) EDS nanoprobe line-scan
of the elements Zn, Se, and O, across the ZnO/ZnSe core/shell nanowire
as indicated by the line in (A). A–E) Reproduced with permission.
[ 205 ]
Copyright 2008, Wiley-VCH.
13
www.advmat.de
www.MaterialsViews.com
wileyonlinelibrary.com
©
2014 WILEY-VCH Verlag GmbH & Co. KGaA, Weinheim
REVIEW
presented a J
SC
of 1.72 mA cm
−2
, a V
OC
of 0.37 V, and a FF
of 0.46, and yielded a PCE of 0.30%. The photovoltaic perfor-
mance enhancement was due to the increased optical absorp-
tion in the visible light caused by the LSPR effects from the Au
NPs. The hot electrons excited at the Au NP surfaces could be
separated and transported to the CB of the ZnO nanorods with
subsequent drift to the conductive TCO electrode (Figure 10 D).
The Schottky Au-ZnO contact enabled the injection of electrons
from Au NPs to ZnO nanorods while blocking the reverse fl ow.
The excited Au ions would capture electrons donated from the
redox species in the electrolyte to compensate for their lost
electrons. The oxidized redox species were then regenerated by
taking electrons from the outside circuit via the counter elec-
trode. Reaction involved in the photocurrent generation process
in the Au-ZnO Schottky barrier solar cell can be summarized
as follows:
Photoanode : Au Au e Auhv
()
+→ +
⊕−
(7)
2Au 3I 2Au I
3
+→ +
⊕− −
(8)
Counter Electrode : I 2e 3I
3
+→
−− −
(9)
5. SSCs Based on ZnO Nanostructures
As discussed in Section 2, the power conversion effi ciency
(PCE) of an SSC is determined by its current density–
voltage ( J – V ) characteristics, which includes three important
operational parameters, the short-circuit current density ( J
SC
),
the open-circuit voltage ( V
OC
), and fi ll factor ( FF ). In this part,
we review recent efforts to enhance the performance of ZnO-
nanostructure-based SSCs by various approaches including
improvements on optical absorption, charge separation, trans-
portation, and recombination processes, as well as optimizing
energy levels and gaps of the QDs. Recent advances of pho-
tovoltaic performance of high effi ciency ZnO nanostructures
based SSCs are summarized in Table 2 . However, it should
be noted that effi ciencies in these reports have not been veri-
fi ed by national laboratories nor other recognized third parties.
While the table has to be read with caution, the rapid progress
achieved in recent years are unarguable.
5.1. Improvement of Short-Circuit Current ( J
SC
) by Enhancing
Light Absorption and Charge-Injection Effi ciency
The J
SC
in a SSC is determined by its IPCE which depends
on the light harvesting effi ciency (LHE) and the electron injec-
tion yield (
ϕ
inj
) from the photoexcited QDs into ZnO fi lm. To
achieve a high J
SC
in SSCs, some basic features are generally
required. These include wide optical absorption over the vis-
ible and the near-infrared regions, effi cient injection of photo-
generated electrons into the CB of the ZnO electrode, and
effi ciently regeneration of oxidized QDs. Herein, we review
recent progress in SSCs with specifi c emphasis on the strat-
egies for tailoring optical absorption, charge injection, and
transfer.
Adv. Mater. 2014,
DOI: 10.1002/adma.201400403
Figure 10. A) UV–vis absorption spectra of ZnO nanorod arrays decorated with Au nanoparticles prepared with various durations. B) Schematic illustra-
tion of the plasmon-induced effects on Au-ZnO photoelectrode. A,B) Reproduced with permission.
[ 216 ]
Copyright 2012, American Chemical Society. C)
J – V characteristics of solar cell devices with bare ZnO nanorod array and Au-coated ZnO nanorod array under illumination. D) A schematic of a band
diagram corresponding to the ZnO/Au/electrolyte cell structure. C,D) Reproduced with permission.
[ 217 ]
Copyright 2009, American Chemical Society.
14
www.advmat.de
www.MaterialsViews.com
wileyonlinelibrary.com
©
2014 WILEY-VCH Verlag GmbH & Co. KGaA, Weinheim
REVIEW
5.1.1. Optical Engineering by Tailoring ZnO Morphologies
Good optical absorption is an obvious basic requirement for any
solar cell design. The size and morphology of the ZnO nanostruc-
tured photoanode have important infl uence on its QD loading as
well as light scattering and trapping. Although a larger surface
area might augment surface recombination losses, it could also
enhance light harvesting by enabling more effective QD loading.
Vertically aligned nanowire arrays have been demonstrated to
have good light scattering and trapping properties resulting in
Table 2. Recent photovoltaic performance of ZnO nanostructures based SSCs.
No. Morphology of ZnO Sensitizer Method Electrolyte Counter
electrode
J
SC
[mA/cm
2
]
V
OC
[V]
FF
PCE
[%]
Reference
1 ZnO nano-tetrapods ZnSe/CdSe/
ZnSe
Ion exchange and
SILAR
Na
2
S+S GO/Cu
2
S;
Pt-coated FTO
glass
17.3
17.8
0.761
0.741
0.471
0.398
6.2
5.25
[218]
2 Branched double-layer ZnO
nanorod-nano-tetrapods
CdS/CdSe SILAR Na
2
S+S Cu
2
S on brass 16.56 0.703 0.45 5.24 [157]
3 ZnO nanowire array Zn
x
Cd
1– x
Se Ion exchange Na
2
S+S Cu
2
S on brass 18.05 0.65 0.40 4.74 [184]
4 ZnO nanoparticles passiv-
ated with TiO
2
CdS/CdSe SILAR and CBD Na
2
S+S Cu
2
S on brass 15.42 0.62 0.49 4.68 [219]
5 ZnO nanowire array ZnSe/CdSe Ion exchange Na
2
S+S Cu
2
S on brass 11.96 0.836 0.45 4.54 [183]
6 ZnO nanoparticles CdS/CdSe SILAR and CBD Na
2
S+S Cu
2
S on brass 10.48 0.683 0.623 4.463 [140]
7 ZnO nano-tetrapods CdS/CdSe SILAR and CBD Na
2
S+S Pt-coated FTO
glass
13.85 0.722 0.424 4.24 [134]
8 ZnO nanowire array CdS/CdSe SILAR and CBD Na
2
S+S Au-coated FTO
glass
17.3 0.627 0.383 4.15 [220]
9 ZnO nanowire array ZnSe/CdSe Ion exchange Na
2
S+S Cu
2
SnS
3
on
FTO glass
11.46 0.810 0.437 4.06 [221]
10 ZnO nanowire array ZnSe/CdSe Ion exchange Na
2
S+S CZTS on FTO
glass
11.06 0.822 0.410 3.73 [222]
11 ZnO nanowire array CdS/CdSe SILAR and CBD Na
2
S+S Mesocellular
carbon foam
on FTO glass
12.6 0.685 0.42 3.60 [223]
12 ZnO nanowire array CdS/CdSe spin-SILAR Na
2
S+S Pt-coated FTO
glass
9.38 0.663 0.56 3.45 [224]
13 ZnO nanowire array CdS/CdSe CBD and Ion
exchange
Na
2
S+S Cu
2
S on brass 14.49 0.62 0.36 3.23 [185]
14 Arrays of ZnO nanorods
passivated with TiO
2
CdS/CdSe SILAR and CBD Na
2
S+S Cu
2
S on brass 9.93 0.61 0.52 3.14 [225]
15 ZnO nanowire array CdS/CdSe SILAR Na
2
S+S Au-coated FTO
glass
18.63 0.48 0.342 3.06 [176]
16 Branched n-Si NW/ZnO
NR
CdS/CdSe SILAR and CBD Na
2
S+S Pt-coated FTO
glass
11.0 0.71 0.38 3.00 [226]
17 Disordered ZnO nanorods
passivated with TiO
2
CdS/CdSe SILAR and CBD Na
2
S+S Cu
2
S on brass 8.17 0.64 0.52 2.72 [105]
18 ZnO nanosheets CdS/CdSe SILAR Na
2
S+S Cu
2
S on
copper foil
19.3 0.49 0.28 2.67 [115]
19 sol-modifi ed ZnO CdS/CdSe SILAR and CBD Na
2
S+S Pt on FTO
glass
13.3 0.600 0.331 2.64 [227]
20 ZnO NWs CdS/CdSe SILAR and CBD Na
2
S+S Pt on FTO
glass
8.36 0.555 0.51 2.36 [228]
21 Hierarchical ZnO nanowire
array
CdS Electrochemical
Deposition
LiI+I
2
Pt-coated FTO
glass
7.38 0.70 0.31 1.62 [188]
22 ZnO nanowire array Zn
x
Cd
1– x
Se CVD LiI+I
2
Pt-coated ITO 6.7 0.64 0.35 1.5 [44]
23 ZnO nanorod array CdS/CdTe Electrodeposition LiI+I
2
Pt-coated CE 4.93 0.58 0.37 1.05 [229]
24 Array of Al
2
O
3
passivated
ZnO nanorods
CdSe Molecular link LiI+I
2
Pt-coated FTO
glass
2.72 0.66 0.55 0.99 [171]
Adv. Mater. 2014,
DOI: 10.1002/adma.201400403
15
www.advmat.de
www.MaterialsViews.com
wileyonlinelibrary.com
©
2014 WILEY-VCH Verlag GmbH & Co. KGaA, Weinheim
REVIEW
absorption of most incident light with a relatively thin absorber
layer.
[ 9,143 ]
Tena-Zaera et al. have investigated the infl uence of
the dimensions of ZnO nanowires on light scattering.
[ 230 ]
These
authors reported that for ZnO nanowires with a constant diam-
eter, the maximum of the total refl ectance increases from 8.6%
to 20.4% for lengths of 0.5 and 2.0 µm, respectively, with no sig-
nifi cant spectral shift observed. For ZnO nanowires with a con-
stant length, there was an obvious red shift in the refl ectance
peak with increasing diameter (from 105 to 330 nm) because
the total refl ectance in the long wavelength region increases
with the nanorods diameter. Therefore, optical engineering of
nanowire arrays for enhanced scattering for wavelengths where
QDs exhibit a relatively low absorption coeffi cient can result in
increased light absorption.
The rational design of the ZnO nanostructures for suffi cient
QD loading and effi cient electron transport is another impor-
tant approach. An obvious approach to increase QD loading
is to increase the length and decrease the diameter of the ZnO
nanowire. However, it is still a challenge to grow ZnO nanowires
longer than 10 µm with diameters smaller than 100 nm. While
ZnO nanowires with longer lengths have been synthesized, their
diameters became correspondingly larger, often also resulting
diminished roughness factors and poor photovoltaic performance.
Yang’s group has recently reported a branched double-
layer architecture of ZnO nanorods (NRs) and nano-tetrapods
(TPs) as an effi cient photoanode, achieving a PCE as high as
5.24%.
[ 157 ]
In the NR-TP fi lm, the ZnO TPs prepared via vapor
transport growth were coated by a doctor blade technique onto
a 2-µm-thick ZnO NR array to form a double-layer architec-
ture. Additional branched structures were further put onto the
double-layer to improve the roughness factor and network con-
nectivity ( Figure 11 A). Such 3D structures (Figure 11 B and C)
effectively increase the surface area for effi cient QD loading.
CdS- and CdSe-cosensitized ZnO photoanodes of single-layer
TP fi lm, double layer NR−TP fi lm, and branched double layer
NR−TP fi lm were prepared by SILAR method, respectively.
The UV–vis spectra in Figure 11 D show that the ZnO/
CdS/CdSe TP fi lm, the ZnO/CdS/CdSe NR−TP fi lm and the
branched ZnO/CdS/CdSe NR−TP fi lm have a similar absorp-
tion onset at around 720 nm. However, in the visible region
from 400 to 700 nm, the absorbance of the ZnO/CdS/CdSe
branched NR−TP fi lm is higher than those for the other two
fi lms. The enhanced absorbance is attributed to the secondary
branching which allows larger QD loading. The IPCE spectra of
the three photoanodes in Figure 11 E show signifi cant increase
in photocurrent density from the ZnO/CdS/CdSe single-layer
Adv. Mater. 2014,
DOI: 10.1002/adma.201400403
Figure 11. A) Layout of the double-layer-assembly branching processes for fabrication of the branched ZnO double-layer NR−TP fi lm photoanode.
Top view (B) and cross sectional view (C) SEM images of the branched ZnO double-layer NR−TP fi lm photoanode. D–F) UV−vis absorbance spectra
(D), IPCE curves (E), and illuminated J − V curves (F) of the ZnO/CdS/CdSe TP fi lm (black short-dashed line), the ZnO/CdS/CdSe NR−TP fi lm (orange
dashed line), and the branched ZnO/CdS/CdSe branched NR−TP fi lm (violet solid line). A–F) Reproduced with permission.
[ 157 ]
Copyright 2013,
American Chemical Society.
16
www.advmat.de
www.MaterialsViews.com
wileyonlinelibrary.com
©
2014 WILEY-VCH Verlag GmbH & Co. KGaA, Weinheim
REVIEW
TP fi lm to the double layer NR−TP fi lm, and even further
increase for the branched double layer NR−TP fi lm reaching
IPCE values of up to ca. 80% at ca. 590 nm. The corresponding
J – V curves of cells assembled using the three photoanodes
(Figure 11 F) show that the branched double layer structure
increases J
SC
signifi cantly suggesting that the double-layer
design and branching strategies are effective means for devel-
oping high-effi ciency SSCs.
5.1.2. Bandgap Engineering of QDs by Composition Tuning
Besides the quantum confi nement effect for optical tuning,
multinary metal chalcogenide alloyed QDs offer an additional
possibility for bandgap tuning by composition variations.
Bandgap tuning of multinary alloys from composition effects
originate from changes in the effective exciton mass that result
from the strong dependence of the electronic energies with
composition.
[ 231,232 ]
Several ZnO/Zn
x
Cd
1– x
Se core/shell nanocables with tun-
able shell composition (0 ≤ x ≤ 1) have been synthesized on
fl uorine-doped tin oxide (FTO) glass substrates via a simple
and facile ion exchange method using ZnO nanowire array
as sacrifi cial templates.
[ 184 ]
The ZnO/ZnSe/CdSe nanocable
arrays were prepared by anion exchange of ZnO nanowire
with Se
2−
ions to form ZnO/ZnSe nanocables. This was fol-
lowed by the partial conversion of ZnSe to CdSe by replacing
Zn
2+
ions with Cd
2+
ions in the ZnSe shells, where the ratio of
ZnSe/CdSe in the bilayer shells was controlled by adjusting the
reaction temperature of ZnO/ZnSe nanocables with Cd
2+
ions.
Ternary Zn
x
Cd
1− x
Se shells were then obtained by annealing
the trilayer ZnO/ZnSe/CdSe nanocables. The bilayer ZnSe/
CdSe shells would easily intermix to form a Zn
x
Cd
1− x
Se alloy
upon annealing due to rapid diffusion of the smaller sized cat-
ions as compared to the anions. It was reported that the ZnO/
Zn
x
Cd
1− x
Se nanocables had a rougher surface with increasing
Cd content in the shells ( Figure 12 A). The optical absorption
of the ZnO/Zn
x
Cd
1− x
Se nanocables can then be tuned almost
over the entire visible spectrum by changing the composition
of the ternary Zn
x
Cd
1– x
Se shells. It was observed a continuous
red shift of the absorption edges of ZnO/Zn
x
Cd
1– x
Se nano-
cables from longer wavelength of 535 nm (2.32 eV) for ZnSe,
643 nm (1.93 eV) for Zn
0.7
Cd
0.3
Se, and 725 nm (1.71 eV) for
Zn
0.33
Cd
0.67
Se, to 776 nm (1.60 eV) for ZnSe with increasing
Cd content in the ternary Zn
x
Cd
1– x
Se shells (Figure 12 B), dem-
onstrating bandgap tuning by composition variation. While the
lattice parameter of the alloys show a linear relationship with
the Zn content ( x ), the corresponding bandgap of the ternary
Zn
x
Cd
1− x
Se shells follow a quadratic dependence. The photovol-
taic performance of the ZnO/Zn
x
Cd
1– x
Se nanocables is shown
in Figure 12 C. The solar cell based on an array of ZnO/ZnSe
nanocables presents a J
SC
of 2.94 mA cm
−2
, a V
OC
of 0.67 V,
and a FF of 0.34, yielding a PCE of 0.68% (curve i). A signifi -
cant increase in J
SC
was observed with increasing Cd content
in the Zn
x
Cd
1– x
Se shells. The value of J
SC
drastically increased
from 9.54 mA cm
−2
for ZnO/Zn
0.7
Cd
0.3
Se nanocables (curve ii)
to 14.07 mA cm
−2
for ZnO/Zn
0.33
Cd
0.67
Se nanocables (curve iii),
and further to 18.05 mA cm
−2
for ZnO/CdSe nanocables (curve
iv) while the V
OC
remained almost constant (ca. 0.65 V). The
cell with the ZnO/CdSe nanocable array showed a PCE as high
as 4.74%. The performance improvement was demonstrated to
be due to the tunable bandgaps of the Zn
x
Cd
1– x
Se shells, which
Adv. Mater. 2014,
DOI: 10.1002/adma.201400403
Figure 12. A) SEM images of the ZnO nanowires and ZnO/Zn
x
Cd
1– x
Se nanocables, B) UV–vis spectra of the ZnO/Zn
x
Cd
1– x
Se nanocables (solid curves)
and the corresponding Zn
x
Cd
1– x
Se nanotubes (dashed curves), and C) J – V characteristics of the solar cells using ZnO/Zn
x
Cd
1– x
Se nanocable arrays
as photoanodes (measured under AM 1.5G simulated sunlight with an intensity of 100 mW cm
−2
). Curves of (i) ZnO/ZnSe nanocables, (ii) ZnO/
Zn
0.7
Cd
0.3
Se nanocables, (iii) ZnO/Zn
0.33
Cd
0.67
Se nanocables, and (iv) ZnO/CdSe nanocables. Inset of Panel B: Photographs of the arrays of ZnO/
Zn
x
Cd
1− x
Se nanocables. A–C) Reproduced with permission.
[ 184 ]
Copyright 2011, American Chemical Society.
17
www.advmat.de
www.MaterialsViews.com
wileyonlinelibrary.com
©
2014 WILEY-VCH Verlag GmbH & Co. KGaA, Weinheim
REVIEW
resulted in broader ranges of light absorption with increasing
Cd content in the ZnO/Zn
x
Cd
1– x
Se nanocables.
5.1.3. Co-sensitization of QDs with Cascade Band Structure
To further enhance the light harvesting and electron injection
capability of QDs, two different kinds of QDs have been sequen-
tially assembled onto the surfaces of ZnO nanostructures,
forming a cascade co-sensitized structure. It has been illustrated
that co-sensitized SSCs with suitable energy band alignment
can show a superior performance compared to SSCs using
single sensitizer.
[ 62,220,233 ]
Among various sensitizers, CdS/CdSe
co-sensitizers are the most employed co-sensitized system and
shows impressive performance when used with polysulfi de
electrolyte probably due to appropriate energy band alignment
between CdS and CdSe for fast electron injection and favorable
optical response over the visible region.
[ 234–236 ]
A series of high
performance SSCs co-sensitized with CdS/CdSe based on
either TiO
2
[ 62–64,234,237 ]
or ZnO
[ 134,140,157,219,220 ]
photoanodes have
been reported to achieve PCEs over 4%. For example, Yong et
al. employed a novel CdSe/CdS/ZnO nanowire array as the
photoanode of SSCs with a Au coated FTO as counter electrode,
achieving a PCE as high as 4.15% with a V
OC
of 627 mV.
[ 220 ]
Recently, CdS/CdSe co-sensitized SSCs based on 20 nm sized
ZnO nanoparticles mesoporous fi lm prepared by a simple
doctor blade technology has been developed, yielding a PCE as
high as 4.463% with a high FF of 0.623 and V
OC
of 0.623 V.
[ 140 ]
Cheng et al. reported high-effi ciency cascade CdS/CdSe
SSCs based on hierarchical tetrapod-like ZnO nanoparticles.
[ 134 ]
The ZnO mesoporous fi lms were prepared by screen-printing
ZnO nano-tetrapods on FTO substrates. CdS/CdSe-sensitized
ZnO photoelectrodes were then prepared by sequentially
coating with CdS QDs by SILAR and CdSe QDs by CBD on
the ZnO fi lms ( Figure 13 A). Compared with the as-prepared
ZnO nano-tetrapods with an absorption peak at 368 nm, the
coating of CdS shell and CdSe shifted the optical absorption
edge to about 500 and 670 nm, respectively (Figure 13 B). The
bandgaps of CdS and CdSe were estimated to be 2.48 and
1.85 eV, respectively. These values are slightly higher than the
reported bandgaps for bulk CdS (2.4 eV) and CdSe (1.7 eV),
due to quantum confi nement effect. In comparison with the
ZnO/CdSe photoanode, the ZnO/CdS/CdSe photoanode shows
similar absorption edge, but slightly higher absorbance in the
visible light region. Photographs of the corresponding samples
(inset in Figure 13 B) show color change from gray for the bare
ZnO electrode, to orange after deposition of a CdS shell by the
SILAR process, and eventually to dark brown after the deposi-
tion of CdSe QDs by CBD.
The IPCE spectra of the solar cells based on the four photo-
anodes described above are shown in Figure 13 C. The observed
IPCE results are consistent with the corresponding absorption
spectra. The ZnO/CdSe photoanode shows a wider IPCE spec-
trum with higher effi ciency than that of the ZnO/CdS photo-
anode due to its better light harvesting, and even higher values
are obtained when CdSe QDs are deposited on a CdS-coated
ZnO to form the ZnO/CdS/CdSe photoelectrode. This result
suggests that the CdS interlayer promotes the charge transport
from CdSe to ZnO, yielding a maximum IPCE close to 80%.
Figure 13 D depicts J – V characteristics for the SSCs assembled
from various photoanodes with a thickness of ca. 14 µm under
1 Sun illumination. The CdS-sensitized solar cell was character-
ized with a J
SC
of 1.4 mA cm
−2
, a V
OC
of 0.229 V, a FF of 0.238,
with a PCE of 0.078%, presenting much better performance
than the cell based on bare ZnO photoanode. The device based
on a CdSe-sensitized ZnO photoanode with a 2 h CBD process
delivered a much higher J
SC
of 8.94 mA cm
−2
, a V
OC
of 0.287
V, a FF of 0.203, and a PCE of 0.52%. The enhanced J
SC
and
PCE are owing to the broadened light absorption range of ZnO/
CdSe photoanode with respect to that of the ZnO/CdS photo-
anode. When CdSe QDs were coated on the CdS-sensitized
ZnO photoanode to form a ZnO/CdS/CdSe photoanode, the
photovoltaic performance was signifi cantly enhanced. The cell
of ZnO/CdS/CdSe photoanode prepared with a 1 h CdSe CBD
process presented a J
SC
of 9.43 mA cm
−2
, a V
OC
of 0.685 V, a FF
of 0.397, giving a PCE of 2.56%. By carefully modulating the
CdSe CBD deposition time, the best photovoltaic performance
could be achieved when ZnO/CdS/CdSe photoanode prepared
by depositing CdSe QDs with a 2 h CBD process, showing a
J
SC
of 13.85 mA cm
−2
, a FF of 0.424, a V
OC
as high as 0.722 V,
a maximum PCE of 4.24%. Figure 13 E shows the time-resolved
photoluminescence emission decay of the CdSe QDs grown on
bare glass, bare ZnO photoelectrode, and the CdS coated ZnO
photoelectrode, respectively. A decrease of the radiative decay
time from 2.84 ns for SiO
2
/CdSe to 1.98 ns for on the ZnO/
CdSe and further to 1.53 ns for ZnO/CdS/CdSe indicates a
faster electron injection from CdSe QDs into ZnO after coating
with a CdS interlayer. The electron-transfer rates for CdSe QDs
anchored onto bare ZnO and CdS-sensitized ZnO were esti-
mated to be 3.02 × 10
8
s
−1
and 1.52 × 10
8
s
−1
, respectively.
It should be noted that the relative band edges of bulk CdS
and CdSe typically show a type-I band structure. However,
when CdS and CdSe are brought into contact in a polysulfi de
electrolyte, a cascade band structure is obtained because the
band edges are rearranged due to Fermi level alignment by
electron transfer from CdS to CdSe.
[ 62,234–236,238 ]
Furthermore,
the polysulfi de electrolyte shifts the conduction band energies
of CdSe QDs toward negative potentials (vs NHE).
[ 40 ]
Thus, the
ZnO/CdS/CdSe system can have a stepwise type-II band struc-
ture as shown in Figure 13 A. In this system, CdS acts mainly
as a buffer layer, assisting electron injection from CdSe to the
ZnO photoanode by providing a cascading energy ladder. The
cascade co-sensitized SSCs manifested good electron transfer
dynamics and overall power conversion effi ciency. Further-
more, the CdS interlayer also behaves as an effective passiva-
tion layer to suppress the recombination of the injected elec-
trons with the redox electrolyte and holes in CdSe QDs.
[ 220,238 ]
The incorporation of CdS interlayer not only prolongs the elec-
tron lifetime but also increases electron-transfer rate constant
leading to much enhanced performance.
5.1.4. Energy-Band Alignment of QDs by Quantum Confi nement
A novel feature of QDs that open an additional way for opti-
mizing its optical and electronic properties is the quantum
confi nement effect. When the dimension of a QD is compa-
rable to or smaller than the size of its exciton Bohr radius, its
Adv. Mater. 2014,
DOI: 10.1002/adma.201400403
18
www.advmat.de
www.MaterialsViews.com
wileyonlinelibrary.com
©
2014 WILEY-VCH Verlag GmbH & Co. KGaA, Weinheim
REVIEW
energy levels will be shifted resulting in a widened bandgap. In
a MO/QDs system, the energy difference between their conduc-
tion band levels has signifi cant infl uences on the effi ciency of
electron transfer across their interface.
[ 77,239 ]
One can thus opti-
mize the electron transfer via adjusting the energy level offset
through controlling the size of the QDs.
[ 240–242 ]
Furthermore,
through the same effect, absorption spectra of QDs can also
be fi nely tuned such that they have maximum overlap with the
solar spectrum for better light harvesting.
Size-dependent bandgap of CdSe QDs has been revealed in
many reports.
[ 240–243 ]
The widened bandgaps are mainly due to
the up-shifted CBM of the QDs, while the VBM of the QDs are
nearly independent of their sizes,
[ 77,243 ]
as shown in Figure 14 A .
The up-shifted CBM contributes to enhancing the driving force
for electron-transfer from CdSe QDs to ZnO semiconductor.
This phenomenon was highlighted in the time-resolved transient
absorption (TA) kinetic decay spectra of the arrays of CdSe-sensi-
tized ZnO nanowires with different QD sizes, revealing a much
faster TA decay of the ZnO nanowires decorated with smaller size
CdSe QDs (Figure 14 B).
[ 242 ]
The electron-transfer rate constants
showed a signifi cant increase with decreased QD size, leading to
an enhanced driving force for electron transfer. The same result
Adv. Mater. 2014,
DOI: 10.1002/adma.201400403
Figure 13. A) Schematic illustration of the CdS/CdSe-cosensitized ZnO nano-tetrapod photoelectrode with cascade band structure and the possible
electron transport pathway. B) UV–vis absorption spectra of ca. 2 µm thick fi lms made of (a) a bare ZnO electrode, (b) a CdS-sensitized ZnO electrode,
(c) a CdSe-sensitized ZnO electrode, and (d) a CdSe/CdS-sensitized ZnO electrode. Insets are photographs of the corresponding samples. C) IPCE
spectra of various SSCs composed of various photoanodes (ca. 14 µm thick). D) J – V characteristics for SSCs assembled with various photoanodes
(ca. 14 µm thick) under AM 1.5 illumination at intensity of 100 mW cm
−2
). E) Emission (at 655 nm) decay of CdSe QDs deposited on glasses, bare
ZnO photoelectrodes and CdS-sensitized ZnO photoelectrodes. The excitation wavelength is 532 nm. A–E) Reproduced with permission.
[ 134 ]
Copyright
2012, The Royal Society of Chemistry.
19
www.advmat.de
www.MaterialsViews.com
wileyonlinelibrary.com
©
2014 WILEY-VCH Verlag GmbH & Co. KGaA, Weinheim
REVIEW
has also been observed in TiO
2
photoanodes sensitized with CdSe
QDs of different sizes.
[ 240,241 ]
QDs with a decreasing size show
negatively shifted (on an NHE scale) conduction band edge but
a widened bandgap; for this reason, the ZnO/QDs system faces
a dilemma regarding optical-absorption range and charge-injec-
tion-rate optimization. As a consequence, understanding and tai-
loring the energy band level of QDs is critical for optimizing the
electron transfer and light harvesting simultaneously.
5.2. Improvement of Photovoltaic Performance ( V
OC
and FF ) by
Surface Passivation
Both V
OC
and FF of SSCs are strongly infl uenced by the recom-
bination loss of electrons at the ZnO/QDs/electrolyte interface.
Low V
OC
(typically < 0.75 V) and FF (typically < 0.5) are two
main factors limiting the PCE of SSCs. It has been recognized
that charge recombination by back electrons transfer through
the ZnO/QDs/electrolyte interface is a main issue to deterio-
rate the V
OC
and FF of SSCs.
Trapping states at the surfaces of ZnO and QDs within the
photoanode often serve as recombination centers. In addition,
poor chemical stability of ZnO makes it easy to react with the
electrolyte and decreases the performance of the SSCs. To sup-
press the surface trap states and surface recombination, sur-
face passivation by coating the photoanode with a thin layer of
wide band-gap material, such as ZnSe,
[ 183,218 ]
TiO
2
,
[ 105,219,225,244 ]
Al
2
O
3
,
[ 171,245–247 ]
ZnS,
[ 248–250 ]
and CdS,
[ 251 ]
has been investigated.
The coating is typically chemical stable in the electrolyte, and
also has a more negative conduction band edge than that of
Adv. Mater. 2014,
DOI: 10.1002/adma.201400403
Figure 14. A) Diagram of the relative electronic energy differences between CdSe donating species and MO accepting species. A) Reproduced with
permission.
[ 77 ]
Copyright 2011, the National Academy of Sciences. B) (Left) Normalized TA kinetics of pure QDs (dotted lines) and sensitized ZnO
NWs (solid lines) with different QD sizes. (Top right) Scheme of reversible initial electron transfer from CdSe QD (1) to ZnO nanowire (2). (Bottom
right) Dependence of fast TA decay rate (solid squares) described by Marcus theory (gray line). B) Reproduced with permission.
[ 242 ]
Copyright 2012,
American Chemical Society.
20
www.advmat.de
www.MaterialsViews.com
wileyonlinelibrary.com
©
2014 WILEY-VCH Verlag GmbH & Co. KGaA, Weinheim
REVIEW
ZnO or creates a dipole at the interface to upshift the band
edge so as to block trap states and suppress surface recombi-
nation, leading to a drastic enhancement of photovoltaic per-
formance. The coating layer acts as surface energy barrier or
tunneling layer depending on the energy level of the coating
materials and/or passivated recombination sites on the photo-
anode’s surface to suppress ZnO/QDs/electrolyte interfacial
recombination.
5.2.1. Surface Passivation of Photoanode by ZnSe
ZnSe with a bulk bandgap of 2.7 eV has a much higher conduc-
tion band edge than those of ZnO and CdSe QD. These suggest
that upon forming a heterojunction with ZnO, electrons from
ZnSe can be more favorably transferred to the lower conduc-
tion band of ZnO. The redistribution of electrons in a ZnO/
ZnSe type-II heterojunction via Fermi level alignment would
induce signifi cant upward shift of the conduction band edges
for ZnO, which will be benefi cial for V
OC
enhancement. ZnSe
shell with a high conduction band edge can serve as blocking
layer and energy barrier to shield the ZnO core from the outer
CdSe QDs and the electrolyte, and provides physical separa-
tion of the injected electrons from the CB of ZnO from the
positively charged CdSe nanoparticles and the redox electrolyte,
thereby retarding their interfacial recombination rate.
Xu et al. has reported ZnSe passivated ZnO to pursue large
V
OC
for high effi ciency CdSe-based SSCs.
[ 183 ]
Arrays of trilay-
ered ZnO/ZnSe/CdSe nanocables ( Figure 15 A and B) were pre-
pared by surface selenization of ZnO nanowires with Se
2−
ions
to form ZnO/ZnSe nanocables, followed by partial conversion
of the as-obtained ZnSe shell to CdSe through cation replace-
ment of Zn
2+
by Cd
2+
. Extended absorption over the visible
light region was demonstrated upon formation of nanocables
as shown in Figure 15 C. While the bare ZnO nanowire array
absorbed only over the UV region at a wavelength shorter than
390 nm, the absorption edges of ZnO/ZnSe nanocables, ZnO/
ZnSe/CdSe nanocables could be red shifted up to 695 nm
(1.78 eV). The content of CdSe and its diameter were adjusted
Adv. Mater. 2014,
DOI: 10.1002/adma.201400403
Figure 15. A) Cross sectional SEM image of a trilayered ZnO/ZnSe/CdSe nanocable array. B) High-resolution TEM image of a trilayered ZnO/ZnSe/
CdSe nanocable. C) UV–vis absorption spectra of the arrays of (i) bare ZnO nanowires; (ii) ZnO/ZnSe nanocables; (iii) ZnO/ZnSe/CdSe (55 °C)
nanocables; and (iv) ZnO/ZnSe/CdSe (90 °C) nanocables. Insets are photographs of the corresponding samples. D) Schematic illustration of the cell
confi guration based on the trilayered ZnO/ZnSe/CdSe nanocables. E) Current density–voltage ( J – V ) characteristics under illumination of the SSCs
based on (a) the array of ZnO/ZnSe/CdSe (55 °C) nanocables with a Cu
2
S counter-electrode, (b) the array of ZnO/ZnSe/CdSe (55 °C) nanocables with
a Pt/FTO counter-electrode, (c) the array of ZnO/ZnSe/CdSe (90 °C) nanocables with a Cu
2
S counter-electrode, and (d) the array of ZnO/ZnSe/CdSe
(90 °C) nanocables with a Pt/FTO counter-electrode. A–E) Reproduced with permission.
[ 183 ]
Copyright 2012, The Royal Society of Chemistry.
21
www.advmat.de
www.MaterialsViews.com
wileyonlinelibrary.com
©
2014 WILEY-VCH Verlag GmbH & Co. KGaA, Weinheim
REVIEW
by controlling the reaction temperature. CdSe crystallites with
larger sizes in the nanocables prepared at a higher temperature
had an absorption edge of longer wavelength. Arrays of trilay-
ered ZnO/ZnSe/CdSe core/shell nanocables grown on FTO
glass substrates were used as effi cient photoelectrodes for SSCs
as shown in Figure 15 D. Figure 15 E shows the current density–
voltage ( J – V ) characteristics of the cells. A cell based on ZnO/
ZnSe/CdSe (55 °C) nanocables with a thicker ZnSe shell gave a
J
SC
of 11.96 mA cm
−2
, a FF of 0.45 and a V
OC
as high as 0.836 V,
yielding a PCE of 4.54% by using a CE of nanostructured Cu
2
S
on brass substrate under AM 1.5G illumination with an inten-
sity of 100 mW cm
−2
. Notably, a record V
OC
up to 0.855 V was
achieved for the same cell using a typical platinized FTO (Pt/
FTO) CE (curve b in Figure 15 E). The photoanode of ZnO/ZnSe/
CdSe (90 °C) nanocable array with thinner ZnSe shells but
thicker CdSe shells showed an improved J
SC
of 13.57 mA cm
−2
,
but a lower V
OC
of 0.652 V and a FF of 0.40. Due to the larger
CdSe crystallite size in the ZnO/ZnSe/CdSe (90 °C) nanoca-
bles, the corresponding cell shows enhanced light absorption
and J
SC
. The lower V
OC
and FF were believed to be related
mainly with the poor passivation effect of thin ZnSe shells,
which consequently leaded to a lower PCE of 3.56%.
Enhancement of photovoltaic performance by introducing
a ZnSe passivation layer at the photoanode/electrolyte inter-
faces has also been demonstrated. Yang’s group have prepared
ZnO nano-tetrapods with diameters of 50−200 nm and lengths
of 400−1000 nm, which were then coated with sensitizers to
form ZnO/ZnSe/CdSe and ZnO/ZnSe/CdSe/ZnSe nanostruc-
tures ( Figure 16 A).
[ 218 ]
The J – V characteristics of the two cells
are shown in Figure 16 B. The ZnO/ZnSe/CdSe nano-tetrapod
solar cell delivers a J
SC
of 15.2 mA cm
−2
, a V
OC
of 0.703 V, and a
FF of 37.4%, yielding a PCE of 4.02% using the graphene oxide
(GO)/Cu
2
S CE and polyethylene glycol (PEG) 2 000 000 PEG
gelled polysulfi de electrolyte. Notably, after coating an addi-
tional layer of ZnSe to form the ZnO/ZnSe/CdSe/ZnSe struc-
ture, the corresponding cell shows a J
SC
of 17.3 mA cm
−2
, V
OC
of 0.761 V, and FF of 47.1%, leading to a record PCE of 6.20%.
Figure 16 C shows that after the outermost ZnSe coating trans-
formed the ZnSe/CdSe heterojunction (HJ) to a ZnSe/CdSe/
ZnSe quantum well (QW), the IPCE of the ZnO/QW is higher
Adv. Mater. 2014,
DOI: 10.1002/adma.201400403
Figure 16. A) Schematic diagram of the formation process of the ZnSe/CdSe/ZnSe QW sensitizer: (i) Place the photoanode in freshly prepared
NaHSe; (ii) dip in Cd
2+
and NaHSe solution successively for four cycles; (iii) dip in Zn
2+
and NaHSe solution successively for two cycles. B) The J – V
characteristics of the cells based on the ZnO/QW and ZnO/HJ solar cells. C) IPCE curves of the cells based on the ZnO/QW and ZnO/HJ solar cells:
pink hatched region indicates the photoconversion improvement from ZnO/HJ to ZnO/QW. D) Nyquist plots of ZnO/HJ and ZnO/QW solar cells at
0.8 V forward bias. E) Schematic illustration of the two channel transport model and the proposed energy band diagram of ZnO/HJ and ZnO/QW based
on the measured Fermi level ( J
2
of HJ fl ows along the surface whereas J
2
of QW fl ows along the middle trench). A–E)Reproduced with permission.
[ 218 ]
Copyright 2013, American Chemical Society.
22
www.advmat.de
www.MaterialsViews.com
wileyonlinelibrary.com
©
2014 WILEY-VCH Verlag GmbH & Co. KGaA, Weinheim
REVIEW
than that of the ZnO/HJ for wavelengths >500 nm (highlighted
by the hatched pink area), while the UV–vis absorption edge of
ZnO/QW is blue-shifted (ca. 15 nm) from 729 to 714 nm. This
result reveals that the outmost ZnSe shell contributes to elec-
tron collection enhancement and/or electron injection from the
CdSe shell particularly at long wavelengths.
Figure 16 D shows EIS results of the ZnO/QW and the ZnO/
HJ solar cells at 0.8 V in dark. It shows a much smaller electron
transport resistance R
t
for ZnO/QW (4.2 ± 0.2 Ω) than that for
ZnO/HJ (18.5 ± 0.5 Ω), demonstrating more effi cient electron
transport in ZnO/QW. Furthermore, the recombination resist-
ance (R
r
) in the ZnO/QW cell (105 ± 3 Ω) is two times higher
than that in the ZnO/QW cell (51 ± 2 Ω). This suggests that the
outermost ZnSe coating serves as an effective surface energy
barrier to reduce photoanode/electrolyte interfacial recombi-
nation for performance enhancement. Because of its smaller
transport resistance and larger recombination resistance, the
ZnO/QW solar cell has a much larger electron diffusion length
(125.0 µm) than that of the ZnO/HJ cell (41.5 µm).
The Fermi level of the electrodes, as measured with ultravi-
olet photoelectron spectroscopy (UPS), are −4.38, −3.83, −4.13
and −3.86 eV, respectively, for ZnO, ZnO/ZnSe, ZnO/ZnSe/
CdSe and ZnO/ZnSe/CdSe/ZnSe (Figure 16 E). The uplifting of
the Fermi level from −4.13 eV of ZnO/HJ to −3.86 eV of ZnO/
QW also supported the enhanced V
OC
. Since E
F
and E
CB
have a
relationship as:
ln
CB F
B
B
2
EE
kT
CkT
e
α
=−
⎛
⎝
⎜
⎞
⎠
⎟
μ
(10)
where k
B
is Boltzmann’s constant,
α
is the electron-state distri-
bution parameter, T is the temperature, and C
µ
is the chemical
capacitance. Given the similar C
µ
values extracted from EIS,
(0.50 ± 0.01 mF for ZnO/HJ, 0.58 ± 0.01 mF for ZnO/QW),
it follows that E
CB
is only determined by E
F
. Therefore, it was
estimated that E
CB
of ZnO/QW was 0.27 eV higher than that of
ZnO/HJ. These results further confi rmed that coating of ZnSe
raised the CB of the ZnO photoanode via Fermi level re-align-
ment and thus enhance the V
OC
.
It was proposed that the electron can be transported via two
channels (Figure 16 E): the CdSe channel plus the conventional
ZnO channel. “J1” and “J2” in the fi gure represent, respectively,
the photocurrents transported along the ZnO and the HJ and
QW. Since electrons tend to transfer to the outermost CdSe
layer in the HJ, due to the lower CdSe CB edge, compared to
that of ZnSe, electron transport along the outer surface of the
HJ can be lost to trap states due to surface defects or electro-
lyte redox couples. In contrast, electron transport in the poten-
tial well (ZnSe/CdSe/ZnSe) benefi ts from a smaller transport
resistance and a larger recombination resistance resulted from
the energy barrier formed by ZnSe. This yields a more effi cient
charge collection with larger J
SC
and V
OC
.
5.2.2. Surface Passivation of Photoanode by TiO
2
TiO
2
has similar VB and CB energy levels as those of ZnO, but
better chemical stability, and is widely used as electron acceptor
in SSCs. It can also act as an effective passivation material in
ZnO-based photoanodes. Unlike the ZnSe case,
[ 183,218 ]
using a
TiO
2
shell onto ZnO cannot form an intrinsic surface energy
barrier due to the similar energy levels of TiO
2
and ZnO. How-
ever, it is possible to form a n-n
+
heterojunction at the ZnO/
TiO
2
interface due to differences in their electron concentra-
tions (10
18
cm
−3
in ZnO vs 10
10
cm
−3
in TiO
2
).
[ 252 ]
This hetero-
junction induces a built-in voltage:
ln
d
d
V
kT
q
N
N
=
⎛
⎝
⎜
⎞
⎠
⎟
+
(11)
where k is the Boltzmann’s constant, T is the temperature, q is
the electron charge, N
d
+
and N
d
are the electron concentrations
in the ZnO core and the TiO
2
shell. The built-in voltage gives
rise to a strong electric fi eld against electron fl ow from ZnO to
TiO
2
. This enhances the V
OC
by reducing recombination.
Tian and Cao et al. have investigated the effects of TiO
2
passi-
vation on ZnO based SSCs.
[ 219 ]
A facile passivation strategy for
a ZnO nanoparticle mesoporous photoelectrode was reported.
Formation of a thin TiO
2
passivation layer on the surface of
the ZnO nanoparticles was completed by immersing the ZnO
mesoporous fi lm in an aqueous solution containing H
3
BO
3
and
(NH
4
)
2
TiF
6
at room temperature, followed by annealing. While
the ZnO nanoparticles were etched in the mixed solution, TiO
2
particles deposited on the fresh surface and combined with
the newly broken chemical bonds to form an effective passiva-
tion layer. The simultaneous deposition of TiO
2
nanoparticles
not only changed the surface chemistry of the photoelectrode
to favor high loading of QDs, but also functioned as an energy
barrier layer to suppress surface charge recombination. There
was an increase in the specifi c surface area and the mesopore
volume from 57.7 m
2
g
−1
and 0.342 cm
3
g
−1
for the unpassi-
vated fi lm to 68.6 m
2
g
−1
and 0.401 cm
3
g
−1
for the passivated
one, respectively. However, the average mesopore diameter of
the passivated fi lm (29.7 nm) was slightly smaller than that of
the unpassivated fi lm (31.3 nm). The photovoltaic performance
of CdS/CdSe co-sensitized solar cells assembled from unpas-
sivated ZnO nanoparticle mesoporous fi lm and TiO
2
passi-
vated ZnO nanoparticle mesoporous fi lm are reproduced in
Figure 17 A. The solar cell assembled from unpassivated fi lm
using polysulfi de electrolyte shows a J
SC
of 11.61 mA cm
−2
, a V
OC
of 0.57V, and a FF of 0.36, yielding a PCE of 2.38%. However,
the cell with TiO
2
passivation delivers a J
SC
of 15.42 mA cm
−2
,
a V
OC
of 0.62 V, and a FF of 0.49, leading to a PCE as high as
4.68%.
Measurements of dark current under positive bias, where
electrons fl ow from the photoanode into the electrolyte, have
been used to provide information about the electron transfer
process. While the dark current itself cannot be directly related
to recombination because of potential differences in electro-
lyte concentration and potential distribution in the photoanode
in the dark and under illumination, dark current measure-
ment of SSCs can be used to interpret the extent of back elec-
tron transfer. Figure 17 B shows the J – V characteristic curves
reported for the two SSCs assembled with ZnO mesoporous
photoanode with and without TiO
2
passivation under dark.
Under the same positive potential bias, the dark current for
the TiO
2
passivated photoanode was much smaller than that in
the unpassivated photoanode, indicating smaller back electron
Adv. Mater. 2014,
DOI: 10.1002/adma.201400403
23
www.advmat.de
www.MaterialsViews.com
wileyonlinelibrary.com
©
2014 WILEY-VCH Verlag GmbH & Co. KGaA, Weinheim
REVIEW
transfer and lower charge recombination from the conduction
band of ZnO to the redox couple (S
2−
/S
n
2−
) in the electrolyte.
The electrochemical impedance spectroscopy (EIS) results of
the SSCs measured under dark with a forward bias of −0.6 V
is reproduced in Figure 17 C. The semicircle represents the
back electron transfer at the photoelectrode/QDs/electro-
lyte interface and transport in the photoelectrode ( R
ct
). It was
observed that the R
ct
increases from 131.6 to 470.3 Ω upon
TiO
2
passivation. The increase of R
ct
may also suggest that the
surface defects of ZnO are reduced by the TiO
2
passivation pro-
cess, which accounted for obvious enhancement of V
OC
and
FF . Figure 17 D shows Bode plots of the photoelectrodes with
and without TiO
2
passivation. The peaks of the spectra can be
used to determine the electron lifetime in the ZnO according to
1
2
n
min
f
τ
π
=
, resulting in estimated electron lifetime in the pas-
sivated photoelectrode device of ca. 317.9 ms, which was much
Adv. Mater. 2014,
DOI: 10.1002/adma.201400403
Figure 17. A) J – V curves of SSCs under illumination. B) J – V curves of SSCs under dark condition. C) Nyquist plot curves of SSCs under forward bias
(−0.6 V) and dark conditions. D) Bode plot curves of SSCs under forward bias (−0.6 V) and dark conditions. E) Schemes of the energy band structure
of ZnO/TiO
2
/CdS/CdSe. F) Schematic illustration of charge recombination pathways in the SSC. A–F) Reproduced with permission.
[ 219 ]
Copyright 2013,
The Royal Society of Chemistry.
24
www.advmat.de
www.MaterialsViews.com
wileyonlinelibrary.com
©
2014 WILEY-VCH Verlag GmbH & Co. KGaA, Weinheim
REVIEW
longer than that of the unpassivated ZnO (50.4 ms). These
results clearly demonstrate that the TiO
2
passivating layer can
enhance the charge recombination resistance and thus increase
the electron lifetime in the device. Furthermore, the passivated
SSC was also shown to have much better chemical stability.
Figure 17 E shows values of the conduction bands (CB): CdSe
> CdS > ZnO > TiO
2
. The CdS/CdSe sensitizers have a type-II
band alignment in the SSCs with polysulfi de electrolyte. Under
the operating conditions, photons are captured by the QDs,
yielding electron–hole pairs that are rapidly separated. The elec-
trons fi rst inject into the CB of TiO
2
and then transfer into the
ZnO CB. The holes in the QDs are reduced by redox couples
(S
2−
/S
n
2−
) in the electrolyte. Finally it is noted that, in addition
to the previously discussed passivation effects, the TiO
2
coated
ZnO mesoporous fi lm has a much higher BET surface area and
pore volume than those of the unpassivated ZnO mesoporous
fi lm. This allows the TiO
2
coated ZnO mesoporous fi lm to load
more QDs and leads to a higher J
SC
. On the other hand, the
thin TiO
2
passivation layer serves as an energy barrier sup-
pressing back electron recombination (as shown in Figure 17 F)
that prevents back electrons transfer from the ZnO to the elec-
trolyte (Process C) and from the ZnO to the QDs (Process D).
The reduced charge recombination rate results in larger recom-
bination resistance, prolonged electron lifetime, and enhanced
FF and V
OC
. Furthermore, the SSCs also showed good stability
in ambient conditions after 1 week measurement.
Tian and Cao et al. have further shown that the TiO
2
passiva-
tion layer can also be applied to SSCs with ZnO nanorods of
different morphologies with good results.
[ 105,225 ]
On the other
hand, Que et al. also reported dramatic enhancement of photo-
voltaic performance by introducing a TiO
2
layer as energy bar-
rier on the surface of ZnO nanowire arrays for CdS sensitized
solar cells.
[ 244 ]
5.2.3. Surface Passivation of Photoanode by Al
2
O
3
Insulating metal oxide Al
2
O
3
has also been used as a surface
passivation material to enhance the performance of ZnO based
SSCs. Luan et al. reported that the performance ( V
OC
, FF , PCE)
of CdSe QDs sensitized ZnO solar cells can be improved by
using a ultrathin Al
2
O
3
layer (ca. 2 nm) grown by atomic layer
deposition (ALD) on ZnO nanorods before CdSe QDs sensitiza-
tion.
[ 171 ]
The use of Al
2
O
3
shell resulted in an obvious enhance-
ment of FF from 0.24 to 0.55 and a slight increase of V
OC
from
0.65 to 0.66 V, and but a decrease of J
SC
from 2.94 to 2.72 mA
cm
−2
. The signifi cantly improved FF resulted in about 50%
enhancement of PCE from 0.46 to 0.99%. The increases in V
OC
and FF of Al
2
O
3
passivated SSCs were attributed to lower elec-
tron recombination at the photoanode/electrolyte interface due
to passivation of ZnO recombination sites by the Al
2
O
3
coating.
However, due to its insulating nature, the Al
2
O
3
impose an
additional barrier for electron injection from the CdSe QDs to
the ZnO nanorods and thus slightly reduces the J
SC
. They also
investigated that the effects of an ultrathin Al
2
O
3
passivation
layer (ca. 2 nm) on the performance of the CdS nanorods sensi-
tized ZnO nanowires solar cells.
[ 245 ]
The Al
2
O
3
passivated solar
cell showed a 51% increase in V
OC
(from 0.43 to 0.65 V) and a
42% increase in J
SC
(from 4.03 to 5.63 mA cm
−2
), consequently
resulting in a ca. 50% increase in PCE from 0.55% to 1.15%.
It is noted that J
SC
in the passivated cell is actually larger. This
indicates that the benefi ts of reducing recombination can out-
balance the penalty caused by an increase in serial resistance
due to the Al
2
O
3
layer.
5.2.4. Surface Passivation of Photoanode by ZnS
As a wide bandgap semiconductor ZnS is commonly used for
QDs surface passivation in SSCs since its CB edge potential
is more negative than those of QDs. It is usually coated onto
the photoanode surface by a SILAR method. Many groups have
found that ZnS coating signifi cantly improves the performance
of SSCs especially its J
SC
, V
OC,
and stability.
[ 248–250,253–256 ]
The
benefi cial roles of ZnS are generally attributed to: i) surface
states passivation of QDs by suppressing surface trapping of
photoexcited carriers in the QDs; ii) barrier layer formation pre-
venting back electron transfer from QDs to the electrolyte to
inhibit interfacial charge recombination; and iii) formation of
an effective tunneling channel for hole transfers into the elec-
trolyte. For example, after coating a ZnS passivation layer onto
the surface of CdS QDs, the V
OC
, J
SC
and FF of the CdS-sensi-
tized ZnO/Zn
2
SnO
4
core/shell nanocable array solar cells were
found to improve from 0.74 to 0.76 V, 3.44 to 3.68 mA cm
−2
and 43.65% to 44.35%, respectively, thus resulting in an
increase in PEC from 1.10% to 1.24%.
[ 250 ]
The thickness of the
ZnS passivation layer typically plays an important role for the
photovoltaic performance; Toyoda et al. found that effi ciency
of PbS-sensitized TiO
2
solar cell was related to the thickness
of the ZnS layer by changing the SILAR cycle number.
[ 255 ]
The
PCE fi rst showed an increase followed by a decrease with the
increasing number of SILAR cycles. Similar phenomenon
was also found in ZnS passivated ZnO-based SSCs. Sun et al.
reported that the solar cell of CdS-sensitized ZnO nanorod
array showed low performance with a J
SC
of 1.23 mA cm
−2
, a
V
OC
of 0.52, a FF of 0.29, and a PCE of 0.19%. Upon the deposi-
tion of a 7.5 nm thick ZnS layer on the ZnO nanorod surface
using 10 SILAR cycles, PCE was increased to 0.62% with a J
SC
of 3.59 mA cm
−2
, a V
OC
of 0.59 V, and a FF of 0.37.
[ 248 ]
Simi-
larly, Wang et al. found increased photoanode saturated photo-
current density from 6.5 mA cm
−2
for ZnO/CdTe nanocables to
maximum 13.8 mA cm
−2
for ZnO/CdTe/ZnS nanocables after
coating with an ultrathin layer of ZnS (ca. 2 nm) by 10 SILAR
cycles.
[ 194 ]
Optimum photocurrent enhancement of the ZnO/
CdTe photoanode was achieved by the ZnS passivation with
thickness between 2 and 5 nm.
5.3. Effects of Counter Electrode in SSCs
The counter electrode (CE) of a SSC plays a major role in the
regeneration of the oxidized species in the electrolyte to their
reduced state by transferring electrons from the external circuit
to the electrolyte. The development of improved CE materials
with good conductivities, large effective surface areas, and high
catalytic activities is important for pursuing high performance
SSCs. Recently reported CE materials include noble metals (Pt,
Au),
[ 62,134,176,220,224,257 ]
carbon based materials,
[ 223 ]
binary metal
Adv. Mater. 2014,
DOI: 10.1002/adma.201400403
25
www.advmat.de
www.MaterialsViews.com
wileyonlinelibrary.com
©
2014 WILEY-VCH Verlag GmbH & Co. KGaA, Weinheim
REVIEW
(Cu, Co, Pb) sulfi des,
[ 183,184,219,258–263 ]
multinary metal sulfi des
(Cu
2
ZnSnS
4
, CuInS
2
, Cu
2
SnS
3
),
[ 221,223,264–267 ]
and carbon mate-
rials – metal sulfi des composite materials.
[ 268–271 ]
While platinized CEs have high electrocatalytic activity in
DSSCs using I
−
/I
3
−
redox couple, their performance in SSCs
using polysulfi de electrolyte is less satisfactory. In particular, it
has been reported that Pt CE is not active for S
2−
/S
n
2−
couple
regeneration.
[ 257 ]
This is mainly caused by poisoning of the
Pt electrode due to sulfur compounds adsorption resulting in
a larger R
ct
and consequently poor electrocatalytic activity. Au
CE has been reported to have much better performance in
SSCs using polysulfi de electrolyte.
[ 62,220 ]
For example, Yong et
al. reported effi cient SSCs using a CdSe/CdS/ZnO NW array
as a photoanode and a Au-based CE with a maximum PCE
of 4.15%.
[ 220 ]
However, both Pt and Au are rare and high-cost
materials and exploration for low-cost and noble metal-free CE
(such as metal sulfi des and carbon-based materials.) with high
electrocatalytic activity is highly desirable. Due to their excel-
lent electron transport properties, carbon materials (graphene,
reduced graphene oxide, and carbon nanotubes, etc.) are prom-
ising CE materials in SSCs. In addition to Pt and Au CEs, Yong
et al. have also examined the photovoltaic properties of SSCs
using mesocellular carbon foam (MSU-F-C) CE.
[ 223 ]
While
nearly the same V
OC
(ca. 0.68 V) were obtained for various cells,
both the FF and J
SC
were, respectively, signifi cant increased
from 0.25 and 9.9 mA cm
−2
for Pt, 0.39 and 11.8 mA cm
−2
for
Au, and to 0.42 and 12.6 mA cm
−2
for MSU-F-C. The cell of
CdS/CdSe co-sensitized ZnO nanowire anode using MSU-F-C
CE yielded the highest PCE of 3.60%. The MSU-F-C CE has an
extremely high surface area (ca. 900 m
2
g
−1
) as well as ordered
and interconnected pores thus facilitating diffusion of redox
relay in the electrolyte and providing more active sites for redox
species reduction. Furthermore, the MSU-F-C CE exhibits good
durability in the polysulfi de electrolyte as well as remarkable sta-
bility for a variety of solvents used in the electrolyte solution.
[ 223 ]
Binary metal sulfi des, such as Cu
2
S, CoS and PbS, have
been demonstrated as promising CEs and exhibit superior
activities in polysulfi de electrolyte. These metal sulfi des can
be easily prepared by exposing metal foils of Cu, Co, or Pb to
a sulfi de solution. As presented in Table 2 , the large majority
of highly-effi cient SSCs reported use Cu
2
S-based CE due to its
outstanding catalytic activity and good electrical properties. For
example, curves a and b in Figure 15 E show the J – V character-
istics of solar cells using the same ZnO/ZnSe/CdSe nanocable
photoanode and counter electrodes of Pt-FTO and Cu
2
S-brass,
respectively. After replacing Pt-FTO counter electrode with
Cu
2
S-brass, the cell showed obvious increases in FF from 0.32
to 0.45, and J
SC
from 10.79 to 11.96 mA cm
−2
, resulting in sig-
nifi cant enhancement of PCE from 2.93% to 4.54%.
[ 183 ]
How-
ever, one of the key issues in SSCs is the CE’s stability; in par-
ticular, brass based Cu
2
S CE suffers from continual corrosion
and ultimately mechanical instability, which also consumed
and contaminated the polysulfi de electrolyte.
[ 268 ]
On other hand,
copper sulfi des in the polysulfi de electrolyte can undergo phase
transformation under long-term illumination. Copper sulfi de
(Cu
x
S) can exist in several stoichiometries and crystallographic
structures and the resulting complex structures and valence
states (Cu
+
and Cu
2+
) result in large electrocatalytic activity vari-
ations upon regeneration of the polysulfi de electrolyte.
Incorporation of alloying elements into copper chalco-
genides to form multinary semiconductors is a promising
approach to improve their electrocatalytic and electrical proper-
ties. Copper-based multinary materials such as Cu–In–Ga–S–
Se and Cu–Zn–Sn–S–Se are themselves excellent photovoltaic
materials. Some recent reports also demonstrated their poten-
tials for applications as effective CE materials in SSCs. For
example, Cu
1.8
S and Cu
2
SnS
3
(CTS) hierarchical microspheres
have been synthesized ( Figure 18 A and B), and used as effi cient
CE materials for ZnO-based SSCs.
[ 221 ]
Figure 18 C shows J – V
characteristic of three cells using ZnO/ZnSe/CdSe nanocable
photoanode different CEs. The solar cell with a CTS/FTO CE
achieved a PCE of 4.06% with a J
SC
of 11.46 mA cm
−2
and a
FF of 0.437, which were much better than the performances
of the Cu
1.8
S/FTO based cell with a PCE of 3.65%, a J
SC
of
10.51 mA cm
−2
and a FF of 0.423. Nyquist plots of the Cu
1.8
S/
FTO–Cu
1.8
S/FTO and the CTS/FTO–CTS/FTO symmetric
cells containing polysulfi de redox electrolyte show that the R
ct
decreases from 11.4 Ω cm
2
for the Cu
1.8
S/FTO counter electrode
to 6.2 Ω cm
2
for the CTS/FTO counter electrode (Figure 18 D).
Quaternary Cu
2
ZnSnS
4
(CZTS) hierarchical microspheres
(ca. 2 µm in diameter) have also shown to be effective counter
electrode materials in SSCs.
[ 222 ]
The photovoltaic performance
of ZnO/ZnSe/CdSe nanocables SSCs using various CEs were
examined as shown in Figure 18 E. The device with a bare FTO
glass CE gave a J
SC
of 3.46 mA cm
−2
, a V
OC
of 0.745 V, and
a FF of 0.128, yielding a PCE of 0.33%. The cell using a Pt/
FTO CE acquired a J
SC
of 9.11 mA cm
−2
, a V
OC
of 0.816 V, a FF
of 0.305, and a PCE of 2.27%. Whereas for the case of CZTS
microspheres coated FTO (CZTS/FTO) CE, the photovoltaic
performance of the cell, using the same photoanode, improves
further. The J
SC
, V
OC
, and FF of the cell improve signifi cantly to
11.06 mA cm
−2
, 0.822 V, and 0.410, respectively, for a PCE ca.
3.73%. It was found that the CZTS microspheres show higher
electrocatalytic activity compared to Pt for the reduction of the
polysulfi de electrolyte. The R
ct
value decreased from 600 Ω cm
2
for the FTO-based cell to 270 Ω cm
2
for the Pt/FTO-based cell,
and further to 105 Ω cm
2
for the CZTS/FTO-based cell. Such
results indicate that CZTS microspheres can act as effective CE
material in SSCs based on polysulfi de electrolyte.
On the other hand, carbon materials, such as graphene,
reduced graphene oxide (rGO), carbon nanotubes, and carbon
black, have been shown to be effective additives to metal chal-
cogenides (Cu
x
S, CoS, PbS and Cu
2
ZnSnSe
4
) for forming high
performance composite (e.g., rGO-Cu
2
S, multiwalled carbon
nanotube (MWCNT)-CZTSe, and carbon black-PbS) counter
electrodes. For example, the 2D structure of rGO with high
surface area scaffold are considered to increase the number
of the Cu
2
S reactive sites.
[ 268 ]
The rGO in composite CE serve
as electron transport pathway and shuttles electrons across
the 2D structure to the active Cu
2
S catalyst sites where the
electrons are used to reduce the oxidized polysulfi de. Yang et
al. reported a solar cell employing a ZnO/ZnSe/CdSe/ZnSe
photoanode and a GO/Cu
2
S CE with a FF of 47.1% and a PCE of
6.20%. When Pt CE was used, however, a smaller FF of 39.8%
was obtained, leading to a deteriorated PCE of 5.25% due to the
increased R
ct
between CE and the polysulfi de electrolyte.
[ 218 ]
Zeng et al. have prepared MWCNTs-CZTSe composite CEs.
[ 269 ]
It was found that blending ratio of MWCNTs and CZTSe in the
Adv. Mater. 2014,
DOI: 10.1002/adma.201400403