Global Strength Assessment Requirement of Ageing Fixed Offshore Structure with Joint Anomalies
Bạn đang xem bản rút gọn của tài liệu. Xem và tải ngay bản đầy đủ của tài liệu tại đây (875.21 KB, 11 trang )
CAFEO28 2010
CAFEO 28
Global Strength Assessment Requirement of Ageing Fixed Offshore
Structure with Joint Anomalies
M. S. Ayob, Technology & Engineering Division, PETRONAS, MALAYSIA
B. S. Wong, Technology & Engineering Division, PETRONAS, MALAYSIA
ABSTRACT
There are increasing numbers of ageing structures in the water of South China Sea (SCS)
which come along with various types structural integrity issue, such as visual crack, member
flooding, lamination joint, shallow gas and excessive marine growth. Advanced structural
integrity analyses are needed to effectively quantify and assess the integrity status of the
ageing structure to ensure continuing serviceability of the structure. An integrity assessment
methodology on lamination joints, cracked joints and flooded members are presented in the
paper. Non-linear plastic collapse analysis is performed by introducing local joint flexibility
in the laminated tubular joint, together with incorporation of cracked joints and flooded
members modeling to check for the structure’s ultimate strength, the Collapse Reserve
Strength Ratio (CRSR) as well as the joint capacity. The requirement of the CRSR is
validated through the target reliability requirement for SCS. The structure’s Reserve Strength
Ratio (RSR) is then identified when the joint capacity is exceeded and compared to the CRSR
of the structure. The comparison will give indication of the necessary remedial and mitigation
action need to be taken to strengthen the joint. A case study is presented to give an insight on
the methodology and findings.
Keywords: Ageing structure, Integrity, Non-linear plastic collapse analysis, Reserve strength
ratio
Global Strength Requirement of Ageing Fixed Offshore Structure with Joint Anomalies
2
1. INTRODUCTION
To date, there are increasing numbers of ageing fixed offshore structure worldwide as well as
those installed in Malaysia water. Generally, there are various degradation mechanisms that
can cause the structural failure, fire and explosion events. The degradation mechanisms can
be classified into time/age driven degradation mechanism, and event (non-age) driven
degradation mechanism. The time/age driven degradation mechanism is associated with
damage process which can progress over a period of time, i.e. corrosion, fatigue and marine
growth. The event (non-age) driven degradation mechanism is not associated with time and it
can occur any particular point of time without prior indication, i.e. increase in deck load,
wave-in-deck and damaged members. These degradation mechanisms trigger the need of re-
assessment of the structures to determine their fitness for purpose. Kallaby et al., (1994) [2]
ISO 19902 [4] and NORSOK-006 [6] have listed similar structural assessment initiators.
According to API RP2A [1], Kallaby et al., (1994) [2], Krieger et al., (1994) [3], ISO 19902
[4] and O’Connor et al., (2005) [7], the structural assessment is generally divided into (1)
Screening Level; (2) Design Level; and (3) Ultimate Strength Level. The objective of these 3
(three) levels of assessment is to ensure the structure has adequate capacity to withstand the
damage mechanism. However, the complexity of the analysis increases as move from
Screening Level to Ultimate Strength Level. As complexity increase, conservatism
incorporated in the analysis reduces to enable the engineer to gain better prediction of
structural responses.
Ultimate strength analysis shall be adopted as structure fail to comply Design Level
requirement. By conducting Ultimate Strength analysis, the system strength of the structure is
obtained instead of its individual component, where its redundancy and damage tolerance can
be well-defined. The outcome from the analysis can efficiently assist in understanding the
structure failure mechanism and correctly defining type of mitigation measure. Non-linear
Plastic Collapse Analysis is often used to quantify the ultimate strength by introducing the
Reserve Strength Ratio (RSR), which can be thought of factor of safety for the structure as a
whole against its 100-years design load. According to MARINTEK [5] and PRSB [8], the
basic procedures of used to conduct non-linear plastic collapse analysis are: Basic load cases
for dead loads are progressively increased to unity (1.0); Environmental load cases
incremental till the specified relative load level is reached, or until a defined characteristic
displacement is attained; Each load is applied in predefined steps; The deformed nodal
coordinates are updated after each load step to record the changes in the geometry; Elements
stiffnesses are then computed according to the updated geometry. With such, the stiffness
values can be assembled in each load step; At each load level, plastic capacity of the element
(ends and mid) is checked, whether the applied force exceeding the capacity. If such event
happens, the load level will automatically scaled to make the applied force is ‘equal’ to the
yield condition; As element forces reached to their yield surfaces, a plastic hinge is
incorporated to demonstrate the material non-linearity. The plastic hinge will be removed if
the member later is unloaded and becomes elastic; Load increment is automatically reversed if
global instability is detected; RSR of the structure is retrieved at the structure’s collapse point.
In this paper, a 3-legged fixed offshore structure with joint anomalies is selected for ultimate
strength assessment. The purpose of this study is to demonstrate the methodology used to
Ayob et. al.
3
quantified the ultimate strength of a structure with anomalies and propose cost efficient
mitigation measure.
2. STRUCTURAL MODEL
A 3-legged wellhead platform, located in water depth of 75.3m is taken as the subject of
study. It has been in service for more than 34-years and has exceeded its design life of 25-
years. The platform contains several anomalies as identified in the latest underwater
inspection campaign. There are as summarized as follow:
• Three (3) numbers of visual cracks
WN21, conductor frame guard at EL (-) 5m
WN25, conductor frame guard at EL (-) 5m
WN52, Leg A, HM at EL (-) 5m
• Three (3) lamination leg node cans:
WN35, Leg A at EL (-) 14m
WN69, Leg A at EL (-) 34m
WN103, Leg B at EL (-) 59m
• Nine (9) flooded members detected:
WN18-19, HM at EL(-) 5m
WN52-54, HM at EL(-) 23m
WN53-54, HM at EL(-) 23m
WN105-103,HM at EL(-) 59m
WN104-105, HM at EL(-) 59m
WN126-127, HM at EL(-) 75m
WN128-126,HM at EL(-) 75m
WN127-130, HM at EL(-) 75m
WN121-130, VM at EL(-) 59m-75m
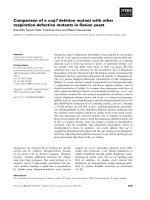
Figure 1 shows the structural model and location of the identified anomalies. The detail
description of the structure is given in Table 1.
Figure 1. Structural Model and its Associated Anomalies
Global Strength Requirement of Ageing Fixed Offshore Structure with Joint Anomalies
4
Table 1. Descriptions of the Structure
Design service category Wellhead
Design safety category Unmanned
Installed 1976
Water depth 75.3 m
Deck configuration Wireline & Cellar
Brace Type K
Leg 3 (33’’)
Bay 8
Pile 3 (30’’)
Riser 2 (6’’)
Conductor 3 (30’’)
Caisson 1 (16’’)
Boat-landing 1
3. METHODOLOGY
3.1 General
The Non-linear plastic collapse analysis is used in the reassessment of ageing 3-legged
structure to demonstrate that the platform has adequate strength and stability to withstand the
specified loading criteria with the identified joint anomalies, but without collapse. Failure of
the platform is caused either by failure of critical members and/or joints and/or piles,
foundation failure or a combination of these.
The strength of the platform is quantified by Reserve Strength Ratio (RSR). In other word,
RSR measures the reserve strength in a platform beyond the 100-years environmental load.
The RSR is defined as the ratio between base shear / overturning moment value at platform
collapse and 100-years environmental load: E
collapse
/ E
100
. The governing inequality for the
reassessment can be written as:
EFDF
F
R
F
R
R
ED
F
F
S
S
⋅+⋅≥),(
(1.0)
where: R = Ultimate platform strength
R
S
= Non-linear structural strength
R
F
= Non-linear foundation strength
D = Non -Environmental Load
E = Environmental Load
F
D
= Partial load factor on non-environmental load = 1.0
F
E
= Partial load factor on environmental loads =1.0
F
S
= Partial material factor for structure = 1.0
F
F
= Partial material factor for foundation = 1.0
To suit the format of plastic collapse analyses, the inequality is rewritten as follows:
R R
R
F F
F F D F F E
S
F
F S
S D S E
( ,
/
) ≥ ⋅ ⋅ + ⋅ ⋅ (2.0)
Substituting the factors, the inequality will reduce to:
ED
R
RR
F
S
⋅+⋅≥ 0.10.1)
0.1
,( (3.0)
Ayob et. al.
5
The analyses are based on the updated structural model, including the most recent information
about the structure. The analyses include pile analyses and non-linear soil-pile-structure
interaction. Gravity loads, buoyancy and functional loads are incremented to a load factor of
1.0. Environmental loads for the loading direction in question are subsequently incremented
until the collapse of the platform.
3.2 Environmental Load Modelling
The wave and current forces for the non-linear collapse analysis are based on Morrison’s
equation with account of hydrodynamic coefficients, wave kinematics factor, current
blockage factor, using Stokes 5
th
order kinematic theory. Directionality and joint probability
of occurrence of the wave and current are to be considered. For joint probability, 100-year
directional wave criteria are combined with the coincident 100-years directional current
criteria and 100-years with 1-hour mean omni-directional wind criteria. Marine growth profile
is included and modeled to capture the additional drag force exerted on the structure. The
detailed description of each parameter used which accordance to API RP2A [1] and PRSB [8]
is shown below:
•
Wave Theory: Stoke 5
th
Order wave theory. Maximum load and overturning moment
are identified by running 360 steps of wave cycle at 1
o
interval
•
Hydrodynamic Coefficients
Drag coefficient, Cd = 1.06 (increase by 6% to account for anodes and other
jacket appurtenances)
Inertia coefficient, Cm = 2.00
•
Wave kinematics factor of 0.90 is adopted
•
Current blockage factor for 3-legged structure
End-on = 0.90
Diagonal = 0.90
Broadside = 0.90
•
Current stretching effect is considered as linear
•
Wake encounter effect is turned off
•
Doppler effect is neglected, thus the coefficient and loads are computed using the
actual wave periods
•
Marine growth profile
Maximum = 70mm
Minimum = 10mm
3.2.1 Metocean Criteria
Wave and current are assumed to be inline in the wave propagation directions. Mean Sea level
is 75.3m. The highest astronomical tide is 0.90 m; lowest astronomical tide is 0.00 m. The
100-years storm surge is 0.60 m. Total twelve loading directions are analysed, with an equal
spacing of 30
o
from each other (Figure 2).