bài giảng vẽ đồ thị trong matlav
Bạn đang xem bản rút gọn của tài liệu. Xem và tải ngay bản đầy đủ của tài liệu tại đây (377.45 KB, 49 trang )
Vẽ đồ thị trong
Matlab
TRONG KHÔNG GIAN 2 CHIỀU
Lệnh plot
plot(x,f(x))
Với:
f(x) - hàm số cần vẽ
x – vectơ miền giá trị của hàm f
Ví dụ
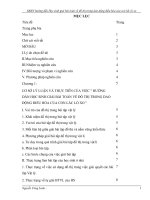
Vẽ đồ thị của hàm y = sin(x)
x = 0:pi/100:2*pi;
y = sin(x);
plot(x, y)
Các tham số plot(x,y,’linestye_marker_color’)
linestye
‘-’
‘ ‘
‘:’
‘ ’
marker
‘+’
+
‘h’/‘hexagram’
‘o’
^
‘*’
*
v
‘.’
.
>
‘s’/‘square’
<
‘d’/‘diamond’
‘p’/‘pentagram’
color
‘r’ (red)
‘k’(black)
‘w’(white)
‘y’(yellow)
‘c’(cyan)
‘b’(blue)
‘g’(green)
‘m’(magenta)
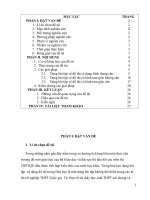
Ví dụ
x = 0:pi/20:2*pi;
plot(x, sin(x),’ *r’);
hold on
plot(x, sin(x – pi/2),’ om’);
plot(x, sin(x – pi), ‘:bs’);
hold off
LineWidth : độ rộng của nét vẽ, tính bằng pt.
MarkerEdgecolor: màu của đường viền marker.
MarkerFacecolor: màu bên trong marker.
Markersize: độ lớn của marker, tính bằng pt.
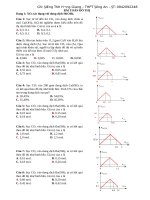
Ví dụ
x = -pi:pi/10:pi;
y = tan(sin(x)) - sin(tan(x));
plot(x,y,'—rs','LineWidth',…
2,'MarkerEdgecolor',…
'k','MarkerFacecolor',…
'g', 'Markersize',10)
Khi muốn vẽ thêm đồ thị trên đồ thị hiện có,ta sử dụng
lệnh hold on. Để tắt chế độ này,sử dụng hold off.
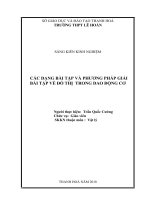
Ví dụ
x = 0:pi/10:2*pi;
plot(x, sin(x),'->r')
hold on
t =0:1:7;
plot(t, 2*t,'-*b');
Xác định tọa độ
Lệnh axis
axis([xmin xmax ymin ymax])
Tùy chỉnh các kiểu trục tọa độ
•
axis on/off/auto
•
axis normal/square/equal/tight
•
axis ij/xy
•
grid on/off
Ví dụ
Xác định tọa độ
•
xlim([xmin xmax])
•
ylim([ymin ymax])
Xác định giới hạn của trục Ox và Oy.
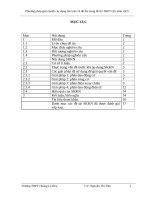
Ví dụ
x = linspace(0,3,500);
y = 1./(x - 1).^2 + 3./(x - 2).^2;
plot(x,y); grid on;
ylim([0 50]);
•
xticks và yticks
Ví dụ
x = -pi:.1:pi;
y = sin(x);
plot(x,y)
set(gca,'XTick',-pi:pi/2:pi)
set(gca,'XTickLabel',…
{'-pi','-pi/2','0','pi/2','pi'})
str = 'Jan|Feb|Mar|April|May|June';
set(gca,'xtick',1:6,
'xticklabel',str,'xgrid','on','layer','top')
set(gca,’XTickLabel’,…
{’1’;’10’;’100’}
set(gca,’XTickLabel’,…
’1|10|100’)
set(gca,’XTickLabel’,…
[1;10;100])
set(gca,’XTickLabel’,0:2)
set(gca,’XTickLabel’,…
[’1 ’;’10 ’;’100’])
Chú thích trên đồ thị
Các lệnh
xlabel; ylabel
title
legend
text; gtext;
Ví dụ
x = -pi:.1:pi;t = -pi/4;
y = sin(x);
plot(x,y)
set(gca,'XTick',-pi:pi/2:pi)
set(gca,'XTickLabel',{'-pi','pi/2','0','pi/2','pi'})
xlabel('-\pi \leq \Theta \leq \pi')
ylabel('sin(\Theta)')
title('Plot of sin(\Theta)')
text(-pi/4,sin(-pi/4),'\leftarrow sin(\pi\div4)',
'HorizontalAlignment','left')
legend('sin \theta')
hold on
plot(t, sin(t),’or’)
nhau
t=0:900; A=1000;
a=0.005; b=0.005;
y1 = A*exp(-a*t);
y2 = sin(b*t);
plotyy(t,y1,t,y2,…
'semilogy','plot')
subplot – vẽ nhiều đồ thị trong cùng một cửa sổ
subplot(m,n,p)
Ví dụ
t = 0:pi/20:2*pi;
[x,y] = meshgrid(t);
subplot(2,2,1)
plot(sin(t),cos(t))
axis equal
subplot(2,2,2)
z = sin(x)+cos(y);
plot(t,z)
axis([0 2*pi -2 2])
subplot(2,2,3)
z = sin(x).*cos(y);
plot(t,z)
axis([0 2*pi -1 1])
subplot(2,2,4)
z = (sin(x).^2)-(cos(y).^2);
plot(t,z)
axis([0 2*pi -1 1])