Báo cáo đánh gía tổng quát về ngành mía đường của LMC - Review of the Vietnam sugar sector
Bạn đang xem bản rút gọn của tài liệu. Xem và tải ngay bản đầy đủ của tài liệu tại đây (453.27 KB, 112 trang )
Review of the Vietnam Sugar Sector
Report for:
Bunge
February 2012
Research and analysis to inform your business decisions
LMC International
Oxford
14-16 George Street, Oxford, OX1 2AF, UK
t: +44 1865 791737, f: +44 1865 791739
New York
1841 Broadway, New York, NY 10023, USA
t: +1 (212) 586-2427, f: +1 (212) 397-4756
Singapore
M/S LMC International Ltd Singapore Branch
Siglap Post Office, PO Box 272
Singapore 914503
Kuala Lumpur
B-03-19, Empire Soho, Empire Subang, Jalan SS16/1, SS16,
47500 Subang Jaya, Selangor Darul Ehsan, Malaysia
t: +603 5611 9337
www.lmc.co.uk
Ssb126
LMC International
Develops Unique, Independent Research
For over 30 years LMC has delivered in-depth, specialist analysis to
leading international companies working in agricultural commodities,
biofuels, foods and industrial materials, as well as their end-use markets.
Our research covers thirteen major industry sectors:
Bio-based Chemicals Feed Ingredients
Biofuels & Biomass Coffee
Oils & Oilseeds Cocoa
Oleochemicals Food Ingredients
Grains Rubber
Sugar & Sweeteners Tyres
Starch & Fermentation
Recognised by many of the world’s major companies as experts in research,
LMC provides the business world with strategic insights unavailable elsewhere.
www.lmc.co.uk
© LMC International Ltd, 2012. All rights are reserved in all countries. No material may be reproduced or
transmitted, in whole or in part, in any manner, without written consent.
While LMC International endeavours to ensure the accuracy of the data, estimates and forecasts contained in
this study, any decisions based on them (including those involving investment and planning) are at the
client's own risk. LMC International can accept no liability regarding information, analysis and forecasts
contained in the study.
© LMC International, 2012
The contents of this study must remain confidential within the subscribing organisation
Contents
Introduction I1
Section 1: Overview of the Vietnam Sugar Sector 1
Key conclusions 1
Industry structure 1
Supply/demand balance 6
Sugar consumption 7
Trade flows 9
Consumption of alternative sweeteners 11
Prices dynamics 11
Cane prices 11
Sugar prices 12
Regional price differentials 14
Retail prices 16
Molasses prices 16
Section 2: Sugar Policy 19
Key conclusions 19
Production policies 19
For sugarcane producers 20
For sugar processing companies 21
Import controls 21
Import duties 21
Import licences 22
ASEAN Economic Community 23
Section 3: The Sugar Value Chain 24
Key conclusions 24
The sugar value chain 24
Profitability at different stages of the value chain 26
Results 26
Evolution of margins 29
Section 4: The Cost of Cane 30
Key conclusions 30
The cost of growing sugarcane 30
Competition from alternative crops 32
North Central and Central Coastal areas 34
Central Highlands 38
Southeast 40
Mekong River Delta 43
Cane supply price projections 45
Table of Contents
© LMC International, 2012
The contents of this study must remain confidential within the subscribing organisation
Alternative crop price projections 45
Projected cane supply prices 46
Issues for the future 47
The influence of rising labour costs 47
Yield improvements 48
Section 5: Sugar Supply Prices 49
Key conclusions 49
Assumptions 50
Processing costs 50
The outlook for sugar prices 51
Sugar supply prices 52
North Central/Central Coastal 52
Central Highlands 53
Southeast 54
Mekong River Delta 55
Section 6: The Potential for Cogeneration and Ethanol 56
Key conclusions 56
The potential for cogeneration 56
Policy on power 57
The potential for ethanol 58
Fuel ethanol demand 58
Fuel ethanol supply 59
Cassava as a feedstock 59
Molasses-based distilleries 60
Cost comparison of cassava and molasses based ethanol 60
Conclusions for molasses-based ethanol and cane supply prices 62
Section 7: Strategic Conclusions 63
The future structure of the Vietnam sugar market 63
The Industry in the South — rationalisation expected 63
The industry in the Central regions — possible expansion? 65
Will Vietnam be deficit in the future? 66
How can the deficit be supplied? 68
© LMC International, 2012
The contents of this study must remain confidential within the subscribing organisation
List of Tables
Table 1.1: Regional break-down of sugar mills in Vietnam 3
Table 1.2: Sugar consumption estimates by region 8
Table 1.3: Sugar supply/demand balance by region 9
Table 1.4: Supply/demand and trade balance by region 10
Table 1.5: Consumption of alternative sweeteners in Vietnam 12
Table 1.6: Cane prices by region 12
Table 1.7: Import parity calculation for official and illegal imports 14
Table 1.8: Estimated regional differentials in major producing regions
vs. HCM City 17
Table 2.1: Production targets vs. actual 20
Table 2.2: Major importers and import volumes in 2010 22
Table 3.1: Distribution of the profit in the value chain 26
Table 4.1: The cost of growing sugarcane by region 31
Table 4.2: Cane supply prices in the North Central and Central Coastal region 37
Table 4.3: Cane supply prices in the Central Highlands 39
Table 4.4: Cane supply prices in the Southeast 42
Table 4.5: Cane supply prices in the Mekong River Delta 44
Table 5.1: Processing costs 50
Table 5.2: Import parity calculation 52
Table 5.3: Sugar supply prices — North Central/Central Coastal 52
Table 5.4: Sugar supply prices — Central Highlands 53
Table 5.5: Sugar supply prices — Southeast 54
Table 5.6: Sugar supply prices — Mekong River Delta 55
Table 6.1: Electricity prices received by selected sugar industries 57
Table 6.2: Fuel ethanol distilleries in Vietnam 59
Table 6.3: Impact of fuel ethanol production on cassava supply/demand balance 60
Table 6.4: Ethanol distilleries that use molasses as a feedstock 60
Table 6.5: Cassava based ethanol production cost 61
Table 6.6: Molasses based ethanol production cost 61
Table 6.7: Projected ethanol production cost 61
Table 6.8: Ethanol import parity calculation from Thailand 62
Table 6.9: Theoretical cassava price that could be offered by ethanol producers 62
Table 7.1: Mill ownership in the Southeast and Mekong Delta 63
Table 7.2: Mills in the Mekong River Delta and Southeast categorised by size
and capacity utilisation 64
Table 7.3: Possible future structure of the industry in the South 65
Table 7.4: Mills in the North Midlands, North Central, Central Coastal and
Central Highlands categorised by size and capacity utilisation 66
Table 7.5: Increase in production required in the Central region to achieve self
sufficiency in 2015 67
© LMC International, 2012
The contents of this study must remain confidential within the subscribing organisation
List of Diagrams
Diagram 1.1: Sugar production by region 3
Diagram 1.2: Evolution of regional sugar production over time 4
Diagram 1.3: Average milling capacity 4
Diagram 1.4: Number of mills in operation 4
Diagram 1.5: Evolution of regional cane yields over time 5
Diagram 1.6: Cane yields by region 5
Diagram 1.7: TC:TS by region 5
Diagram 1.8: Sugar yields by region 5
Diagram 1.9: Net operating days by region 6
Diagram 1.10: Capacity utilization 6
Diagram 1.11: National supply/demand balance 7
Diagram 1.12: Major producers of RE sugar 7
Diagram 1.13: Supply/demand balance by region 9
Diagram 1.14: Consumption of major non-caloric sweeteners in Vietnam 11
Diagram 1.15: Cane prices 12
Diagram 1.16: Ex-factory prices vs. import parity and the cost of illegal imports 13
Diagram 1.17: Price premium in HCM vs. Hanoi 14
Diagram 1.18: Relative prices in Vietnam and China 15
Diagram 1.19: Ex factory prices vs. retail prices 16
Diagram 1.20: Molasses price estimates in Vietnam vs. Thai export prices 17
Diagram 2.1: Evolution of import duties for raw and refined sugar 22
Diagram 3.1: Sugar value chain 24
Diagram 3.2: Sugar consumption by sector 25
Diagram 3.3: Direct consumption by sector 25
Diagram 3.4: Sugar value chain, average 2009-2011 — North Central/Central Coast 27
Diagram 3.5: Sugar value chain, average 2009-2011 — Central Highlands 27
Diagram 3.6: Sugar value chain, average 2009-2011 — Southeast 28
Diagram 3.7: Sugar value chain, average 2009-2011 — Mekong River Delta 28
Diagram 3.8: Grower and Miller margins — North Central/Central Coastal 29
Diagram 3.9: Grower and Miller margins — Central Highlands 29
Diagram 3.10: Grower and Miller margins — Southeast 29
Diagram 3.11: Grower and Miller margins — Mekong River Delta 29
Diagram 4.1: Field wages by region 31
Diagram 4.2: Cane prices vs. cane costs at the farm gate 32
Diagram 4.3: Rice and cassava prices at the farm gate 34
Diagram 4.4: Rubber and coffee prices at the farm gate 34
Diagram 4.5: Area of major crops grown in the North Central and Central
Coastal areas 35
Diagram 4.6: Sugarcane yields vs. national average 36
Diagram 4.7: Cassava yields vs. national average 36
Diagram 4.8: Rice yields vs. National average 36
Diagram 4.9: Rubber yields vs. national average 36
Diagram 4.10: Profit-equalising cane price vs. actual cane price paid (North Central
and Central Coastal areas) 37
Diagram 4.11: Major crops grown in the Central Highlands 38
Diagram 4.12: Yields of major crops vs. national average (Central Highlands) 39
Diagram 4.13: Profit-equalising cane price vs. actual cane price (Central Highlands) 39
Diagram 4.14: Area planted to major crops in the Southeast 41
© LMC International, 2012
The contents of this study must remain confidential within the subscribing organisation
Diagram 4.15: Yields of major crops vs. national average (Southeast) 41
Diagram 4.16: Profit-equalising cane prices vs. actual cane price (Southeast) 42
Diagram 4.17: Area planted to major crops in the Mekong River Delta 43
Diagram 4.18: Cane yields vs. national average 44
Diagram 4.19: Rice yields vs. national average 44
Diagram 4.20: Profit-equalising cane price vs. actual cane price
(Mekong River Delta) 45
Diagram 4.21: Projected long term cane supply prices in North
Central/Central Coast 46
Diagram 4.22: Projected long term cane supply prices in Central Highlands 47
Diagram 4.23: Projected long term cane supply prices in the
Southeast/Mekong Delta 47
Diagram 4.24: Labour costs as a proportion of total costs 48
Diagram 4.25: Historical growth in yields 48
Diagram 5.1: Sugar supply prices by region vs. import parity 49
Diagram 5.2: Tonnes Cane: tonnes sugar ratio 51
Diagram 5.3: Sugar supply prices — North Central/Central Coastal 53
Diagram 5.4: Sugar supply prices — Central Highlands 53
Diagram 5.5: Sugar supply prices— Southeast 54
Diagram 5.6: Sugar supply prices — Mekong River Delta 55
Diagram 6.1: Sources of electricity generation in Vietnam 57
Diagram 6.2: Projected ethanol demand in Vietnam 59
Diagram 7.1: Historical and required area growth in the Central region 68
© LMC International, 2012
The contents of this study must remain confidential within the subscribing organisation
List of Maps
Map 1.1: Regional breakdown of Vietnam’s sugar industry 2
Map 1.2: Trade flows by region 10
Map 4.1: Major alternative crops to sugarcane by region 33
Introduction
© LMC International, 2012 I1
The contents of this study must remain confidential within the subscribing organisation
This report provides a detailed review of the Vietnam sugar sector. The report is presented in
seven sections:
Section 1: An Overview of the Vietnam Sugar Sector. The report begins by providing an
overview of the Vietnam sugar sector focusing on sugar production, consumption and prices
in each region of the country.
Section 2: Sugar Policy. In this section, we provide an overview of sugar policy in Vietnam and
the implications of increased economic integration within the AEC.
Section 3: The Sugar Value Chain. In this section, assess the level of value addition at each
stage of the sugar value chain. This is designed to identify which market participants are able
to capture the value generated from sugar production.
Section 4: The Cost of Cane. Cane is grown throughput Vietnam. As a result, the cost of cane
differs between regions depending on the competition from other crops as well as
competition between mills for cane. In this section, we analyse the competitive environment
facing cane in each region and discuss the implications for cane production by region over
the next 5-10 years.
Section 5: Sugar Supply Prices. Based on our projections of the cost of cane in each region, in
this section, we assess the price at which each region will be able to supply sugar going
forward. This will allow us to identify the milling groups that are in the strongest position to
compete in the future.
Section 6: The Potential for Cogeneration and Ethanol. One way of improving the
competitive position of sugar producers is to move into value adding activities such as
electricity and ethanol production. In this section, we consider the opportunities for sugar
producers in these sectors.
Section 7: Strategic Conclusions. In this final section, we draw together our analysis to answer
a number of key questions including the prospect for Vietnam to become a significant
importer in the future, and identify which milling groups within Vietnam are best placed to
compete in a more liberalised market environment.
There are also three annexes:
Annex 1: Detailed mill Performance Data
Annex 2: Crop Cost Breakdown
Annex 3: The Outlook for Alternative Crop Prices
Introduction
Section 1: Overview of the Vietnam Sugar Sector
© LMC International, 2012 1
The contents of this study must remain confidential within the subscribing organisation
Vietnam is expected to be more or less self-sufficient in sugar in 2011/12. This is the result of a
massive expansion of the formal sugar sector in the second half of the 1990s and the first few
years of the 2000s, during which over 30 cane mills were built. Although cane is grown
throughout the country, field and factory performance is mixed. As a result, the industry has
been rationalising to improve its competitiveness in the face of greater competition from
regional sugar imports as Vietnam integrates within the ASEAN economic area. At the same
time, domestic demand is growing rapidly on the back of strong economic growth.
In this section, we provide an overview of the Vietnam sugar sector focusing on sugar
production and consumption in each region, as well as price dynamics for both sugar and
molasses.
Key conclusions
The Vietnam sugar sector is characterised by a large number of mainly small scale mills,
which are principally located in four main producing regions: North/Central, Central
Coastal, Central Highlands, Southeast and the Mekong River Delta.
Cane yields are relatively poor by international standards, but have been improving.
Cane yields are highest in the Mekong Delta in the far south. However, cane quality in
this area is poor compared to the rest of the country.
Sugar consumption is concentrated in the south of the country, where around 950,000
tonnes (67%) is consumed. This is due to the higher level of incomes, urbanisation and
strong demand from industrial end users in this part of the country. Both the north and
the south of the country are sugar deficit regions, where demand is met by imports
(both official and smuggled) and with sugar transported from the central region.
In general, domestic prices have tended to follow the cost of imports. However, prices
have not always reflected the full value of the import tariff (particularly when the tariff
has set at a higher level) because of the prevalence of smuggled sugar, particularly in
the south of the country.
Price dynamics with the country are complicated. While prices in the South have
tended to trade at a premium to the North, this has not always been the case. Assuming
that domestic prices reflect the cost of smuggled sugar, and that exports to China
continue, it is reasonable to assume that prices will be slightly higher in the North than
the South in the future.
The retail market is fragmented, with only around 15% of direct consumption sugar
being branded. The vast majority is sold unbranded in convenience stores. The majority
of consumers are considered to be highly price sensitive and unwilling to pay a
premium for brands.
Industry structure
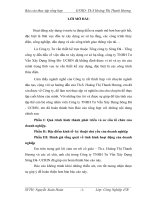
The sugar industry in Vietnam consists of 38 mills that are spread throughout the country.
Map 1.1 shows the geographical location of the industry, along with indicators of capacity and
production levels, while Table 1.1 gives details of the sugar mills in each region. Detailed mill
by mill production data is provided in Annex 1.
The Mekong River Delta in the South of the country is home to ten of the country’s 38
mills and accounts for about around a quarter of national sugar production.
Section 1: Overview of the Vietnam Sugar Sector
Section 1: Overview of the Vietnam Sugar Sector
© LMC International, 2012 2
The contents of this study must remain confidential within the subscribing organisation
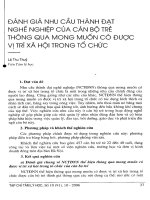
Map 1.1: Regional breakdown of Vietnam’s sugar industry
1
Note: Cane and sugar production represent a three-year average of actual production in 2009/10 and
2010/11 and estimated production in 2011/12.
Although there are fewer mills in the North Central and Central Coast regions, these
areas have a greater crushing capacity than in the Mekong River Delta. This is due to the
presence of a number of very large mills, including the foreign owned NAT&L, VTS and
KCP mills. NAT&L is owned by Tate & Lyle (although it is in the process of being sold to a
local company, while VTS and KCP are owned by Taiwanese and Indian companies,
respectively. As a result, these two regions also contribute around a quarter of the
country’s sugar production each.
North Midlands
No. of mills 4
Total capacity (tcd) 7,000
Cane ('000 tonnes) 573
Sugar ('000 tonnes) 59
North Central
No. of mills 6
Total capacity (tcd) 31,300
Cane ('000 tonnes) 2,368
Sugar ('000 tonnes) 257
Central Highlands
No. of mills 4
Total capacity (tcd) 10,000
Cane ('000 tonnes) 836
Sugar ('000 tonnes) 84
Central Coastal
No. of mills 8
Total capacity (tcd) 36,300
Cane ('000 tonnes) 3,166
Sugar ('000 tonnes) 300
Southeast
No. of mills 6
Total capacity (tcd) 19,500
Cane ('000 tonnes) 1,992
Sugar ('000 tonnes) 178
Mekong River Delta
No. of mills 10
Total capacity (tcd) 25,100
Cane ('000 tonnes) 3,302
Sugar ('000 tonnes) 272
Section 1: Overview of the Vietnam Sugar Sector
© LMC International, 2012 3
The contents of this study must remain confidential within the subscribing organisation
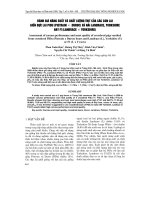
Diagram 1.1: Sugar production by region,
average 2008/09 to 2010/11
0 50 100 150 200 250 300
North Midlands
Central Highlands
Southeast
North Central
Mekong River
Delta
Central Coastal
'000 tonnes, tel quel
Although all the regions have
expanded sugar production over the
last two years, production in the
Central Coastal region has increased
to the point that it is the country’s
leading sugar producing region
(Diagram 1.2).
Production in the Southeast is
dominated by the Bourbon Tay Ninh
mill. The other mills in this region are
smaller in scale and the region
contributes around 15% of Vietnam’s
sugar output.
Table 1.1: Regional break-down of sugar mills in Vietnam
Name Capacity Name Capacity Name Capacity
(tcd) (tcd) (tcd)
North Midlands North Central Central Coastal
Son Duong 2,800 Lam Son 10,000 An Khe 10,000
Son La 2,200 NAT&L 9,000 Cam Ranh 8,000
Hoa Binh 1,000 VTS 6,000 KCP 6,000
Cao Bang 1,000 Song Con 3,000 Binh Dinh 3,500
Nong Cong 2,700 Ninh Hoa 3,400
Song Lam 600 Pho Phong 2,500
Tuy Hoa 1,700
Thuan Phuoc 1,200
Central Highlands Southeast Mekong River Delta
Gia Lai 3,500 Bourbon Tay Ninh 9,000 Nagajuna Long an 5,000
333 Dac Lac 2,800 RW Tay Ninh (Bien Hoa) 4,000 Vi Thanh 3,900
Dac Nong 2,000 La Nga 2,300 Soc Trang 2,800
Kon Tum 1,700 Tri An (Bien Hoa) 2,000 Tra Vinh 2,800
Phan Rang 1,200 Phung Hiep 2,600
Nuoc Trong 1,000 Hiep Hoa 2,000
Ben Tre 2,000
Long My Phat 2,000
Thoi Binh/Ca Mau 1,000
Kien Giang 1,000
There are also a small number of small-scale mills in the North Midlands and Central
Highlands region. While there is potential for production to increase in the Central
Highlands, expansion potential in the North Midlands is very limited due to the
mountainous nature of the region. There is also some cane produced in the Red River
Delta region, but there are no sugar mills to crush the cane. This cane is used to
produce handicraft sugar.
Diagram 1.2 shows how sugar production has evolved over the last few years. The last
two years have seen an increase in production, although it should be noted that data
for 2011/12 are estimates only.
Section 1: Overview of the Vietnam Sugar Sector
© LMC International, 2012 4
The contents of this study must remain confidential within the subscribing organisation
Diagram 1.2: Evolution of regional sugar production over time
0
50
100
150
200
250
300
350
400
2007/08 2008/09 2009/10 2010/11 2011/12 estimate
'000 tonnes, tel quel
North Midlands North Central Central Coastal
Central Highlands Southeast Mekong River Delta
While the industry is characterised by small scale mills, investment in capacity means that the
average size of mills has been increasing. This is illustrated in Diagram 1.3, which shows the
average crushing capacity of mills in Vietnam has almost doubled since the beginning of the
last decade. The last two years has also seen some rationalisation with two mills ceasing
operation at the end of the 2009/10 season (Diagram 1.4).
Diagram 1.3: Average milling capacity
1,000
1,500
2,000
2,500
3,000
3,500
2000/01 2002/03 2004/05 2006/07 2008/09 2010/11
tcd
Diagram 1.4: Number of mills in operation
30
31
32
33
34
35
36
37
38
39
40
2009/10 2010/11 2011/12
No. of mills
Diagrams 1.5 to 1.8 present indictors of technical performance at the field level. Over the past
decade, Vietnam has shown a marked improvement in cane yields in all regions, as illustrated
in Diagram 1.6. National average cane yields increased from 51 tonnes per hectare to over 60
tonnes per hectare in 2010. Although this is still not high by international standards, with cane
yields being hampered by poor disease control in many areas, it illustrates the potential for
further improvement in the future. The varying agro-climatic conditions between the regions
do, however, mean that there is some divergence in performance.
Section 1: Overview of the Vietnam Sugar Sector
© LMC International, 2012 5
The contents of this study must remain confidential within the subscribing organisation
The wet, tropical climate found in the Mekong River Delta helps the region achieve
substantially higher cane yields than elsewhere in the country. During the last three
seasons, cane yields have been 20-30 tonnes per hectare higher than in other regions.
However, the wet weather holds back sucrose formation and sugar recovery rates are
noticeably lower in the Mekong River Delta than elsewhere (Diagram 1.6.
Diagram 1.5: Evolution of regional cane
yields over time
30
40
50
60
70
80
90
2000/01 2002/03 2004/05 2006/07 2008/09 2010/11
tonnes/hectare
North Midlands
North Central and Central Coastal
Central Highlands
Southeast
Mekong River Delta
Diagram 1.6: Cane yields by region,
average 2008/09 to 2010/11
0 20406080
North Central and
Central Coastal
Central Highlands
North Midlands
Southeast
Mekong River
Delta
tonnes/hectare
Although the benefits of the very high cane yields in the Mekong River Delta are
tempered by the much lower sugar recovery, the region still achieves the highest
overall sugar yields in the country.
Sugar yields in the North Midlands, Southeast and Central Highlands are broadly similar
and fall in the range of 5-6 tonnes per hectare. The sucrose content of the cane grown
in the North Midlands and Central Highlands is supported by the greater diurnal swing
in temperature resulting in a lower tonnes-of-cane to tonnes-of-sugar ratio (TCTS).
Diagram 1.7: TC:TS by region, average
2008/09 to 2010/11
8.0 8.5 9.0 9.5 10.0 10.5 11.0 11.5 12.0
North Midlands
Central Highlands
North Central and
Central Coastal
Southeast
Mekong River
Delta
tonnes
Diagram 1.8: Sugar yields by region,
average 2008/09 to 2010/11
0.0 1.0 2.0 3.0 4.0 5.0 6.0 7.0
North Central and
Central Coastal
Central Highlands
Southeast
North Midlands
Mekong River
Delta
tonnes/hectare
Sugar yields are lowest in the North Central and Central Coastal regions, where not only
are cane yields the lowest in the country, but also recovery rates are not high as in the
North Midlands and Central Highlands.
Section 1: Overview of the Vietnam Sugar Sector
© LMC International, 2012 6
The contents of this study must remain confidential within the subscribing organisation
Diagrams 1.9 and 1.10 present regional performance indicators at the factory level:
The Mekong River Delta region has a longer crushing campaign than the rest of the
country, which runs from September to April.
However, capacity utilisation (measured in terms of sugar produced per tonne of
crushing capacity) is similar to the Central Highlands and Central Coastal regions. This is
due to the lower recovery rate achieved in the Mekong River Delta.
The North Central and the North Midlands have very short net crushing seasons and
relatively low capacity utilisation, revealing a shortage of cane in relation to the
installed crushing capacities in these regions.
Diagram 1.9: Net operating days by region,
average 2008/09 to 2010/11
0 20 40 60 80 100 120 140
North Midlands
North Central
Central Highlands
Southeast
Central Coastal
Mekong River
Delta
days
Diagram 1.10: Capacity utilization,
average 2008/09 to 2010/11
5.0 5.5 6.0 6.5 7.0 7.5 8.0 8.5 9.0 9.5 10.0 10.5
North Midlands
North Central
Southeast
Central Coastal
Central Highlands
Mekong River
Delta
tonnes sugar/tcd
Supply/demand balance
Diagram 1.11 presents Vietnam’s supply/demand balance over the last six years. Consumption
now stands at around 1.4 million tonnes. While production had stabilised at around 1.0-1.2
million tonnes over the last few years, in 2011/12, early projections suggest production is
expected to reach around 1.4 million tonnes, putting the country close to self-sufficiency once
again.
Section 1: Overview of the Vietnam Sugar Sector
© LMC International, 2012 7
The contents of this study must remain confidential within the subscribing organisation
Diagram 1.11: National supply/demand balance
0.0
0.2
0.4
0.6
0.8
1.0
1.2
1.4
1.6
2005/06 2006/07 2007/08 2008/09 2009/10 2010/11 2011/12
million tonnes, white sugar
Net trade Consumption Production
Sugar consumption
There are two types of sugar produced in Vietnam:
Direct mill white sugar (known locally as RS sugar). This sugar generally has a colour of
100-150 IU.
Refined sugar known locally as RE sugar. RE sugar is generally EC No.2 grade sugar (<45
IU), although the Vietnam Taiwan Sugar Company produces refined sugar with an
average IU of less than 45.
Section 1: Overview of the Vietnam Sugar Sector
© LMC International, 2012 8
The contents of this study must remain confidential within the subscribing organisation
Industrial vs. direct consumption
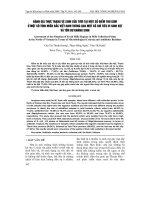
Diagram 1.12: Major producers of RE sugar
Viet Dal
8%
La Nga
5%
Bien Hoa
26%
SBT
17%
KCP
17%
NIVL
16%
NAT&L
2%
LSS
9%
It is estimated that industrial end users
account for around 800,000 tonnes (57%) of
demand. The vast majority of this is located
in the south of the country where a large
proportion of food processing takes place.
Around 0.4 million tonnes of RE sugar is
consumed in Vietnam each year. The major
consumers of RE sugar are Vinamilk, Coca-
Cola, PepsiCo and Dutch Lady. Diagram 1.12
shows the main producers of RE sugar. RE
sugar generally trades at a small premium of
around US$10-20 per tonne over RS sugar.
Consumption by region
Estimating sugar consumption by region is a difficult exercise as there are no official data
available. We have therefore formed a view based on discussions with industry players,
population data and information on the locations where each mill sells their sugar (to give an
indication of trade flows within the country).
It is widely recognised that sugar consumption in the south (Southeast and Mekong Delta) is
significantly higher than in the rest of the country. There are two main reasons for this:
A large proportion of the country’s food processing takes place in the south.
Incomes are higher in the south, with a larger proportion of the population living in
urban areas. This has resulted in a greater ‘westernisation’ of tastes and means that the
consumption of soft drinks and other processed foods containing sugar is higher,
particularly in the region around Ho Chi Minh city. The hotter weather in the south is
also considered to be a factor.
As much as two thirds of consumption (around 940,000 tonnes) is reported to be in the south
of the country. While this figure seems extremely high given the distribution of population
across the country, trade flows within the country and from external sources seem to support
this view (this is discussed in the next section).
Based on this information and population data, Table 1.2 presents our estimates of
consumption by region. To arrive at these estimates we have allowed for the fact that
tabletop consumption is higher in the south, while industrial demand is also concentrated in
this region, arriving at a figure of 940,000 tonnes for the south. This suggests that per capita
consumption (including industrial demand) is close to 30 kg per head in this region. We have
used population as the basis to split consumption between the Mekong River Delta and the
Southeast regions. This means that sugar consumption in the rest of the country is much
lower, at around 8 kg per person. Again, we have used this to estimate the likely distribution
of consumption between the regions in the north and central zones. While this result seems
extreme, it is supported by reported trade flows, which we discuss below.
Section 1: Overview of the Vietnam Sugar Sector
© LMC International, 2012 9
The contents of this study must remain confidential within the subscribing organisation
Table 1.2: Sugar consumption estimates by region
Population in 2010 Consumption Per capita Consumption
millions 000 tonnes kg/person
Mekong River Delta 17.3 510 29.5
South East 14.6 430 29.5
Central Highlands 5.2 40 8.4
North Central 10.1 80 8.4
Central Coastal 8.8 70 8.4
Northern midlands and mountain areas 11.2 90 8.4
Red River Delta 19.8 170 8.4
Total 86.9 1,400 16.1
Diagram 1.13: Supply/demand balance by
region
-600
-400
-200
0
200
400
600
North Central South
'000 tonnes, white sugar
Based on this analysis, Table 1.3 summarises
the supply/demand balance by region.
Despite the problems associated with
estimating consumption at this level, it is
clear that, the south and the north of the
country are deficit sugar, while the central
region is a surplus area (Diagram 1.13).
Table 1.3: Sugar supply/demand balance by region
Consumption Production
Surplus/Deficit
2010/11 2010/11
Mekong River Delta 510 267
-243
South East 430 183
-247
Central Highlands 40 92
52
North Central 80 235
155
Central Coastal 70 322
252
Northern midlands and mountain areas 90 51
-39
Red River Delta 170 0
-170
Total 1,390 1,150 -240
Trade flows
In addition to domestic production, the Vietnam market is also supplied with sugar imports,
which enter the market both officially and unofficially.
Section 1: Overview of the Vietnam Sugar Sector
© LMC International, 2012 10
The contents of this study must remain confidential within the subscribing organisation
Official imports. Each year, the government issues licences for private companies to
import sugar. In 2010/11, this was set at 250,000 tonnes. However, in 2012, it is
expected that licences for only 80,000 tonnes will issued because of the larger domestic
crop. Further discussion of the licencing system is provided in Section 2.
Smuggled imports. In addition to official imports, sugar enters Vietnam overland from
Thailand via Cambodia and Laos without paying import duties (currently set at 5%). In
2011, it is estimated that around 100,000 tonnes entered the south of the country
through Cambodia either by truck or by boat along the Mekong river. In addition,
around 50,000 tonnes enters the north of the country via truck through Laos.
Export to China. In addition, a recent development has seen Vietnamese sugar
exported to China. In 2011, it is estimated that around 150,000 tonnes was exported.
This trade is based on an agreement between the provincial governments in Northern
Vietnam and Yunnan province in China. However, this trade only takes place during
China’s off-crop period.
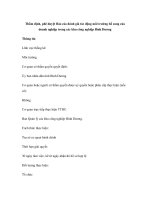
Table 1.4 presents the trade balance in each region allowing for this sugar trade. It shows that
even when imports and exports are taken into account, the northern and southern regions
remain in deficit. These deficits are met by the surplus generated in the Central region. Map
1.2 summarises these trade flows.
Table 1.4: Supply/demand and trade balance by region, 2010/11 (‘000 tonnes)
North Centre South
Total
Consumption 260 190 940
1,390
Production 51 649 450
1,150
Surplus/deficit -209 459 -490 -240
Imports (official) 59 0 148
207
Imports (smuggled) 50 0 100
150
Exports 150 0 0
150
Surplus/deficit -250 459 -242 -33
Section 1: Overview of the Vietnam Sugar Sector
© LMC International, 2012 11
The contents of this study must remain confidential within the subscribing organisation
Map 1.2: Trade flows by region, 2011
Consumption of alternative sweeteners
Sugar dominates the sweetener sector in Vietnam. There is no consumption of HFCS, and
consumption of non-caloric sweeteners in Vietnam is limited, making up less than 10% of
overall sweetener demand. Diagram 1.14 and Table 1.5 present consumption over the last
decade. These figures have been derived from trade data as there is no domestic production.
Total consumption of non-caloric sweeteners in recent years has been in the range of
100,000 to 150,000 tonnes white sugar equivalent.
Among the non-caloric sweeteners consumed, saccharin has been by far the most
widely used and, during the middle of the last decade, accounted for over 70% of
demand (on a white sugar equivalent basis). However, consumption has fallen sharply
since then (Diagram 1.14), most likely because of negative perceptions about its health
effects.
Illegal imports
from Thailand
vis Caombodia
~ 100,000 tonnes
Official imports
~ 150,000 tonnes
Illegal imports
from Thailand
via Laos
~ 50,000 tonnes
Exports to China
~ 150,000 tonnes
Official imports
~ 60,000 tonnes
Domestic sugar
from North Central
~250,000 tonnes
Domestic sugar
from Central
Highlands/Coast
~240,000 tonnes
Section 1: Overview of the Vietnam Sugar Sector
© LMC International, 2012 12
The contents of this study must remain confidential within the subscribing organisation
Diagram 1.14: Consumption of major non-
caloric sweeteners in Vietnam
0
20
40
60
80
100
120
2000 2002 2004 2006 2008 2010
'000 tonnes, white sugar equivalent
Aspartame Cyclamate Saccharin
Although consumption of saccharin
has fallen, it is still the most widely
used non-caloric sweetener, with
present consumption estimated at
just under 50,000 tonnes white
sugar equivalent.
Although historic data on the use of
stevia is not available, in 2009 and
2010, its consumption was around
40,000 tonne white sugar
equivalent, not far behind that of
saccharin.
Table 1.5: Consumption of alternative sweeteners in Vietnam (‘000 tonnes, white sugar
equivalent)
2000 2001 2002 2003 2004 2005 2006 2007 2008 2009 2010
Aspartame 4 5 6 6 7 7 8 8 9 9 9
Cyclamate 7 14 20 23 26 27 29 26 26 27 29
Saccharin 6 15 42 72 96 105 108 81 66 45 48
Stevia n/a n/a n/a n/a n/a n/a n/a n/a n/a 41 38
Prices dynamics
Cane prices
There is no established revenue sharing system for cane in Vietnam. While the government
recommends that the cane price is at least 60% of the sugar price, in practice, cane prices are
negotiated privately between growers and millers.
Cane prices tend to be higher in areas where there is a lot of competition from other mills, or
when cane is in short supply due to poor weather or attractive returns from alternative crops.
Table 1.6 presents cane prices over the last few years, while Diagram 1.15 shows average
prices received over the last three years to show the relativities between the regions.
Table 1.6: Cane prices by region (basis 10 CCS)
2006 2007 2008 2009 2010 2011
000 VND/tonne
Northern Midlands and Mountain Areas 330 400 400 550 750 900
North Central area and Central Coastal Area 340 400 400 600 850 1,000
Central Highlands 350 400 400 600 870 1,000
South East 350 420 500 750 900 1,100
Mekong River Delta 380 520 580 1,000 1,100 1,200
US$/tonne
Northern Midlands and Mountain Areas 21 25 25 32 40 44
North Central area and Central Coastal Area 21 25 25 35 46 49
Central Highlands 22 25 25 35 47 49
South East 22 26 31 44 48 53
Mekong River Delta 24 32 36 59 59 58
Section 1: Overview of the Vietnam Sugar Sector
© LMC International, 2012 13
The contents of this study must remain confidential within the subscribing organisation
Diagram 1.15: Cane prices, average 2009-2011
0 102030405060
Northern midlands
North Central/Central coastal
Central Highlands
South East
Mekong River Delta
US$/tonne
Prices are highest in the
Mekong River Delta, where
strong competition for cane
means that prices have been
bid upwards. Prices are also
high in the Southeast, where
cane competes with high value
alternative crops such as rubber.
Prices are lower further north
where wages, and therefore
costs of production, are lower,
and cane does not face such
strong competition from high
value alternative crops.
Sugar prices
Historically, domestic prices in Vietnam have been very volatile depending on the country’s
supply/demand balance. However, in general, the domestic market price has linked to the
cost of importing sugar from the world market. This is demonstrated by Diagram 1.16, which
compares the domestic price with:
The tariff inclusive cost of importing sugar from Thailand by sea. This allows for the fact
that the tariff applied to imports from Thailand was 30% in 2007, falling gradually each
year to 5% in 2010, its current level.
The cost of smuggling sugar over land from Thailand. The cost of smuggling sugar
(either in truck through Laos or Cambodia, or very small boats on the Mekong river) is
estimated to be around US$70-80/tonne. This is based on a per km cost of 8
cents/km/tonne for trucking cost. Allowing for a margin of US$20/tonne, this means the
premium over the world price required to make smuggling attractive is around US$100
per tonne.
The diagram shows that, while domestic prices have moved in line with world prices, they
have tended to trade below
the cost of making imports for much of the last few years. In fact,
domestic prices are very closely aligned to the cost at which smuggled sugar can enter the
market. Since the tariff has been reduced to 5%, the cost of imports is similar to the cost of
smuggled sugar entering overland via Cambodia.
Section 1: Overview of the Vietnam Sugar Sector
© LMC International, 2012 14
The contents of this study must remain confidential within the subscribing organisation
Diagram 1.16: Ex-factory prices vs. import parity and the cost of illegal imports
200
300
400
500
600
700
800
900
1,000
1,100
Apr-07 Oct-07 Apr-08 Oct-08 Apr-09 Oct-09 Apr-10 Oct-10
US$/tonne
Import Parity Price Actual price Illegal Imports
Table 1.7 presents an example of the cost of importing sugar into Vietnam through official
channels for 2011.
Table 1.7: Import parity calculation for official and illegal imports, 2011
No. 5 white sugar price per tonne 706
Far East premium per tonne 43
Thai white f.o.b. per tonne 750
Freight to Ho Chi Minh per tonne 20
Insurance & Commission 1.5% 12
White sugar c.i.f. Vietnam per tonne 781
White sugar tariff 5% 39
Discharge per tonne 11
Financing 1.7% 14
Importers' margin per tonne 20
Import parity price per tonne 865
Regional price differentials
Price differentials within Vietnam are complicated and are influenced by a number of factors:
On average, prices in the south of the country have generally traded at a premium to
prices in the north (Diagram 1.17). This is because the surplus generated in the north
has historically been transported to the south where demand is stronger.
Section 1: Overview of the Vietnam Sugar Sector
© LMC International, 2012 15
The contents of this study must remain confidential within the subscribing organisation
Diagram 1.17: Price premium in HCM vs.
Hanoi
-30
-20
-10
0
10
20
30
40
50
2007 2008 2009 2010 2011
US$/tonne
However, there have been times
when prices in the north have been
higher than the south as prices in
the south are kept under pressure
by smuggled sugar coming across
the Mekong river from Thailand
(via Cambodia). This has acted to
put a cap on prices in the south at
certain times. This is illustrated by
Diagram 1.1.17, which shows the
average price premium in Ho Chi
Minh relative to Hanoi.
To make the situation more complicated, in 2011, surplus sugar produced in the north of the
country has flowed into China, supporting prices in the north when this trade was taking
place. This trade depends critically on the price differential between domestic prices in China
and Vietnam.
Diagram 1.18 compares domestic prices in Vietnam with those in China and f.o.b. values for
white sugar in Thailand. It shows that there have been periods over the last few years when
domestic prices in China have been above price in Vietnam, creating an opportunity for
sugar to flow in this direction. However, this trade depends heavily on an agreement
between the governments of bordering provinces in Vietnam and China. For example, while
the provincial government in China has been happy to allow Vietnamese sugar to enter the
country for much of 2011, imports was stopped in December when China’s domestic harvest
started. As a result, prices in the north of Vietnam fell towards the end of the year. This means
that there are likely to be periods when prices in the north trade at a premium to the south
but also periods when prices fall below this level.
When China is allowing imports from Vietnam, prices in the north are likely to trade
above prices in the south.
However, when China is not allowing imports, prices in the south could trade at a
premium as some of the surplus in the North Central region would have to be
transported south.
Section 1: Overview of the Vietnam Sugar Sector
© LMC International, 2012 16
The contents of this study must remain confidential within the subscribing organisation
Diagram 1.18: Relative prices in Vietnam and China
0
200
400
600
800
1,000
1,200
Apr-07 Oct-07 Apr-08 Oct-08 Apr-09 Oct-09 Apr-10 Oct-10
US$/tonne
Thai f.o.b. Vietnam, ex-factory China, Guangxi, ex factory
Looking forward, this means that the outlook for price differentials within Vietnam is likely to
continue to be complicated, and vary within the year. However, if we take the view that, on
average, the domestic price in Vietnam will be set by sugar imports, this suggests that the
price in Hanoi can be expected to be slightly higher than in Ho Chi Minh City. This is for two
reasons:
Transportation costs from Northeast Thailand are higher to northern Vietnam are
higher than the south. For sugar transported over land, while the distance is broadly
similar (around 1,000 km) the cost per km is higher (in the region of US$20 per tonne).
Moreover, if sugar is transported by sea, there is the additional transportation cost to
take the sugar to Hanoi, which is also likely to be around US$10-15 per tonne.
If China continues to provide an outlet for Vietnam sugar, this will support prices in the
north of the country. This is because, at the margin, sugar from the Central Coastal
region or Central Highlands will be required to be transported north.
This suggests that prices in the North can be expected to trade at a small premium (around
US$15 per tonne) to prices in the south. However, it should be noted that this assumes the
trade with China continues to provide an outlet for surplus sugar produced in the North of the
country. This seems likely given that China looks set to be a net importer of sugar going
forward, although this trade may be limited to the off-crop period.
Ex-factory prices in the regions can be expected to trade at a discount to this price reflecting
the costs of transportation. These differentials are presented in Table 1.8. We have based
these differentials on trucking costs of 8 US cents/km/tonne in the South and 9 US
cents/km/tonne in the North of the country.