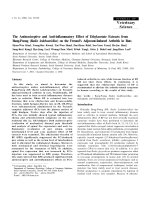
Comparison of soundscape on the ground floor of tube houses in Hanoi
Bạn đang xem bản rút gọn của tài liệu. Xem và tải ngay bản đầy đủ của tài liệu tại đây (1.47 MB, 5 trang )
PLEA2006 - The 23
rd
Conference on Passive and Low Energy Architecture, Geneva, Switzerland, 6-8 September 2006
Comparison of soundscape on the ground floor of
tube-houses in Hanoi and open urban space in
Bordeaux
Tuan Anh Nguyen
GRECAU Bordeaux, Ecole Nationale Supérieure d’Architecture et de Paysage de Bordeaux, Talence, France
ABSTRACT: Each urban space has its own soundscape: a specific sound level distribution according
to its urban form. Urban morphology and soundscapes are the topics of many research fields. The
definition of the relationship between urban morphology and its soundscape gives the clearest
appreciation of urban forms through their soundscapes. This paper also approaches the dominant
urban morphology features and specific soundscapes on the studied areas of Hanoi and Bordeaux.
Besides, a comparison between eastern and western urbanism soundscapes is made.
Keywords: Soundscape, urban morphology, urban form, open space, tube house.
1. INTRODUCTION
The research deals with Hanoi’s old town and
Saint- Michel quarter in Bordeaux. Hanoi’s old town
started as a gathering of artisans on a traditional
socio-economic basis resulting in a multi-purpose
space used for living, trading and crafting. The basis
structural elements are the tube-houses, which have
a narrow front (from 3 to 4 meters) and a long depth
(from 20 to more than 50 meters).
Because of the fact that those houses host at the
same time goods production and sales, they need to
have big ground floor spaces. That is why most of the
houses have their main ground floor doors open.
Trading goes on from the morning till ten o’clock in
the evening during the week, resulting in a noisy
environment throughout the day. The sound levels
change clearly from indoor spaces to outdoors ones
[1].
Saint-Michel quarter in Bordeaux has also an
ancient history, which has given it its own character
and specific features. The vehicle circulation ways set
its contour, it is linked to the rest of the city through
secondary roads and it is well connected to the
surrounding quarters. The circulation axis converges
into Saint-Michel square [2].
U-shaped streets and narrow dead-ends divide
the area into blocks of small dimensions resulting in a
low number of dwellings per block. The small distance
between consecutive streets also results in many
junctions and empty spaces.
We can also find in the studied zone, a place of
vital importance for the quarter: the Meynard square,
which is a big open space. The permanent
soundscape is different in the open spaces and in the
closed ones.
2. EQUIPMENT, RESEARCH METHOD AND
REPRESENTATION DATA
2.1 Equipment
The equipment used was the following:
- Dat recorders (Tascam DA-P1, Sony TCD-D1)
- DAT tapes
- Sennheiser microphones (MKE 2002 and
MKE gold) set as a dummy head called SEB
(Binaural record system).
- Symphonie Card.
- Calibrator.
To transfer the recorded audio signals from the DAT
machine to the computer, we used the 01dB software
dBFa 32. Both the recordings done in Hanoi and in
Bordeaux were carried out using this equipment. (Fig
1)
Figure 1: Sound recording and data analysis
equipment.
2.2 Research method
The method proposed here is based on a new
concept called “the soundwalk”. This kind of
measurement consists on walking along a pre-defined
route on the area under study while recording the
sounds taking place throughout the walk. The walker
has to carry two microphones, positioned next to their
ears so that a binaural recording is done. In order to
achieve the best results we performed the most
appropriate kind of soundwalk on each site: simple,
continuous or parallel. In addition to this method, we
implemented a fixed sound recording method. This
PLEA2006 - The 23
rd
Conference on Passive and Low Energy Architecture, Geneva, Switzerland, 6-8 September 2006
kind of measurement consists on staying on a specific
spot for a certain time (not shorter than 5 minutes)
while recording the sounds taking place there by
means of the binaural recording technique explained
before. Pictures were also taken while doing the
sound recordings. (Fig 2)
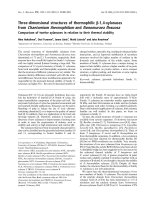
Figure 2 : Soundwalker and sound recording on a
fixed point.
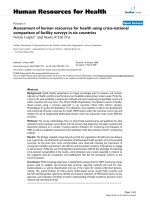
2.3 Data representation
After transferring the recorded signals to a
computer, it is possible to obtain a graphic
representation of the average sound level over
frequency bands (thirds of octave) for a given time
period. A 3D view of that would be a classic
representation. However, a 2D representation, called
the acoustic image, enables an easier data
interpretation by showing the time on the horizontal
axis, the frequency on the vertical one and a range of
colours representing the sound levels. This colour
scheme is explained in a key, which shows the
colours corresponding to the different sound level
bands (10dB bands). [3] (Fig 3)
Figure 3: Acoustic image and its key
3. THE CASE OF HANOI’S OLD TOWN
3.1 Urban morphology features.
As shown below, Hanoi’s old town is a particular
area of the city. It has a specific urban morphology
with narrow streets and small tube houses. Those
factors result in a high number of dwellings per block.
Figure 4 : Hanoi´s old town.
Nowadays, the tube-houses have become
multipurpose spaces where people live and goods are
produced and sold. Most of the production and
trading activities take place by the houses main
ground floor doors and that is the reason why those
doors are usually open. Besides, production activities
require large spaces and opening the main doors,
helps maximize that factor. [1] (Fig 5)
Figure 5: Ground floors in the streets.
3.2 Soundscape features
Hanoi’s old town dates from the seventeenth
century. It linked traditional craft villages to a direct
trade basis. It emerged upon a historic base and
nowadays it has become a big shopping area for the
city. It has every dominant feature of a traditional
commercial quarter. The high population and
circulation densities generate a noisy soundscape
throughout the day. The sounds associated to the
production activities also contribute to make the
soundscape noisy. [4] (Fig 6)
Figure 6 : High population and circulation densities in
the streets.
3.3 Sound recording results.
The sound recordings were done on the ground
floor of a tube house in the block under study. Two
different recordings were done, one of them inside the
PLEA2006 - The 23
rd
Conference on Passive and Low Energy Architecture, Geneva, Switzerland, 6-8 September 2006
house and the other one outside. Both of them were
done in fixed position during 5 minutes. The recording
point chosen for the inside recording is in the middle
of the ground floor. The one chosen for the outside
recording is on the sidewalk outside the house. (Fig 7,
8)
Figure 7 : Plan and section of the house where the
measurements were taken (101, Thuoc Bac St)
Outside recording point Inside recording point
Figure 8 : Outside and inside recording points.
We can clearly see that the distance between the
two recording points is short. The main sound source
is the traffic noise in the street.
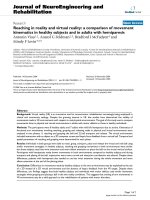
Figure 9: Acoustic images obtained from the outside
recordings.
This acoustic image shows a high noise level in
the street. The noise main level is 60-70dB. We can
also notice that this noise spreads over a very large
frequency area ranging from 31.5Hz to 5Khz. The
sound perception depends directly on the outside
sound sources. The sound level is the same on both
ears. That shows that the traffic on the two-way road
is continuous. The highest sound level (80-90dB) is
due to the mopeds and cars horns. (Fig 9)
a
a
Figure 10 : Acoustic images obtained from the inside
recordings.
The inside recording acoustic image shows a very
different sound level spectral distribution in
comparison to the outside recording one. This is
specially noticeable over the “a” zone where we can
clearly appreciate the tube houses attenuation effect
over certain frequency bands (filtering effect). Both
points´ acoustic images show high sound levels (70-
80 dB) distributed over the same frequencies. The
comparison between the acoustic images reveals the
effect of the diffuse field due to the ground floors
urban form. (Fig 10)
4. BORDEAUX SAINT-MICHEL QUARTER
CASE STUDY
4.1 Urban morphology features.
Saint-Michel quarter is a Bordeaux city centre
specific area. Dominant features of ancient urban
morphology are concentrated there.
Saint-Michel
quarter
Figure 11 : Bordeaux centre.
A typical zone of Saint-Michel quarter was chosen
for the study. The same commercial activities and
trading fashions as in Hanoi´s old town can be found
there. The studied area is divided into small blocks by
PLEA2006 - The 23
rd
Conference on Passive and Low Energy Architecture, Geneva, Switzerland, 6-8 September 2006
narrow streets and dead-ends. Those small blocks
are divided into tenements. The long and narrow
blocks are built one after the other. The empty spaces
as the courtyards and the small square blend in with
the urban structure. Meynard and Duburg squares are
big open spaces next to the studied area. [5] (Fig 11)
Figure 12: Big empty, open spaces.
4.2 Soundscape features:
Three important factors are to be highlighted
around the area under study:
- The high traffic density along Cours Victor Hugo.
- A complex transport junction between Bir-
Hakeim square and Quai des Salinières.
- The commercial and leisure activities in Rue des
Faures and in Saint-Michel square.
The soundscape in Saint-Michel quarter shows
the noise generated by traffic and commercial
activities like in Hanoi’s old town. The trading fashions
in Saint-Michel are outdoors markets, greengrocers
and off-licences. The commercial activity takes place
every morning and it is heavier during the weekend.
[5]
Figure 13 : Rue des Faures and Cours Victor-Hugo.
4.3 Sound recording results.
In order to study the distinctive factors of the open
space of quarter, two sound recordings were
performed: a soundwalk and a recording in fixed
position. Both recordings were done in Rue des
Faures.
Traffic’s
sound source
Soundwalk
p
ath
Cours Victor-Hugo
Quai des
Salinières
Figure 14 : Soundwalk
The soundwalk starts at the beginning of Rue des
Faures. (at its junction with Cours Victor Hugo), goes
across Meynard square (“b” zone), then across
Duburg square (“d” zone) and finally heads towards
Quai des Salinières. The main sound source is the
traffic, which is facing the left ear.
Rue des
Faures
Saint-Michel square Duburg square
b b
Figure 15: Acoustic images obtained from the
soundwalk recording.
The acoustic image shows how the equivalent
sound level spectral distribution is not uniform
throughout the soundwalk. The “b” zone Meynard
square is clearly, an open space where the sound
field is well defined. The equivalent sound level on the
left ear is higher than on the right one because the left
ear is facing the sound source (traffic) whereas the
right one is facing the open space and it does not get
the reflected sounds. Also, the only sound sources in
Meynard Sq. are the human voices. The equivalent
sound level of 50-60dB is mainly caused by the wind.
(Fig 15)
The soundscape features on the fixed recording
points will be now analysed.
Recording point
Traffic’s
sound
source
Figure 16: Fixed recording points
These sound recordings represent specific points
in Rue des Faures. Recording point 1 is located on a
closed space (reflected field) and recording points 2
and 3 are located on an open space (free field). We
are not comparing the results between different
PLEA2006 - The 23
rd
Conference on Passive and Low Energy Architecture, Geneva, Switzerland, 6-8 September 2006
recording points but analysing the soundscape
features around them, especially in the open space
(recording point two). (Fig 16)
Figure 17: Acoustic image obtained from the
recording done on point one.
We can see from the acoustic image obtained
from the recording done on point 1, that the spectrum
is quite different, due to a traffic density reduction.
The equivalent sound level distribution is equivalent
for both ears. However, the equivalent sound level in
“a” zone is different because there is some noise
coming from Cours Victor Hugo. The highest sound
levels (80-90dB) are equally distributed over
frequency on both ears though (‘’b’’ zone). (Fig 17)
Figure 18 : Acoustic image obtained from the
recording performed on point 2.
We can see this acoustic image how the
equivalent sound level spectral distribution is not the
same on both ears. There are noticeable differences
between the left and right ear acoustic images
because the microphones were exposed to different
sound sources in the open space (“c” zone). The
highest sound levels (80-90dB) are equally distributed
over frequency on both acoustic images though (zone
d). (Fig 18)
We can notice how the equivalent sound level
over the low frequencies is the same on recording
points 1 and 2. That means that the sound source is
quite powerful.
Some general observations about the specific
soundscape and urban morphology features in
Hanoi´s old town and Saint-Michel quarter in
Bordeaux are the following:
- The traffic noise influence on the soundscape is
quite noticeable.
- The equivalent noise level is the same on both
studied areas.
- The equivalent sound level spectral distribution
is different on each sound field. In the “U” shaped
streets in Hanoi, the sound field is clearly diffuse due
to the urban form of the ground floors. However, the
equivalent sound level spectral distribution is uniform
in the street and not inside the houses. In Saint-
Michel quarter in Bordeaux, the sound distribution is
uniform in the “U” shaped streets (diffuse sound field)
but it is not in the open space.
b b
a
5. CONCLUSION
a
Our conclusion is that both sites (Hanoi´s old town
and Saint-Michel quarter in Bordeaux) soundscape
analysis enables a main urban morphology features
definition. This analysis helps us to have an exact
observation of urban morphology through
soundscapes.
ACKNOWLEDGEMENT
The author wants to thank Ivan Ricoy, sound
engineer, for his help during his training course at
GRECAU.
REFERENCES
[1] Les Cahiers de l’Ipraus, Hanoi-Le cycle des
métamorphoses, Edition Recherche/Ipraus, 2001.
d d
[2] Etude pédagogique, Analyse des places et
programme d’aménagement, École d’Architecture et
de Paysage de Bordeaux, 1996-1997.
[3] C. Semidor, The soundscape as a component of
urban comfort : the case of Place Paul Doumer, 22
th
PLEA, Beirut, Libanon, 13-16 November 2005.
c c
[4] T.A. Nguyen, Morphologie urbaine traditionnelle et
ambiances sonores dans l'ancien quartier de Hanoi,
Symposium BMB, Bordeaux, 5-7 Avril 2005.
[5] T.A. Nguyen, C. Semidor, Relationship between
urban activities and soundcape: commercial areas in
Bordeaux and Hanoi, 23
th
PLEA, Geneva,
Switzerland, 6-8 September 2006.