Influence of fat content on physico chemical and oxidative stability of foal liver pâté
Bạn đang xem bản rút gọn của tài liệu. Xem và tải ngay bản đầy đủ của tài liệu tại đây (300.71 KB, 6 trang )
Influence of fat content on physico-chemical and oxidative stability
of foal liver pâté
José M. Lorenzo
⁎
, Mirian Pateiro
Centro Tecnológico de la Carne de Galicia, Rúa Galicia Nº 4, Parque Tecnológico de Galicia, San Cibrán das Viñas, 32900 Ourense, Spain
abstractarticle info
Article history:
Received 7 February 2013
Received in revised form 10 April 2013
Accepted 13 April 2013
Keywords:
Fat content
Foal liver pâté
Lipid and protein oxidation
Physico-chemical properties
The effect of fat content on physico-chemical properties and lipid and protein stability offoalliver pâté was stud-
ied. For this purpose, two batches (10 units per batch) of foal liver pâté with different pork back fat content [30%
(30F) and 40% (40F)] were manufactured.
30F foal liver pâté was darker (lower L* value, P > 0.05), redder (higher a*, P b 0.001) and harder (higher hard-
ness value; P b 0.001) compared to those with 40F. Fat level was closely related to the calorific value of foal liver
pâté, being more calorific in those with higher fat contents (352 kcal/100 g; P b 0.001). Regarding total Fe con-
tent, 30F foal liver pâté showed the higher value (4.19 mg/100 g; P b 0.01). Oxidative stability of foal liver pâté
was influenced by fat level. 40F foal liver pâté presented higher TBARS and lower carbonyl contents compared to
30F ones (P b 0.001). Finally, foal pâtés with the two different fat contents had significantly (P b 0.001) different
n− 6/n− 3 ratios, foal liver pâtés with 30F showed the lowest values (9.97) compared to those with 40F content
(13.41).
© 2013 Elsevier Ltd. All rights reserved.
1. Introduction
Liver pâté, a traditional cooked meat product consumed in many
countries, particularly in Europe (Denmark, France, Germany, Spain),
is usually considered to be of high quality (Le Ba & Zuber, 1996). It con-
sists of minced liver, fat and meat mixed with water and different addi-
tives, and is packed in glass containers and thermally treated. This
product is characterized by its high iron content, in some cases provid-
ing up to 40% of daily requirements (Mataix & Aranceta, 2002). Due to
its chemical composition (high amounts of fat and non-heme iron,
and low content of natural antioxidants) and its manufacturing
process, this product is susceptible to lipid oxidation (Estévez,
Ramírez, Ventanas, & Cava, 2007; Russell, Lynch, Lynch, & Kerry, 2003).
Horse meat is characterized by low fat (6.63 g/100 g) and cholester-
ol contents (61 mg/100 g), and is rich in iron (3.89 mg/100 g) and vita-
min of the B group (Badiani, Nanni, Gatta, Tolomelli, & Manfredini,
1997). This meat has a favorable dietetic fatty acid profile, with a high
content of unsaturated fatty acids relative to saturated acids and con-
tains a greater proportion of components from the α-linolenic fatty
acid family (Lorenzo, Fuciños, Purriños, & Franco, 2010; Sarriés,
Murray, Troy, & Beriain, 2006; Tateo, De Palo, Ceci, & Centoducati,
2008). These nutritional characteristics mean that this type of meat
may be considered as an alternative meat (Robelin, Boccard,
Martin-Rosset, Jussiaux, & Trillaud-Geyl, 1984). Consumption has in-
creased in recent years, with Spain being the fourth major producer of
horse meat in the U.E. in 2009 with 6400 tons (FAOSTAT, 2009), but is
still not comparable to the consumption of other meats such as beef,
chicken or pork (Franco et al., 2011; Lombardi-Boccia, Lanzi, & Aguzzi,
2005). These increases might be due to changes in attitude towards
this type of meat and the wish of consumers to taste new meat products
(Hoffman & Wiklund, 2006; Sarriés et al., 2006). The meat is mainly
consumed as fresh meat however, it is starting to be used in the manu-
facture of meat products, such as dry-cured sausages (Lorenzo,
Temperán, Bermúdez, Cobas, & Purriños, 2012). Although, foal meat
represents a good alternative for these products, some manufactures
add pork fat to compensate for its low fat content.
Several studies have evaluated the meat quality of foal fresh meat
(Franco et al., 2011; Juárez et al., 2009; Lanza, Landi, Scerra, Galofaro,
& Pennisi, 2009; Lorenzo et al., 2010; Sarriés & Beriain, 2005, 2006;
Sarriés et al., 2006; Tateo et al., 2008), but there is little information
about the physico-chemical and nutritional quality of products made
withthis meat (Lorenzo et al., 2012).These types of productswould uti-
lize the parts of the carcass that have less value for fresh consumption.
Some studies concerning the physico-chemical characteristics of
pork, duck, goat and ostrich liver pâté (Dalmás, Bezerra, Morgano,
Milani, & Madruga, 2011; Delgado-Pando, Cofrades, Rodríguez-Salas, &
Jiménez-Colmenero, 2011; Estévez, Morcuende, Ramírez, Ventanas, &
Cava, 2004; Estévez, Ventanas, & Cava, 2005; Estévez, Ventanas, Cava,
& Puolanne, 2005; Fernández-López, Sayas-Barberá, Sendra, &
Pérez-Álvarez, 2004; Russell et al., 2003) have been carried out. Howev-
er, foal meat has never been used in the production of these products.
Furthermore, the level of fat has been demonstrated to influence the
nutritional and sensory characteristics of these products (M. Estévez,
S. Ventanas et al., 2005; M. Estévez, J. Ventanas et al., 2005). The aim
of this work is to develop a new value-added foal pâté and study the
Meat Science 95 (2013) 330–335
⁎ Corresponding author. Tel.: +34 988 548 277; fax: +34 988 548 276.
E-mail address: (J.M. Lorenzo).
0309-1740/$ – see front matter © 2013 Elsevier Ltd. All rights reserved.
/>Contents lists available at SciVerse ScienceDirect
Meat Science
journal homepage: www.elsevier.com/locate/meatsci
effect of different fat levels on the physico-chemical and oxidation sta-
bility characteristics of this product.
2. Material and methods
2.1. Manufacture of the foal liver pâté
Two different formulations of foal liver pâté were considered, differ-
entiated in terms of fat content [30% fat (30F) and 40% fat (40F)]. The
pâtés were prepared in the pilot plant of the Meat Technology Center
of Galicia. The composition of each sample is presented in the Table 1.
Foal liver, foal meat (from the hind quarter, composed principally of
gluteus medius,semitendinosus and semimembranosus muscles) and
subcutaneous fat from commercial slaughter pigs was used as the
main ingredients. Foal meat used to the manufacture of pâté had a
chemical composition of 76.3% moisture, 20.8% protein and 1.5% fat,
while foalliver had values of 69.9%, 23.6% and 1.0% for moisture, protein
and fat, respectively. The fatty acid profile of liver, muscle and adipose
tissue is shown in Table 2. The day before the preparation, liver and
foal meat were ground through 10 mm diameter mincing plate in a
cooled chopped (La Minerva, Bologna, Italy) at 4 °C and mixed with
the nitrificant ingredients (sodium chloride, sodium nitrite and sodium
ascorbate). This blend was kept in darkness and refrigerated until the
following day. On the day of manufacture, the fat was chopped using
the same conditions used for the meat and liver, and heated in water
to 65 °C. Then, the remaining ingredients were added,sodium caseinate
to the heated fat, and water, milk powder and potassium phosphates to
the meat mixture. Finally, both mixtures were blended to obtain a ho-
mogeneous raw paste. The liver pâtés were packed in glass containers
prior to thermal treatment (80 °C/30′). The samples were cooled in a
blast chiller (−21 °C/30′) and then analyzed.
2.2. Analytical methods
2.2.1. Physico-chemical analysis
The pH of samples was measured using a digital pH-meter (Thermo
Ori on 710 A+, Cambridgesh ire, UK) equipped wit h a penetration
pro be. Color measurements were carried out using a CR-600 color-
imeter (Minolta Chroma Meter Measuring Head, Osaka, Japan ).
Three measurements were p erformance for each sample. CIELAB
space (CIE, 1976): lightness, (L*); redness, (a*); yellowness, (b*)
were obtained. Before each series of measurements, the instrument
was calibrated using a white ceramic tile. Hue (h
ab
) and chroma (C*)
were calculated from the a* and b* values according to the formula:
C
Ã
¼
ffiffiffiffiffiffiffiffiffiffiffiffiffiffiffiffiffiffiffiffiffiffiffiffiffiffiffi
a
Ã
ðÞ
2
þ b
Ã
ðÞ
2
q
and h
ab
¼ acr tan
b
Ã
a
Ã
:
Moisture, fat, protein (Kjeldahl N × 6.25) and ash were quanti-
fied according to the ISO recommended standards 1442:1997 (ISO,
1997), 1443:1973 (ISO, 1973), 937:1978 (ISO, 1978), and 936:1998
(ISO, 1998), respectively. Briefly, moisture percentage was calculated
by weight loss of the sample (5 g) maintained in an oven (Memmert
UFP 600, Schwabach, Germany) at 105 °C, until constant weight. Ash
percentage was calculated by weight loss of the sample (5 g) in a muffle
furnace (Carbolite RWF 1200, Hope Valley, Englan d) in a porcelain
capsule at 600 °C until constant weight. For fat content samples
(2 g) were subjected to a liquid–solid extraction using petroleum
ether in an extractor (Ankom
HCI
Hydrolysis Syste m, Macedon NY,
USA) for 90 min. Fat content was calculated by gravimetric differ-
ence. Protein content was determined according to Kjeldahl total ni-
trogen method, multiplying the total nitrogen content by 6.25. A
sample (1 g) was reacted with sulfuric acid (cupric sulfate was
employed as a catalyst) in a digester (Gerhardt Kjeldatherm KB,
Bonn, Germany). Organic nitrogen was transformed to amm onium
sulfate, which was distilled in alkali conditions (Gerhardt Vapodest
50 Carrousel, Bonn, Germany).
2.2.2. Total Fe content
Five gram (5.000 ± 0.001 g) samples were weighed into porce-
lai n crucibles for total Fe analysis. The foal pâté samples were incin-
erated in a furnace at 450 °C for 12 h. The ash was dissolved in 10 mL
of 1 M HNO
3
. For the determination of Fe this soluti on was used
directly.
The quantifica tion of total Fe content was performed by induc-
tively coupled plasma-optical emission spectrosc opy (ICP-OES),
using a Thermo-Fisher ICAP 6000 plasma emission spectrometer
(Thermo-Fish er, Cambridge, UK), equipped with a radio frequency
source of 27.12 MHz, a peristaltic pump, a spraying chamber and a
concentric spray nebulizer. The system was totally controlled by ICP
software using 99.996% liquid argon plasma gas (Praxair, Madrid,
Spain). Operating conditions of the ICP-OES equipment were: reflected
power, 1150 W; nebulizer gas flow, 0.7 L/min; auxiliary argon flow,
0.5 L/min; main argon flow, 12 L/min; background correction, 2 points;
Table 1
Recipe used for the preparation of foal liver pâtés with different fat contents.
Ingredients (%) 30F 40F
Foal meat 20 10
Foal liver 33 33
Porcine back fat 30 40
Water 11.5 11.5
Sodium chloride 2 2
Milk powder 2 2
Sodium caseinate 1 1
Potassium phosphate 0.5 0.5
Sodium nitrite 0.05 0.05
Sodium ascorbate 0.025 0.025
Table 2
Fatty acid composition (means ± SD) of liver, muscle and adipose tissue.
Liver (from foal) Muscle
(from foal)
Adipose tissue
(from pork)
P value SEM
C14:0 0.45 ± 0.03
a
2.29 ± 0.09
c
1.24 ± 0.01
b
0.000 0.33
C15:0 0.21 ± 0.02
b
0.31 ± 0.02
c
0.00 ± 0.00
a
0.001 0.06
C16:0 16.58 ± 0.27
a
25.07 ± 0.21
c
23.24 ± 0.12
b
0.000 1.63
C16:1cis-9 1.28 ± 0.03
a
2.55 ± 0.07
b
2.84 ± 0.01
c
0.000 0.30
C17:0 0.63 ± 0.03
c
0.51 ± 0.01
b
0.25 ± 0.03
a
0.002 0.07
C17:1cis-9 0.20 ± 0.01 0.51 ± 0.19 0.26 ± 0.01 0.124 0.07
C18:0 20.88 ± 0.09
c
6.20 ± 0.08
a
11.36 ± 0.07
b
0.000 2.72
C18:1cis-9 9.85 ± 0.92
a
15.94 ± 0.30
b
43.40 ± 0.15
c
0.000 6.52
C18:2n−6 31.64 ± 0.06
c
16.88 ± 0.75
b
14.64 ± 0.13
a
0.000 3.37
C20:0 0.12 ± 0.02
b
0.02 ± 0.02
a
0.09 ± 0.02
ab
0.045 0.02
C20:1 0.17 ± 0.01
a
0.21 ± 0.02
a
0.80 ± 0.01
b
0.000 0.12
C18:3n−3 12.05 ± 0.11
b
25.31 ± 0.46
c
0.86 ± 0.02
a
0.000 4.47
C20:2 0.29 ± 0.01
b
0.24 ± 0.01
a
0.60 ± 0.01
c
0.000 0.07
C20:3n−6 0.44 ± 0.01
c
0.28 ± 0.02
b
0.05 ± 0.02
a
0.001 0.07
C20:3n−3 0.49 ± 0.03
b
0.68 ± 0.01
c
0.10 ± 0.01
a
0.000 0.11
C20:4n−6 3.84 ± 0.09
c
1.82 ± 0.22
b
0.24 ± 0.01
a
0.000 0.66
C20:5n−3 0.12 ± 0.16 0.13 ± 0.09 0.00 ± 0.00 0.505 0.04
C22:6n−3 0.47 ± 0.03
c
0.27 ± 0.03
b
0.00 ± 0.00
a
0.001 0.08
SFA 38.89 ± 0.48
c
34.78 ± 0.24
a
36.18 ± 0.23
b
0.003 0.77
MUFA 11.59 ± 0.95
a
19.36 ± 0.41
b
47.30 ± 0.14
c
0.000 6.86
PUFA 49.51 ± 0.47
c
45.85 ± 0.66
b
16.51 ± 0.09
a
0.000 6.60
TUFA 61.10 ± 0.48
a
65.21 ± 0.24
c
63.81 ± 0.23
b
0.003 0.77
Σn−6 36.38 ± 0.13
c
19.45 ± 0.99
b
15.54 ± 0.11
a
0.000 4.05
Σn−3 13.12 ± 0.33
b
26.39 ± 0.33
c
0.97 ± 0.02
a
0.000 4.64
n− 6/n− 3 2.77 ± 0.06
b
0.73 ± 0.05
a
16.05 ± 0.28
c
0.000 3.03
SFA/TUFA 0.64 ± 0.01
b
0.53 ± 0.01
a
0.56 ± 0.05
a
0.004 0.02
Results expressed as percentage of total fatty acid analyzed.
SEM: Standard error of mean.
PUFA = Σ (C18:2n−6 + C18:3n− 3 + C20:2 + C20:3n6 + C20:3n3 + C20:4n−
6 + C20:5n3 + C22:6n3).
MUFA = Σ (C16:1cis-9 + C17:1cis-9 + C18:1cis-9 + C20:1).
TUFA = Σ MUFA + PUFA.
SFA = Σ (C14:0 + C15:0 + C16:0 + C17:0 + C18:0 + C20:0).
Σn− 6=Σ(C18:2n− 6 + C20:3n− 6 + C20:4n−6).
Σn− 3=Σ(C18:3n− 3 + C20:3n− 3 + C20:5n3 + C22:6 n−3).
331J.M. Lorenzo, M. Pateiro / Meat Science 95 (2013) 330–335
integration and reading time, 5 s; replicate number, 3; height of vertical
observation, 19 mm; nebulizer pressure, bar and radial torch configura-
tion. The operating wavelength was 259.940 nm. Stock solution
(1000 mg/L; SCP-SCIENCE, Countaboeuf, France) was used for prepar-
ing the standard solutions in 4% HNO
3
, v/v. The concentration range
was 0.01 to 50 mg /kg of Fe. The final value was the average of three de-
terminations. The results were expressed in mg/100 g of pâté.
2.2.3. Analysis of heme iron
Total heme pigments in the samples were determined as hemin
after extraction with acidified acetone solution (Hornsey, 1956). Briefly,
fresh meat samples (5 g) were dissolved in 1 mL deionized water,
0.5 mL concentrated HCl (37%) and 20 mL of acetone in glass test
tubes. The tubes were sealed to reduce evaporation, held at room tem-
perature in darkness to minimize pigment fading during the 24 h ex-
traction and then filtered through 0.45 μm (Filter Lab, Spain). The
absorbance was measured (Agilent 8453, Waldbronn, Germany) at
512 nm. The heme iron content was calculated with the factor
0.0882 μgiron/μg hematin. All samples were assayed in duplicate. The
results were expressed as mg/100 g of pâté.
2.2.4. Analysis of non-heme iron
The non-heme iron was determined by the ferrozine method
(Purchas, Simcock, Knight, & Wilkinson, 2003). Briefly, dry samples
of meat (500 mg) were ground using a mortar and pestle, dissolved
in a mixture of 3 mL of 0.1 M citrate phosphate buffer (pH 5.5) and
1 mL of 2% ascorbic acid (as reducing agent) in 0.2 M HCl and left to
stand at room temperature for 15 min before adding 2 mL of 11.3%
trichloroacetic acid. After centrifugation at 3000 g for 10 min the su-
pernatant was removed. To 2 mL of the supernatant, 0.8 mL of 10%
ammonium acetate and 0.2 mL ferrozine reagent (40 mM) were
added and the absorbance was measured at 562 nm. Concentrations
were obtained using a standard curve from 0 to 5 mg of iron/L
made with ferrous sulfate heptahydrate (Panreac Química S.L.U., Bar-
celona, Spain). All samples were assayed in duplicate. The results
were expressed in mg/100 g of pâté.
2.2.5. Gross energy determination
The gross energy (the heats of combustion of protein, fat and car-
bohydrate) was determined in duplicate using an automatic adiabatic
bomb calorimeter (Parr 6100, Parr Instrument Company, USA), cali-
brated with benzoic acid. The process essentially involves measuring
the energy evolved on total combustion of the sample in a stream of
oxygen. The results were expressed in kcal/100 g of pâtés.
2.2.6. Texture measurement
The Texture Analyzer (TA-XT.plus, Stable Micro Systems, Vienna
Court, UK) was used (Bourne, 1978). The penetration test was carried
out at room temperature (22 °C) and performed with a 6 mm diam-
eter penetration probe linked to a 5 kg cell at a velocity of 0.8 mm/s
and for a distance of 8 mm. Hardness (kg/cm
2
), cohesiveness, springi-
ness, gumminess (kg/cm
2
) and chewiness (kg) were obtained using
the available computer software (TEE32 Exponent 4.0.12. Stable Micro
Systems, Vienna Court, UK).
2.2.7. Lipid oxidation
Lipid stability was evaluated using the method proposed b y
Vyncke (1975).Briefly, a meat sample (2 g) was dispersed in 5% tri-
chloroacetic acid (10 mL) and homogenized in an Ultra-Turrax (Ika
T25 basic, Sta ufen, Germany) for 2 min. The homogenate was
maintained at − 10 °C for 10 min and centrifuged at 2360 g for
10 min. The supernatant was filtered through a Whatman No. 1 fil-
ter paper. The filtrate (5 mL) was reacted with a 0.02 M TBA solu-
tion (5 mL) and incubated i n a water bath at 96 °C for 40 min.
The absorbance was measured at 532 nm. Thiobarbituric acid reac-
tive substances (TBARS ) values were calculated fro m a standard
curve of malonaldehyde with 1,1-3,3 tetraetoxipropane (TEP) and
expressed as mg MDA/kg sample.
2.2.8. Protein oxidation
Protein carbonyls, as measured by the total carbonyl content,
were quantified as described by Oliver, Ahn, Moerman, Goldstein,
and Stadtman (1987). Meat samp les were homogenized in 20 mL
of 0.15 M KCl buffer for 60 s using an Ultra-Turrax (Ika T25 b asic,
Staufen, Germany). Two aliquots of homogenate (0.1 mL) were
transferred to Eppendorf vials. Then, proteins were p recipitated in
both aliquots by 10% trichloroacetic acid (TCA) (1 mL) and centri-
fuged for 5 min at 5000 g. One pellet was treated with 1 mL of 2 N
HCl (protein quantification) and the other with 1 mL of 2 M HCl
containing 0.2% 2,4-dinitrophenyl hydrazine (DNPH) (carbonyl con-
tent). Both samples were incubated for 1 h at room temperature (shak-
en every 20 min). After incubation, 10% TCA was added (0.8 mL). The
samples were vortexed for 30 s, centrifuged for 5 min at 5000 g and
the supernatant removed. The pellet was washed three times with
1 mL of ethanol-ethyl acetate (1:1 v/v) and then was dried under N
2
gas. Finally the pellet was dissolved in 2 mL of 6 M guanidine HCl in
20 mM sodium phosphate buffer (final pH 6.5), stirred and centrifuged
for 2 min at 5000 g to remove insoluble fragments. Protein concentra-
tion was calculated from the absorbance at 280 nm using bovine
serum albumin (BSA) as standard. The amount of carbonyls was
expressed as nmol of carbonyl per milligramofprotein using an adsorp-
tion coefficient of 21.0 mM
−1
cm
−1
at 370 nm for protein hydrazones.
2.2.9. Analysis of fatty acid methyl esters
Fat was extracted from 5 g of foal pâté, according to Folch, Lees,
and Stanley (1957). Lipid extracts were evaporated to dryness
under vacuum at 35 °C and stored at − 80 °C until analysis. Lipids
were transesterified with a solution of boron trifluoride (14%) in
methanol, as described by Carreau and Dubacq (1978). Fifty milli-
grams of the extracted lipids were esterified and the FAMEs were
stored at − 80 °C until chromatographic analysis.
Separation and quantification of FAMEs was carried out using a gas
chromatograph, GC-Agilent 6890N (Agilent Technologies Spain, S.L.,
Madrid, Spain) equipped with a flame ionization detector and an auto-
matic sample injector H P 7683, and using a Supelco SPTM-2560 fused
silica capillary column (100 m, 0.25 mm i.d., 0.2 μm film thickness,
Supelco Inc., Bellafonte, PA, USA). Chromatographic conditions were as
follows: initial oven temperature 120 °C (held for 5 min), first ramp at
2 °C/min to 170 °C (held for 15 min), second ramp at 5 °C/min to
200 °C (held for 5 min) and third ramp at 2 °C/min to a final tempera-
ture of 235 °C (held for 10 min). The injector and detector were
maintained at 260 and 280 °C respectively. Helium was used as carrier
gas at a constant flow-rate of 1.1 mL/min, with the column head pres-
sure set at 35.56 psi. 1 μL of solution was injected in split mode (1:50).
The fatty acids were quantified using nonadecanoic acid methyl ester
at 0.3 mg/mL, as internal standard, it was added to samples prior to fat
extraction and methylation. Identification of fatty a cids was performed
by comparison of the retention times with those of known fatty acids
and the results expressed as a percentage of total fatty acids identified.
The proportion of polyunsaturated (PUFA), monounsaturated (MUFA),
total unsaturated (TUFA) and saturated (SFA) fatty acid contents, and
SFA/TUFA, n− 6/n− 3 and nutritional ratio were calculated.
2.3. Statistical analysis
An analysis of variance (ANOVA) of one way using SPSS package
(SPSS 19.0, Chicago, IL, USA) was performed for all variables in the
study. The least squares mean (LSM) were separated using Duncan's
t-test. All statistical tests of LSM were performed for a significance
level α b 0.05. Correlations between variables were determined by
correlation analyses using Pearson's linear correlation coefficients
using the above statistical software package.
332 J.M. Lorenzo, M. Pateiro / Meat Science 95 (2013) 330–335
3. Results and discussion
3.1. Effect of fat content on chemical composition of foal liver pâtés
The results for the foal pâtés manufactured with different fat levels
are presented in Table 3. As expected, the differences in formulation
(Table 1) produced significant changes in the proximate composition
of the pâtés. 30F foal pâtés had a higher water content than the 40F
batch (54.04 vs. 52.48%, P = 0.055). Pearson correlation indicated that
moisture contents were positively related to the color attribute, a*
(r = 0.53, P b 0.01), in agreement with M. Estévez, S. Ventanas et al.
(2005) and Delgado-Pando et al. (2011) who found higher water levels
in low-fat pâtés. Fat and protein content were also significantly affected
by the fat level showing the opposite behavior. Protein c ontent
followed the decreasing order: 30F > 40F (P b 0.001). In contrast,
40F foal pâtés had a higher fat content (26.33 g/100 g foal pâtés)
than 30F (23.20 g/100 g foal pâtés) (P b 0.001). These results agree
with M. Estévez, S. Ventanas et al. (2005) who found higher protein
content and lower fat contents in low-fat pâtés. Regarding ash content,
fat level did not significantly affect the batches (3.25–3.26 g/100 g foal
pâtés; P = 0.932). Pinho, Ferreira, Casal, Oliveira, and Ferreira (1998)
found in15 brands of bovine liver pâtés on sale in Portugal, a moisture
content of 53.4%, similar to the present study. The same authors found
11.8% protein, 29.4% fat and 2.6% ash. In comparison to bovine pâtés,
the 30F foal pâtés had higher ash and protein contents, and lowervalues
for lipids, showing that the 30F foal pâtés could have consumer appeal,
being healthier, low-fat meat products.
With reference to the chemical forms of iron, significant differ-
ences (P ≤ 0.001) between groups were found (Table 3). The total
Fe content was higher in pâtés with 30F (4.19 mg/100 g) compared
to those with h igh-fat content (3.61 mg/100 g) (P = 0.001). The re-
sults agree with M. Estévez, S. Ventanas et al. (2005), who found
higher levels of total Fe in pâtés samples with low-fat content. The
content of heme iron was si gnificantly (P = 0.000) higher in 30F
foal pâtés samples (2.50 mg/100 g) as compared to those with
high-fat content (2.22 mg/100 g). On the other ha nd, the levels of
non-heme iron were sig nificantly (P = 0.001) higher in 40F foal
pâtés samples (1.14 mg/100 g) than the other one (1.01 mg/100 g).
These results are similar to those reported by M. Estévez, S. Ventanas
et al. (2005), who observed that fat reduction causes increased heme
iron and decreased non-heme iron. Fe deficiency is the most prevalent
nutritional disorder in the world, especially in developing countries.
Knowledge of the levels of total, heminic and non-heminic Fe in meat
is of importance, because of the differences in bioavailability of these
forms of Fe (Lombardi-Boccia, Martínez-Domínguez, & Aguzii, 2002).
Foal pâtés from the two different fat content presented signifi-
cantly different caloric values, bein g highe r in those with high-fat
content (40F: 352.55 kcal/100 g pâtés and 30F: 315.88 kcal/100 g
pâtés, P = 0.000). Thes e results are logical in view of the different
fat contents and agree with those reported by (Delgado-Pando et al.,
2011; M. Estévez, S. Ventanas et al., 2005) who found lower energy con-
tents in the low-fat pâtés. The caloric values were positively related
(P b
0.01) to fat level (r = 0.63) and negatively related (P b 0.01) to
protein content (r = − 0.67).
3.2. Effect of fat content on physical properties of foal liver pâtés
Table 4 shows the physical properties of foalliver pâtés with the two
different fat contents. No significant differences were found in pH. 40F
foal pâtés samples presented higher pH values and are in agreement
with those reported by M. Estévez, S. Ventanas et al. (2005).Thevalues
obtained (6.68–6.69) were slightly higher to those described for this
type of product (Delgado-Pando et al., 2011; M. Estévez, S. Ventanas
et al., 2005; Fernández-López et al., 2004; Hong, Lee, & Min, 2004). pH
was positively correlated with fat content (r = 0.44; P b 0.05).
Color parameters were affected by fat content (Table 4). These re-
sults were expected because the color of pâtés is closely relat ed to
the color properties of raw material used for the formulation (M.
Estévez, J. Ventanas et al., 2005) and therefore , changes in the pro-
por tions of the ingredients might lead to different colors. The results
indicated that higher contents of fat and lower contents of meat, in-
creased lightness and reduced redness in the samples. The 40F foal
pâtés samples were lighter than the 30F samples (54.21 vs. 52.97;
P > 0.05, respectively) and was positively correlated with fat con-
tent (r = 0.39; P b 0.05) and negatively related with prot ein con-
tent (r = −0.48; P b 0.01). 30F foal pâtés samples were redder
than 40F samples (a* values: 9.27 vs. 8.06, P b 0.001). a* values
were negatively related (P b 0.01) to fat content (r = -0.53) and
positively correlated with protein content (r = 0.58). Consequently,
30F foal pâtés samples had a more intense color (Chroma values:
16.33 vs. 15.55; P b 0. 01) with lower values of hue (55.37 vs. 58.78;
P b 0.001) compared to foal pâtés with higher fat levels.
As expected, the manufacture of foal pâtés with increasing fat levels
resulted in products with different textural properties (Table 4). Fat re-
duction increased hardness (0.22 vs.0.37kg;Pb 0.001 for 40F and 30F
groups, respectively), chewiness (0.11 vs. 0.19 kg mm; P b 0.001 for
40F and 30F groups, respectively), gumminess (0.11 vs.0.21kg;
P b 0.001 for 40F and 30F groups, respectively) and cohesiveness
(0.49 vs.0.54;Pb 0.01 for 40F and 30F groups, respectively). Fat con-
tent was negatively correlated (P b 0.01) with hardness (r = −0.54),
chewiness (r = − 0.51) and gumminess (r = −
0.53); and protein
content was positively related (P b 0.01) with hardness (r = 0.85),
chewiness (r = 0.82) and gumminess (r = 0.83).
This behavior is in agreement with M. Estévez, S. Ventanas et al.
(2005) in liver pâtés, who observed that fat reduction i ncreased
hardness. Howe ver, o ther a uthors (Delgado-Pando et al., 2011;
Viana, Silva, Delvivo, Bizzotto, & Silvestre, 2005)foundthatfatre-
duction decreased (P b 0.05) penetration force, or had no effect on
Table 4
pH, color parameters and instrumental texture of foal liver pâtés from foal with differ-
ent fat levels (means ± SD).
Fat content SEM P-values
30F 40F
pH 6.68 ± 0.02 6.69 ± 0.01 0.01 0.281
Color parameters
Luminosity (L*) 52.97 ± 2.01 54.21 ± 1.37 0.40 0.127
Redness (a*) 9.27 ± 0.41 8.06 ± 0.32 0.16 0.000
Yellowness (b*) 13.43 ± 0.48 13.30 ± 0.54 0.11 0.564
Chroma (C*) 16.33 ± 0.51 15.55 ± 0.59 0.15 0.006
Hue (h
ab
) 55.37 ± 1.31 58.78 ± 0.73 0.45 0.000
TPA test
Hardness (kg) 0.37 ± 0.07 0.22 ± 0.05 0.02 0.000
Springiness (mm) 0.91 ± 0.03 0.94 ± 0.04 0.01 0.171
Chewiness (kg mm) 0.19 ± 0.05 0.11 ± 0.03 0.01 0.000
Gumminess (kg) 0.21 ± 0.05 0.11 ± 0.03 0.01 0.000
Cohesiveness 0.54 ± 0.03 0.49 ± 0.02 0.01 0.005
Table 3
Chemical composition and energy content of foal liver pâtés with different fat levels
(means ± SD).
Fat content SEM P-values
30F 40F
Moisture (%) 54.04 ± 2.24 52.48 ± 0.86 0.41 0.055
Fat (%) 23.20 ± 0.92 26.33 ± 1.53 0.45 0.000
Protein (%) 16.16 ± 0.58 14.99 ± 0.59 0.18 0.000
Ash (%) 3.25 ± 0.20 3.26 ± 0.06 0.03 0.932
Total iron (mg/100 g) 4.19 ± 0.28 3.61 ± 0.39 0.10 0.001
Heme iron (mg/100 g) 2.50 ± 0.18 2.22 ± 0.09 0.04 0.000
Non-heme iron (mg/100 g) 1.01 ± 0.11 1.14 ± 0.03 0.02 0.001
Energy content (kcal/100 g) 315.88 ± 12.48 352.55 ± 3.60 4.65 0.000
333J.M. Lorenzo, M. Pateiro / Meat Science 95 (2013) 330–335
the textural parameters (Lurueña-Martínez, Vivar-Quintana, &
Revilla, 2004; Ordónez, Rovira, & Jaime, 2001).
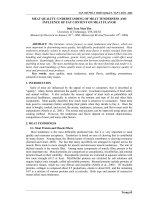
3.3. Effect of fat content on oxidative stability of foal liver pâtés
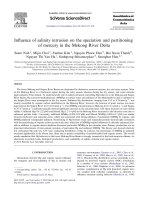
The oxidative stability of foal liver pâtés, as measured by TBARS
from lipid oxidation and carbonyl content from protein oxidation, is
shown in Fig. 1. The fat level presented significant differences in
lipid oxidation since 40F foal pâtés showed significantly higher
TBARS values, compared to pâtés with lower fat content (0.54 vs.
0.46 mg MDA/kg pâtés; P b 0.001). These results were expected be-
cause TBARS are derived from lipid oxidation and thus pâtés with
higher fat content would yield higher amounts of oxidation products.
TBARS values were positively correlated (P b 0.01) with fat content
(r = 0.64), agreeing with M. Estévez, S. Ventanas et al. (2005).
Foal pâtés with higher TBARSvalues had lowercontents ofcarbonyls
from protein oxidation (Fig. 1). The carbonyl contents were higher in
pâtés with 30F (14.70 nmol carbonyls/mg protein) as compared to
those with high-fat content (11.48 nmol carbo nyls/mg protein)
(P b 0.001). Among amino a cids, cysteine, tyrosine, phenyl alanine,
tryptophan, histidine, proline, arginine, lysine and methionine have
been desc ribed as particularly susceptible to R OS (reactive oxygen
species ) (Davies & Dean, 2003). Th e nature of the Pox products
formed is highly dependent on the amino acids involved and how
the oxidation process is initiated. The side chains of some particular
amino acids such as arginine, lysine and proline are oxidized through
metal-catalyzed reactions into carbonyl residues while others such as
cysteine or methionine are involved in cross-linking or yield sulfur-
containing derivatives (Lund, Heinonen, Baron, & Estévez, 2011). Car-
bonyl content was positively related (P b 0.01) to protein content
(r = 0.67) and negatively related (P b 0.01) to fat level (r = − 0.57).
These results disagree with M. Estévez, S. Ventanas et al. (2005) who
reported higher carbonyl contents in pâtés manufactured with
high-fat levels.
3.4. Effect of fat content on fatty acid composition of foal liver pâtés
The fatty acid composition of foal liver pâtés of two diffe rent fat
contents is shown in Table 5.Thefattyacidprofiles were dominated
by MUFA “appro ximately 44.6% of total m ethyl esters,” followed by
SFA “approximately 36.9% of total methyl esters” and finally PUFA
“approximately 18.5% of total methyl esters” ( Table 5). These results
are in agreement with other authors for liver pâtés (Estévez et al.,
2004; M. Estévez, J. Ventanas et al., 2005; Ordóñez, D'Arrigo,
Cambero, Pinc, & de la Hoz, 2003) since MUFA were the most abun-
dant o f fatty acids. As expected, the fatty acid profile of the foal
liver pâtés reflected the fatty acid composition of the porcine adipose
tissue (
Table 2) as the proportion of lard in the recipe was the highest
of all ingredients. The higher MUFA contents observed in foal liver
pâtés were very significantly (r = 0.97, P b 0.01) correlated with
C
18:1cis-9
content and significantly (r = 0.58, P b 0.01) with C
16:1cis-9
content. The fat level showed significant differences in MUFA content
(44.30 vs. 44.86%, P = 0.000; for 30F and 40F groups, respectively)
and in PUFA (18.82 vs. 18.23%, P = 0.001; for 30F and 40F groups,
respectively).
Within the MUFA, oleic was the most abundant with significant
dif fere nces between batches (40.64 vs. 41.03%, P = 0.003; for 30F
and 40F groups, respectively), followed by palmitoleic acid . These re-
sults are in agreement with those of Estévez et al. (2004) who found
that oleic acid was the predominant fatty acid in liver pâtés. Within
SFA, the main fatty a cid was palmitic, which did not differ signifi -
cantly between grou ps (22.86 vs. 22.96%, P = 0.188; for 30F and
40F batches, respectively) , in agreement with Estévez et al. (2004),
M. Estévez, J. Ventanas et al. (2005) who observed simila r percent-
ages in liver pâtés. Finally, within PUFA, linoleic acid was predomi-
nan t but did not differ significantly between groups (15.91 vs .
15.82%, P = 0.451; for 30F and 40F batches, respectively), followed
by linolenic acid, which was higher in pâtés with 30F (1.59%) com-
pared to those of higher fat content (1.26%) (P b 0.001).
The nutritional ratio (C
14:0
+C
16:0
)/(C
18:1cis-9
+C
18:2n−6
), which
indicates the healthiness of the diet with regard its lipid content, is im-
portant (Estévez et al., 2004). In the present study, fat content did not
affect (P > 0.05) this ratio. Finally, foal pâtés with the two different
fat contents presented significantly different n−6/n−3 ratios, those
of low-fat content showed the lowest values (9.97) compared to those
with higher fat content (13.41) (P = 0.000). These values were higher
than the nutritional recommendations of the British Department of
Health (1994) and FAO (2010) for the human diet, it should not exceed
4.0.
40F30F
Fig. 1. Lipid and protein oxidative stability of foal liver pâté with different fat content as
assessed by TBARS (mg MDA/kg foal pâté) and carbonyl (nmol carbonyls/mg protein)
contents, respectively (mean ± SD).
Table 5
Fatty acid composition (means ± SD) of foal liver pâtés from foal with different fat levels.
Fatty acid Fat content SEM P values
30F 40F
C14:0 1.18 ± 0.02 1.18 ± 0.02 0.01 0.928
C16:0 22.86 ± 0.15 22.96 ± 0.17 0.04 0.188
C16:1cis-9 2.53 ± 0.04 2.56 ± 0.04 0.01 0.157
C17:0 0.34 ± 0.01 0.33 ± 0.02 0.00 0.183
C17:1cis-9 0.32 ± 0.01 0.31 ± 0.01 0.00 0.584
C18:0 12.32 ± 0.23 12.24 ± 0.14 0.03 0.359
C18:1cis-9 40.64 ± 0.33 41.03 ± 0.14 0.05 0.003
C18:2n−6 15.91 ± 0.25 15.82 ± 0.26 0.06 0.451
C20:0 0.13 ± 0.00 0.13 ± 0.02 0.00 0.891
C20:1 0.80 ± 0.01 0.82 ± 0.02 0.00 0.100
C18:3n−3 1.59 ± 0.13 1.26 ± 0.04 0.03 0.000
C20:2 0.65 ± 0.01 0.66 ± 0.01 0.00 0.513
C20:3n−6 0.10 ± 0.00 0.10 ± 0.00 0.00 0.272
C20:3n−3 0.13 ± 0.00 0.14 ± 0.00 0.00 0.000
C20:4n−6 0.43 ± 0.04 0.39 ± 0.03 0.00 0.011
SFA 36.87 ± 0.24 36.89 ± 0.16 0.05 0.838
MUFA 44.30 ± 0.37 44.86 ± 0.16 0.06 0.000
PUFA 18.82 ± 0.33 18.23 ± 0.29 0.08 0.001
TUFA 63.12 ± 0.24 63.10 ± 0.16 0.05 0.838
Σn−6 17.10 ± 0.28 16.97 ± 0.27 0.06 0.304
Σn−3 1.72 ± 0.13 1.26 ± 0.04 0.04 0.000
n− 6/n− 3 9.97 ± 0.79 13.41 ± 0.42 0.28 0.000
SFA/TUFA 0.59 ± 0.00 0.59 ± 0.00 0.00 0.476
Nutritional ratio 0.43 ± 0.00 0.43 ± 0.00 0.00 0.673
Results expressed as percentage of total fatty acid analyzed.
SEM: Standard error of mean.
PUFA = Σ (C18:2n− 6 + C18:3n− 3 + C20:2 + C20:3n6 + C20:3n3 + C20:4n− 6).
MUFA = Σ (C16:1cis-9 + C17:1cis-9 + C18:1cis-9 + C20:1).
TUFA = Σ MUFA + PUFA.
SFA = Σ (C14:0 + C16:0 + C17:0 + C18:0 + C20:0).
Σn− 6=Σ (C18:2n− 6 + C20:3n−6 + C20:4n−6).
Σn− 3=Σ (C18:3n− 3 + C20:3n−3).
Nutritional ratio = (C14:0 + C16:0)/(C18:1cis-9 + C18:2n−6).
334 J.M. Lorenzo, M. Pateiro / Meat Science 95 (2013) 330–335
4. Conclusions
As expected, fat level affected most of the physico-chemical proper-
ties. Higher fat levels in foal liverpâtés,decreasedrednessand hardness.
Concerning protein and lipid oxidation increased fat level encouraged
the production of TBARS and decreased carbonyl contents. On the
other hand, 30F foal pâtés had a better n−6/n−3 ratio compared to
pâtés of higher fat levels. Using meat and liver from foals and back fat
from pigs for the manufacture of pâtés results in a high quality product
in which the iron is highly bioavailable.
Acknowledgments
Authors are grateful toXunta de Galicia (Conselleria de MedioRural)
for the financial support. Special thanks to Monte Cabalar (A Estrada,
Pontevedra) for the foal samples supplied for this research.
References
Badiani, A., Nanni, N., Gatta, P. P., Tolomelli, B., & Manfredini, M. (1997). Nutrient pro-
file of horsemeat. Journal of Food Composition and Analysis, 10, 254–269.
Bourne, M. C. (1978). Texture profile analysis. Food Technology, 32(62–66), 77.
British Department of Health (1994). Nutritional aspects of cardiovascular diseases. Re-
port on health and social subjects n°46. London: H.M. Stationery Office.
Carreau, J. P., & Dubacq, J. P. (1978). Adaptation of a macro-scale method to the
micro-scale for fatty acid methyl transesterification of biological lipid extracts.
Journal of Chromatography A, 151, 384–390.
CIE (1976). Colorimetry: Official Recommendations of the International Commission on Il-
lumination. Paris: Comisión Internationale de l'Èclairage [International Commis-
sion on Illumination] (CIE No. 15 (E-1.3.1)).
Dalmás, P. S., Bezerra, T. K. A., Morgano, M. A., Milani, R. F., & M adruga, M. S. (2011). Devel-
opment of goat pâté prepared with ‘variety meat’. Small Ruminant Research, 98,46–50.
Davies, M. J., & Dean, R. T. (2003). In Oxford Science Publications (Ed.), Radical-mediated
protein oxidation (Oxford).
Delgado-Pando, G., Cofrades, S., Rodríguez-Salas, L., & Jiménez-Colmenero, F. (2011). A
healthier oil combination and konjac gel as functional ingredients in low-fat pork
liver pâté. Meat Science, 88, 241–248.
Estévez, M., Morcuende, D., Ramírez, R., Ventanas, J., & Cava, R. (2004). Extensively
reared Iberian pigs versus intensively reared white pigs for the manufacture of
liver pâté. Meat Science, 67, 453–461.
Estévez, M., Ramírez, R., Ventanas, J., & Cava, R. (2007). Sage and rosemary essential oils
versus BHT for the inhibition of lipid oxidative reactions in liver pâté. LWT, 40,58–65.
Estévez, M., Ventanas, S., & Cava, R. (2005). Physicochemical properties and oxidative
stability of liver pâtés as affected by bat content. Food Chemistry, 92, 449–457.
Estévez, M., Ventanas, J., Cava, R., & Puolanne, E. (2005). Characterization of a tradition-
al Finnish liver sausage and different types of Spanish liver pâté: A comparative
study. Meat Science, 71, 657–669.
FAO (Food and Agriculture Organization of the United Nations) (2010). Fat and fatty
acid requirements for adults. Fats and fatty acids in human nutrition. Rome, Italy
(pp. 55–62).
FAOSTAT (2009). Online database of the Food and Agriculture Organization of the United
Nations. :Production>livestockprimaryandTrade>TradeSTAT>
Cropsandlivestockproducts
Fernández-López, J., Sayas-Barberá, E., Sendra, E., & Pérez-Álvarez, J. A. (2004). Quality
characteristics of ostrich liver pâté. Journal of Food Science, 69, S85–S91.
Folch, J., Lees, M., & Stanley, G. H. S. (1957). A simple method for the insolation and pu-
rification of total lipids from animal tissues. Journal of Biological Chemistry, 226,
497–509.
Franco, D., Rodríguez, E., Purriños, L., Crecente, S., Bermúdez, R., & Lorenzo, J. M. (2011).
Meat quality of “Galician Mountain” foals breed. Effect of sex, slaughter age and
livestock production system. Meat Science, 88, 292–298.
Hoffman, L. C., & Wiklund, E. (2006). Game and venison — Meat for the modern con-
sumer. Meat Science, 74, 197–208.
Hong, G., Lee, S., & Min, S. (2004). Effects of replacement pork backfat with soybean oil
on the quality characteristics of spreadable liver sausage. Food Science and Biotech-
nology, 13,51–56.
Hornsey, H. C. (1956). The colour of cooked cured pork. I. Estimation of the nitric
oxide-haem pigments. Journal of the Science of Food and Agriculture, 7, 534–540.
ISO (International Organization for Standardization) (1973). Determination of total fat
content, ISO 1443:1973 standard. International standards meat and meat products.
Genève, Switzerland: International Organization for Standardization.
ISO (International Organization for Standardization) (1978). Determination of nitrogen
content, ISO 937:1978 standard. International standards meat and meat products.
Genève, Switzerland: International Organization for Standardization.
ISO (International Organization for Standardization) (1997). Determination of moisture
content, ISO 1442:1997 standard. International standards meat and meat products.
Genève, Switzerland: International Organization for Standardization.
ISO (International Organization for Standardization) (1998). Determination of ash con-
tent, ISO 936:1998 standard. International standards meat and meat products.
Genève, Switzerland: International Organization for Standardization.
Juárez, M., Polvillo, O., Gómez, M. D., Alcalde, M. J., Romero, F., & Valera, M. (2009).
Breed effect on carcass and meat quality of foals slaughtered at 24 months of
age. Meat Science, 83, 224–228.
Lanza, M., Landi, C., Scerra, M., Galofaro, V., & Pennisi, P. (2009). Meat quality and intra-
muscular fatty acid composition of Sanfratellano and Haflinger foals. Meat Science,
81, 142–147.
Le Ba, D., & Zuber, F. (1996). La pasteurisation des foies gras. Viandes et Produits Carnés,
17(4), 151–155.
Lombardi-Boccia, G., Lanzi, S., & Aguzzi, A. (2005). Aspects of meat quality: Trace ele-
ments and B vitamins in raw and cooked meats. Journal of Food Composition and
Analysis, 18,39–46.
Lombardi-Boccia, G., Martínez-Domínguez, B., & Aguzii, A. (2002). Total heme and
non-heme iron in raw and cooked meats. Journal of Food Science, 67, 1738–1741.
Lorenzo, J. M., Fuciños, C., Purriños, L., & Franco, D. (2010). Intramuscular fatty acid
composition of “Galician Mountain” foals breed. Effect of sex, slaughter age and
livestock production system. Meat Science, 86, 825–831.
Lorenzo, J. M., Temperán, S., Bermúdez, R., Cobas, N., & Purriños, L. (2012). Changes in
physico-chemical, microbiological, textural and sensory attributes during ripening
of dry-cured foal salchichón. Meat Science, 90, 194–198.
Lund, M., Heinonen, M., Baron, C. P., & Estévez, M. (2011). Protein oxidation in muscle
foods: A review. Molecular Nutrition & Food Research, 55,83–95.
Lurueña-Martínez, M. A., Vivar-Quintana, A. M., & Revilla, I. (2004). Effect of locust
bean/xanthan gum addition and replacement of pork fat with olive oil on the qual-
ity characteristics of low-fat frankfurters. Meat Science, 68, 383–389.
Mataix, J., & Aranceta, J. (2002). Recomendaciones nutricionales y alimentarias. In J.
Mataix (Ed.), Nutrición y alimentación humana (pp. 247–273). Madrid: Ergon.
Oliver, C. N., Ahn, B. W., Moerman, E. J., Goldstein, S., & Stadtman, E. R. (1987).
Aged-related changes in oxidized proteins. Journal of Biological Chemistry, 262,
5488–5491.
Ordóñez, J. A., D´Arrigo, M., Cambero, M. I., Pinc, C., & de la Hoz, L. (2003). Características
de pâté de hígado de cerdos alimentados con dietas ricas en PUFA n -3 y vitamina E.
Proceedings del Congreso Nacional de Ciencia y Tecnología de Alimentos, Granada, Spain
(pp. 184).
Ordónez, M., Rovira, J., & Jaime, I. (2001). The relationship between the composition
and texture of conventional and low-fat frankfurters. International Journal of Food
Science and Technology, 36, 749–758.
Pinho, O., Ferreira, I. M. P. L. V. O., Casal, S., Oliveira, M. B. P. P., & Ferreira, M. A. (1998).
Apreciac¸ ão da qualidade dos patés de fígado no mercado portugués (Assessing the
quality of liver pâté in the Portuguese market). Ciência y Tecnologia Alimentaria, 2
,
24–32.
Purchas, R. W., Simcock, D. C., Knight, T. W., & Wilkinson, B. H. P. (2003). Variation in
the form of iron in beef and lamb meat and losses of iron during cooking and stor-
age. International Journal of Food Science and Technology, 38, 827–837.
Robelin, J., Boccard, R., Martin-Rosset, W., Jussiaux, M., & Trillaud-Geyl, C. (1984).
Caractéristiques des carcasses et qualities de la viande de cheval. In R. Jarrige, & W.
Martin-Rosset (Eds.), Le Cheval. Reproduction-Sélection-Alimentation-Exploitation
(pp. 601–610). Paris, France: INRA Publications.
Russell, E. A., Lynch, A., Lynch, P. B., & Kerry, J. P. (2003). Quality and shelf life of duck
liver pâté as influenced by dietary supplementation with α-tocopheryl acetate and
various fat sources. Journal of Food Science, 68(3), 799–802.
Sarriés, M. V., & Beriain, M. J. (2005). Carcass characteristics and meat quality of male
and female foals. Meat Science, 70, 141–152.
Sarriés, M. V., & Beriain, M. J. (2006). Colour and texture characteristics in meat of male
and female foals. Meat Science, 74, 738–745.
Sarriés, M. V., Murray, B. E., Troy, D., & Beriain, M. J. (2006). Intramuscular and subcu-
taneous lipid fatty acid profile composition in male and female foals. Meat Science,
72, 475–485.
Tateo, A., De Palo, P., Ceci, E., & Centoducati, P. (2008). Physicochemical properties of
meat of Italian Heavy Draft horses slaughtered at the age of eleven months. Journal
of Animal Science, 86, 1205–1214.
Viana, F. R., Silva, V. D. M., Delvivo, F. M., Bizzotto, C. S., & Silvestre, M. P. C. (2005).
Quality of ham pâté containing bovine globin and plasma as fat replacers. Meat Sci-
ence, 70, 153–160.
Vyncke, W. (1975). Evaluation of the direct thiobarbituric acid extraction method for
determining oxidative rancidity in mackerel (Scomber scombrus L). Fette, Seifen,
Anstrichmittel, 77, 239–240.
335J.M. Lorenzo, M. Pateiro / Meat Science 95 (2013) 330–335