Final report ACKNOWLEDGEMENT
Bạn đang xem bản rút gọn của tài liệu. Xem và tải ngay bản đầy đủ của tài liệu tại đây (410.08 KB, 84 trang )
A TWO-FACTOR MODEL FOR SERVICE QUALITY MANAGEMENT:
THE CONCEPTUAL DEVELOPMENT AND AN APPLICATION TO
CO-OP MART NGUYEN DINH CHIEU, VIET NAM.
by
Ho Dac Nguyen Nga
A research study submitted in partial fulfillment of the requirements for the degree of Master
of Business Administration.
Examination Committee Dr. Do Ba Khang (Chairman)
Dr. Fredric W. Swierczek
Dr. Clemens Bechter
Nationality Vietnamese
Previous degree Bachelor of Civil Engineering
HCMC University of Technology
Ho Chi Minh City, Vietnam
Scholarship donor Government of Switzerland /SDC (SAV)
Asian Institute of Technology
School of Management
Bangkok, Thailand
April 2001
ACKNOWLEDGEMENT
I am most grateful to Dr. Do Ba Khang, my Research Advisor and Chairman of Research
Committee, for his invaluable guidance, constructive suggestions, and constant
encouragement throughout the course of my research study. His profound knowledge and
boundless enthusiasm are a great inspiration for me to conduct this research.
I would like to express sincere thanks to Dr. Fredric W. Swierczek and Dr. Clemens Bechter
for their valuable contribution in serving as Research Committee members, as well as for
their constructive comments and critical suggestions on the research study.
The sincerest thanks come to the Swiss-AIT-Vietnam Management Development
Programme (SAV) and Asian Institute of Technology (AIT), all the faculty members, staffs,
and friends who contribute greatly to my learning progress.
Thanks are also extended to Vietnam Asia Pacific Economic Center (VAPEC), managers
and staffs of many supermarkets in Ho Chi Minh City, especially managers and staffs of
Saigon Co-op, for helping me in data collection.
Last but not least, I would like to express my deep gratitude to my family and my girlfriend,
who provide continuous supports to me during my learning process and the course of this
research study.
i
ABSTRACT
The goal of this research is to investigate the quality level of Co-op Mart Nguyen Dinh
Chieu in the perception of customers in order to help management improve the store’s
quality properly.
For the purpose above, a new quality model, called “Two-factor model”, is developed. This
model measures customer perception towards two factors -attributes performance and
shopping preference of customers- and identifies the relationship of these two factors to
construct the quality perception of customers. The results of this research reveal that Two-
factor model is more appropriate than Servqual in recommending the attributes improvement
priorities.
Primary data of the research is collected through two surveys, one is for supermarket
customers in Ho Chi Minh City and one is for customers of Co-op Mart Nguyen Dinh Chieu.
The former is used to collect general perception about supermarket quality attributes and the
latter is used to identify quality level of Co-op Mart Nguyen Dinh Chieu’s attributes.
Responses from these two surveys are analyzed by Two-factor model to derive characteristic
curve of each attribute as well as current performance, contribution to current shopping
preference of customers, preference gap, and improvement efficiency of each attribute of the
store.
Based on the research findings, recommendations are made to improve the quality of the
store. Quality attributes are classified into 3 main groups. The first group includes attributes
which should be improved. The second group includes attributes which should be improved
after all the attributes of the first group reach their potential. The attributes of the third group
are recommended to be unchanged. Moreover, priorities for improvement of attributes in
each group are also specified. Among attributes which should be improved, quality of
merchandise, agility of locker personnel, hospitality of personnel and variety of product lines
are four attributes which have the highest priorities for improvement. They are the keys to
improve quality of Co-op Mart Nguyen Dinh Chieu.
ii
TABLE OF CONTENTS
Acknowledgement......................................................................................................................i
Acknowledgement......................................................................................................................i
Abstract......................................................................................................................................ii
Abstract......................................................................................................................................ii
Table of Contents.....................................................................................................................iii
Table of Contents.....................................................................................................................iii
List of Figures............................................................................................................................v
List of Figures............................................................................................................................v
List of Tables...........................................................................................................................vii
List of Tables...........................................................................................................................vii
Chapter 1:Introduction............................................................................................................1
Chapter 1:Introduction............................................................................................................1
1.1 Rationale of The Research................................................................................................1
1.2 Problem Statement............................................................................................................1
1.3 Research Objectives..........................................................................................................2
1.4 Research Framework........................................................................................................2
1.5 Scope of The Research.....................................................................................................3
1.6 Organization of The Research..........................................................................................3
Chapter 2:Co-op Mart Introduction......................................................................................4
Chapter 2:Co-op Mart Introduction......................................................................................4
1.7 Background of Supermarket.............................................................................................4
1.8 Co-op Mart Introduction...................................................................................................6
Chapter 3:Development of Two-factor Model.....................................................................13
Chapter 3:Development of Two-factor Model.....................................................................13
1.9 Review of Multi-attribute Concept.................................................................................13
1.10 Review of Servqual Model...........................................................................................13
1.11 Review of Kano Model.................................................................................................15
1.12 Proposed Two-factor Model.........................................................................................19
Chapter 4:Research Methodology........................................................................................25
Chapter 4:Research Methodology........................................................................................25
iii
1.13 Information Needed......................................................................................................25
1.14 Target Populations........................................................................................................25
1.15 Questionnaires Development........................................................................................25
1.16 Sampling Procedure......................................................................................................27
1.17 Sample Characteristics.................................................................................................28
Chapter 5:Findings Analysis and Discussion.......................................................................31
Chapter 5:Findings Analysis and Discussion.......................................................................31
1.18 Facility Attributes Analysis..........................................................................................31
1.19 Goods Attributes Analysis............................................................................................34
1.20 Personnel Attributes Analysis......................................................................................39
1.21 Policy Attributes Analysis............................................................................................42
1.22 Two-factor Model vs. Servqual....................................................................................46
Chapter 6:Conclusion.............................................................................................................48
Chapter 6:Conclusion.............................................................................................................48
1.23 Present Customer Perception........................................................................................48
1.24 Improvement Strategy..................................................................................................49
1.25 Two-factor Model.........................................................................................................51
Appendix A: Questionnaire A...............................................................................................53
Appendix A: Questionnaire A...............................................................................................53
Appendix B: Questionnaire B................................................................................................56
Appendix B: Questionnaire B................................................................................................56
Appendix C: Interview Schedule...........................................................................................59
Appendix C: Interview Schedule...........................................................................................59
Appendix D: Data Analysis....................................................................................................60
Appendix D: Data Analysis....................................................................................................60
Appendix E: Quality Attributes of a Supermarket.............................................................74
Appendix E: Quality Attributes of a Supermarket.............................................................74
References................................................................................................................................76
References................................................................................................................................76
iv
LIST OF FIGURES
Figure 1.1: Research framework.............................................................................................2
Figure 2.1: Proportion of merchandises sold through supermarket...................................5
Figure 2.2: Saigon Co-op organization chart.........................................................................7
Figure 2.3: Old procurement procedure................................................................................9
Figure 2.4: New procurement procedure...............................................................................9
Figure 2.5: Co-op Mart Nguyen Dinh Chieu Organization chart.......................................9
Figure 2.6: Co-op Mart Nguyen Dinh Chieu sales volume (2000).....................................10
Figure 3.1: The Kano diagram..............................................................................................16
Figure 3.2: Three basic shapes of characteristic curve.......................................................20
Figure 3.3: Structure of characteristic curve.......................................................................21
Figure 3.4: Two-factor model’s coefficients.........................................................................22
Figure 4.1: Respondents’ age of sample A...........................................................................28
Figure 4.2: Respondents’ frequency of shopping in supermarket of sample A...............28
Figure 4.3: Respondents’ average spending for each shopping of sample A...................28
Figure 4.4: Respondents’ age of sample B...........................................................................29
Figure 4.5: Respondents’ frequency of shopping in supermarket of sample B...............29
Figure 4.6: Respondents’ average spending for each shopping of sample B...................29
Figure 5.1: Convenience of parking......................................................................................32
Figure 5.2: Air condition........................................................................................................33
Figure 5.3: Store size..............................................................................................................33
Figure 5.4: Quality of merchandise......................................................................................35
Figure 5.5: Variety of product lines, variety of brand names and varieties for each
product line..............................................................................................................................36
Figure 5.6: Convenience of products arrangement for finding and attractiveness of
products display......................................................................................................................37
Figure 5.7: Introduction of new products............................................................................37
v
Figure 5.8: Unique products which customers cannot find somewhere else....................38
Figure 5.9: Agility and hospitality of locker personnel......................................................40
Figure 5.10: Hospitality, expertise in product information, and helpfulness in finding of
salesperson...............................................................................................................................41
Figure 5.11: Hospitality, accuracy, and agility of cashier..................................................41
Figure 5.12: Price level compared with other supermarkets.............................................43
Figure 5.13: Returning unqualified products policy...........................................................43
Figure 5.14: Attractiveness of promotion campaigns.........................................................44
Figure 5.15: Flexibility of paying method............................................................................45
Figure 5.16: Convenience of open hours..............................................................................46
Figure 5.17: Convenience of open hours and quality of merchandise..............................47
vi
LIST OF TABLES
Table 2.1: Co-op Mart stores...................................................................................................8
Table 2.2: List of Co-op Mart’s direct competitors............................................................11
Table 3.1: Kano questionnaire combination table..............................................................17
Table 4.1: List of studied attributes......................................................................................26
Table 4.2: Attributes classification.......................................................................................27
Table 5.1: Facility attributes..................................................................................................31
Table 5.2: Goods attributes....................................................................................................34
Table 5.3: Personnel attributes..............................................................................................39
Table 5.4: Policy attributes....................................................................................................42
Table 6.1: Present customer perception...............................................................................48
Table 6.2: Improvement priorities of the first group..........................................................51
Table 6.3: Improvement priorities of the second group.....................................................51
Table C.1: Schedule of survey A...........................................................................................59
Table C.2: Schedule of survey B............................................................................................59
Table D.1: Variables coding...................................................................................................60
Table D.2: Shopping preference contributed by very good performance........................61
Table D.3: Shopping preference contributed by very bad performance..........................62
Table D.4: Current attributes' performance......................................................................63
Table D.5: Shopping preference contributed by current attributes' performance.........64
Table D.6: Difference between current attributes' performance and very good
performance.............................................................................................................................65
Table D.7: Difference between current attributes' performance and very bad
performance.............................................................................................................................66
Table D.8: Difference between shopping preference contributed by very good
performance and shopping preference contributed by current performance.................67
Table D.9: Difference between shopping preference contributed by current
performance and shopping preference contributed by very bad performance...............68
vii
Table D.10: Attributes' characteristics.................................................................................69
Table D.11: List of attributes in the order of preference gap............................................71
Table D.12: List of attributes in the order of improvement efficiency.............................72
Table D.13: Pair test for difference in improvement efficiency.........................................73
viii
CHAPTER 1: INTRODUCTION
1.1 RATIONALE OF THE RESEARCH
After more than 20 years of planned economy, Vietnam entered to the market economy with
a lot of new kinds of business imported to the country. Among them, the concept of
supermarket seems to be the one which has most impact on the lifestyle of Vietnamese.
While the knowledge of supermarket quality receives many attentions from researchers in
other countries, the specific knowledge on Vietnam’s situation is scarce. Saigon Co-op Mart
is chosen for the research because it has the largest coverage in Ho Chi Minh City, the most
dynamic city in Vietnam.
Saigon Co-op is a co-operative which used to operate in many businesses from
manufacturing to trading, exporting and retailing. In the recent years, it has a strategic move
from a diversified portfolio investment to focusing on retailing especially the supermarket
chain. Many business units were divested for freeing resources to develop the supermarket
chain. From the beginning, Co-op Mart gains a significant market share thank to be one of
the first movers. However, it could not enjoy this advantage forever. Recently, the
competition on this kind of business increases rapidly in term of quantity as well as quality.
Many supermarkets have been opened with modern facilities and larger area in the last year.
In the near future, the competition will be more intensive as the result of the penetration of
foreign supermarket chain and the co-operation of other chains. For sustaining the market
leader position, Saigon Co-op must improve its competitiveness and the basic for this
competitiveness is quality. Quality leads to customer satisfaction and loyalty; satisfied and
loyal customers are a source of increasing future purchasing then the firm long-term
profitability and market share (Anderson, Fornell, and Lehmann, 1994).
On the other hand, for capturing the market quickly, Saigon Co-op Mart spreads its stores all
over the city with very high speed. As the result, the operation and quality level of the stores
are not unified. It creates a problem with customer perception of the brand. Moreover, it
makes the co-operation among stores having problems and the operation of the whole chain
is not effective. To overcome these problems, the management of Co-op Mart set up Co-op
Mart Nguyen Dinh Chieu as the model for their next generation stores. After that, they
standardize other stores based on this model.
The result of this research will give the company management a better understanding of the
relationship between store’s performance and shopping preference of customers and also the
perception of customer about Co-op Mart Nguyen Dinh Chieu. Consequently, they can have
more precise and systematic decisions to improve the quality of Co-op Mart Nguyen Dinh
Chieu. The result is not only the improvement of Co-op Mart Nguyen Dinh Chieu but also
the improvement of the whole chain when they apply this model to other stores.
1.2 PROBLEM STATEMENT
The goal of this research is to provide the management of Saigon Co-op a better insight of
Co-op Mart Nguyen Dinh Chieu quality in the perception of customer in order to improve its
quality.
1
1.3 RESEARCH OBJECTIVES
For more detail to drive the research activities, this goal could be broken down into a series
of objectives:
Developing a new model to examine the quality of a service and set up priorities for
quality improvement based on the influences of performance improvement on
shopping preference of customers.
Identifying the attributes of a supermarket that affect perceived quality of customer
and finding out how these attributes’ performance influence the shopping preference
level of customers in an incremental manner.
Measuring customer’s perception about attributes performance of Co-op Mart Nguyen
Dinh Chieu and how much these attributes contribute to shopping preference of
customers.
Providing recommendations to improve Co-op Mart Nguyen Dinh Chieu’s quality in
an efficient way: improving the right attributes in the right priorities based on the
incremental contribution of these attributes performance to shopping preference of
customers.
1.4 RESEARCH FRAMEWORK
Figure 1.1: Research framework
Studied attributes
Attributes
characteristics
Attributes'
performance
Analysis
Quality attributes
Management
interview
Previous research
Focus group of
customer
Survey BSurvey A
Shopping preference
Management
interview
Observation
Recommendation
2
Quality attributes of a supermarket are discovered through previous research and focus group
of customers. Then an interview with the company management to decide which attributes
will be studied. After that, two surveys will be conducted to collect primary data. The result
of these two surveys will be used to characterize the attributes. On the other hand, the second
survey will be used to measure Co-op Mart Nguyen Dinh Chieu’s attributes performance and
how much this performance level contributes to shopping preference of customers. Based on
these findings, some recommendations will be made to help company management improve
their store’s quality.
Quality attributes are characterized, based on their impacts to shopping preference of
customers. The concept underlies this method is twofold. Firstly, when an attribute is
improved or declined, it does not affect shopping preference of customers by the same
amount. Secondly, this difference is not the same for every attribute but each attribute has its
own property. Some will have more impact on increase side and others will have more
impact on decrease side.
1.5 SCOPE OF THE RESEARCH
The research excludes all other kinds of complementary businesses in the area of
supermarket and focuses on supermarket business (self-service area) only.
The research focuses on three delivery processes of Co-op Mart which are believed to be
main processes of a supermarket. They are preparation for shopping, self-shopping, and
billing processes.
The research does not take into consideration the opinions of customers who visit
supermarket less than 4 times in the year since they are assumed not to be familiar with this
kind of shopping. In addition, customers who are under 15 are also excluded.
1.6 ORGANIZATION OF THE RESEARCH
Chapter 1(Introduction) provides an introduction including the rationale of the research,
problem identification, objectives, research framework, scope of the research, and
organization of the research report.
Chapter 2 (Co-op Mart introduction) presents the literatures of supermarket background and
supermarket in Viet Nam and introduces the development, organization, and operation of
Saigon Co-op and the Co-op Mart chain, especially Co-op Mart Nguyen Dinh Chieu store.
Chapter 3 (Development of Two-factor model) provides the literatures review of multi-
attribute concept and quality measurement, especially the Servqual and Kano models. This
chapter also presents the development of Two-factor model, which is to be used in this
research to examine service quality of Co-op Mart Nguyen Dinh Chieu and set up priorities
for quality improvement.
Chapter 4 (Research methodology) presents the information needed, target populations,
questionnaire development, sampling procedure, and sample characteristics of the research.
Chapter 5 (Findings analysis and discussion) contains the discussion and analysis of findings
from customer surveys as well as management interview and observation. Some
recommendations are also discussed in this chapter.
Chapter 6 (Conclusion) draws out the conclusions for current perceived quality of Saigon
Co-op Mart Nguyen Dinh Chieu, quality improvement strategy, and Two-factor model.
3
CHAPTER 2: CO-OP MART INTRODUCTION
1.7 BACKGROUND OF SUPERMARKET
1.7.1 History and concept of supermarket
The supermarket was born in the US and was one of the most interesting innovations which
has changed the retailing environment. Exact place and time it was born has been debated for
many years. According to Peak H.S. (1977), most authors cite December 8, 1932 as the birth
date of the supermarket when a new store called the Big Bear was opened in New Jersey.
This store, along with other early supermarkets, was a child of the Great Depression.
Economic conditions were such that the price was all-important, and every penny counted.
The lower price in supermarkets is the result of low-margin operations that depend on very
high stock turnover rates to sustain profits. Operation out of clean, modern facilities, the
supermarket is basically a self-service operation supported by such services as parking,
check cashing, fast check out, and bagging. Cash and carry is the preferred method of doing
business (Lewison, 1994).
The supermarket was generally accepted as the food retailer until the years 1970s. By the
end of 70s, the changing lifestyle of the customers focused on convenience had led some
operators to a “one-stop-shopping-for-household-goods” supermarket. The emphasis on one-
stop shopping and the adding of new departments and sections has continued up till now
(Peak, 1977). Today, a supermarket’s upgraded and upscale operations include such non-
food lines as prescription medicines, electronic appliances, auto accessories, books,
magazines, clothing, flowers, and house ware. Moreover, many supermarkets have added
numerous services including dry cleaning, postal, banking, tailoring, medical, dental,
insurance, and legal services.
No one definition of a supermarket exists because of the wide range of business formula
used in this industry. There are three criteria used to define a supermarket: the minimum size
requirement, the characteristics and extent of self-service, and the stock requirements. In the
US, a supermarket was firstly defined by the Supermarket Institute as a self-service
departmentalized food store having a minimum sales volume of $250,000 per year. In 1954,
the sales volume was revised to $500,000 (Charvar, 1961 and McCleland, 1963). Prior to
1981, supermarket included food stores with annual sales of at least $1 million. Recently, the
minimum annual sales requirement is $2 million (Lewison, 1994). In the UK, a supermarket
is defined as a self-service food store with centralized checkouts and a sales area of over
2,000 square feet (Khalifa Othman, 1990).
In the US, supermarkets, using 80% of retail food industry’s personnel, account for about
90% of all retail food sales (Peak, 1977). In the UK and Canada, supermarkets and large
superstores account for about 85% of grocery trade. Similarly in other European countries,
supermarkets dominate the food retailing system (Khalifa Othman, 1990).
1.7.2 Supermarket in Viet Nam
In general, Vietnamese perceives that the store offering self-service, having fixed price
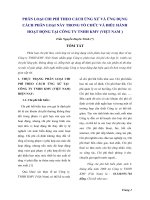
labels and electronic checkout as a “supermarket” (Thu Huong, 1997, p.33). In her research,
Thu Huong (1997) reached the conclusion that most of the people (94.9%) consider a store
as a “supermarket” because of its self-service characteristic, which is pretty new for
Vietnamese shoppers. Many customers cite self-service as a positive side of the store,
4
because shoppers can enjoy free choice and comparison among brands, and can avoid the
high pressure selling which is normal practice in other traditional stores. Fixed pricing is also
thought as a sign of a “supermarket” by nearly 85% of customers. More than half of the
customers point out that a “supermarket” should have electronic checkout. In addition, nice
and convenience product displays are also considered as one attribute of a “supermarket” by
40% of customers.
In contrast with supermarket concept used in developed countries which is characterized by a
large volume, multi-line store that serves mass market at competitive prices, the
supermarkets in Viet Nam are more expensive than traditional outlets, and tend to cater the
middle and upper class customers. The supermarkets are still fairly basic in terms of design,
range and service, but they are a far cry from the small and congested roadside stalls.
Different with traditional markets, supermarkets have well designed interior and shopping
comforts such as air conditioning, cold storage, and electronic checkouts. They offer self-
service, high quality goods at fixed prices. The merchandise mix is mainly household
amenities and personal care products, ready-to-eat foods, confectionary and cooking
materials, as well as footwear, clothing and some durable products (Thu Huong, 1997, p.41).
According to Tu Giang (1999), most of Vietnamese have not been similar with shopping in
supermarket. There are 78% of customers in Ho Chi Minh City and 66% of customers in Ha
Noi who thought that the price in supermarket is higher 5%-10% than that in other outlets.
Shopping frequency in supermarket is very limited. In developed countries, 80% of
customers go to supermarket every week. This number in Viet Nam is 12% in Ho Chi Minh
City and 8% in Ha Noi. As a result, proportion of sales volume which is sole through
supermarket is very low, just about 5% of total retail volume in Viet Nam.
Figure 2.1: Proportion of merchandises sold through supermarket
1
0
10
20
30
40
50
60
70
80
Hongkong Singapore Korea Malaysia Philippines Viet Nam
%
However, year 2001 begins a new era for supermarket in Viet Nam. The shopping area of
supermarket is larger, the product lines and brands are more varied, services are better, and
especially, the price will be cheaper due to fierce competition and efficient operation.
Demand for supermarket is more and more increasing. The number of customers who go to
one supermarket for shopping increases from hundreds per day to 5 thousands per day in
1
Source: AC Nielsen (1999).
5
average. Especially, Mien Dong Supermarket and Maximart received 20,000 customers per
day in opening days after off days for extent. In addition, the average value of one bill
increases from 50,000VND to 200,000VND. The number of above 1 million VND bill also
increases (Chanh Khai, 2001). Moreover, the traffic condition in big cities of Viet Nam is
worse and worse. As a result, one-stop shopping will be preferred more and more because
customer will avoid traveling from store to store for shopping. For conclusion, the
development of supermarket is the indispensable trend in big cities of Viet Nam.
1.8 CO-OP MART INTRODUCTION
1.8.1 Saigon Co-op
In 10/1975, Co-operative of Ward Cay Sung District 7 (recent name is Trading Co-operative
of Ward 14 District 6) was founded. It opened the movement of co-operatives in Ho Chi
Minh City. Many co-operatives were founded in other districts. For accelerating the
foundation and operation of co-operatives, Propaganda Board for Consumer Co-operatives
and Trading Co-operatives was founded on 20/06/1976. In 04/1978, the Propaganda Board
was renamed to Management Board of Consumer Co-operatives and Trading Co-operatives.
The main function of Management Board was to organize and guide the operation of co-
operatives in Ho Chi Minh City.
From 1989, under the influence of social and economic reform process (Doi Moi), many
member co-operatives were disintegrated, merged, or reformed because of the fierce
competition of other forms of business organization. At that time, there were only 7 member
co-operatives under the management of Management Board. To reinforce the co-operative
segment, The Union of Trading and Service Co-operatives of Ho Chi Minh City (Saigon Co-
op) was founded in 05/1989 based on resources of Management Board and member co-
operatives.
Recently, Saigon Co-op operates in many areas as following:
• Supermarket: Co-op Mart chain is the most well-known supermarket chain in Ho Chi
Minh City with 6 stores. It will be discussed more deeply in next sections.
• Mini mart: Saigon Co-op has just started to develop a mini mart system (mCo-op Mart)
in the form of joint ventures with other local co-operatives. Up to now, 2 stores were opened
in Ho Chi Minh City; mCo-op Mart Cao Thang is a joint venture with Wards 2-4-5 Co-
operative and mCo-op Mart Cau Kinh is a joint venture with Cau Kinh Co-operative. These
stores supply daily necessities to customer such as food-grains, foodstuffs, health care
products, and family used items, etc. The competitive advantage of this kind of mart is the
convenience for customer because the mart is located in residential area.
• Distribution agent for other companies: distributing and selling domestic products and
imported products all over the country.
• Manufacturing: Nam Duong sauces with brand name “Con Meo Den” was elected as
Viet Nam high quality product during 4 successive years from 1997 to 2000. Nam Duong
sauces are distributed and sold all over the country and exported to European, American, and
Russian markets.
• Export: agricultural products, aquatic products, seafoods, processed foods, textile,
garment, leather products, and handicraft.
• Import: raw and working materials (such as plastic, textile, and chemical), foods,
machine, motorcycle, auto, and consumer’s goods.
6
• Services: besides tourism services of Saigon Co-op tourism center, Saigon Co-op also
provides other services such as advertisement, foreign exchange but not well developed till
now.
• Dong Khoi computer center: trading computer, computer parts, maintenance, and
installing software.
Figure 2.2: Saigon Co-op organization chart
Committee of member
co-operatives
Board of management
Board of directors
Inspection section
R&D
Domestic
business
Marketing
Import/
export
Accounting Administrative
Technical-
Project
Co-op Mart chain
Co-op Mart Cong Quynh
Co-op Mart Tran Hung Dao
Co-op Mart Nguyen Dinh Chieu
Co-op Mart Dinh Tien Hoang
Co-op Mart Dam Sen
Co-op Mart Hau Giang
Distribution agent
for other companies
Nam Duong sauces
factory
Services
Nhat Nam trading
center
mCo-op Mart chain
Saigon Co-op tourism center
Advertisement services
Foreign exchange services
Ben Thanh trading
store
Dong Khoi
computer store
Joint-ventures
• Ben Thanh trading store: trading textile and garment with fixed price.
7
• Nhat Nam trading center: this is a joint venture of Saigon Co-op and Hasegawa
Company (Japan). In addition to a supermarket, it has many departments for rent.
However, the strategy for long-term development of Saigon Co-op is to develop the Co-op
Mart chain. It is the core business of Saigon Co-op in future.
1.8.2 The development of Co-op Mart chain
In 1993, some supermarkets were established in Ho Chi Minh City such as Maxi Mart, Citi
Mart, etc. These events created a new kind of shopping behavior of customer in Ho Chi
Minh City. Operating in retailer segment, Saigon Co-op realized the necessary of
development a supermarket chain. It was also the opportunity to develop and diversify the
operation.
Co-op Mart Cong Quynh is the first store of Co-op Mart Chain. It was founded on
01/06/1996 with operating area of 732 m
2
and investment fund of 6,530 billion VND. Based
on the very good result of the first year, Saigon Co-op decided to develop the Co-op Mart
chain by founding some more stores after many carefully done market researches. Recently,
Co-op Mart Chain has 6 stores placed in Ho Chi Minh City. As the common trend, the
operating area of the store is increasing.
Table 2.1: Co-op Mart stores
2
Store name Address Founded
date
Shop-
Area
Co-op Mart Cong Quynh 189c Cong Quynh, dist. 1 09/02/1996 760 m
2
Co-op Mart Tran Hung Dao 727 Tran Hung Dao, dist. 5 30/04/1997 1200 m
2
Co-op Mart Hau Giang 188 Hau Giang, dist. 6 05/01/1998 1272 m
2
Co-op Mart Dam Sen 3 Hoa Binh, dist. 11 16/12/1998 2060 m
2
Co-op Mart Nguyen Dinh
Chieu
168 Nguyen Dinh Chieu,
dist. 3
31/12/1999 2620 m
2
Co-op Mart Dinh Tien Hoang 127 Dinh Tien Hoang, dist.
Binh Thanh
26/01/2000 2938 m
2
The vision of Co-op Mart is: “Co-op Mart is a trustworthy shopping center for everyone with
high quality goods, reasonable price, and hospitable services”.
For achieving the vision above, Co-op Mart started to implement following strategies and
movements:
+ Standardizing the operation of the stores in Co-op Mart chain.
+ Opening new stores in many important areas in Ho Chi Minh City and other provinces.
+ Considering the market price and implementing direct procurement from foreign and
domestic suppliers to establish a reasonable and competitive pricing policy.
+ Establishing the center warehouse and distribution center, standardizing the procurement
procedures, and selecting suppliers to standardize product quality, price, and product coding.
2
Source: Ho Chi Minh City Commerce Service, List of Supermarkets & Trading Centers in Ho Chi Minh City,
07/2000.
8
+ Increasing promotion campaigns and advertisement.
+ Developing “Khach Hang Than Thiet” program (friendly customer) to increase the
quantity and quality of loyal customer.
+ Computerizing all of the operation and management in Co-op Mart Chain.
+ Standardizing the labor force and preparing the labor force for future development.
Figure 2.3: Old procurement procedure
Figure 2.4: New procurement procedure
1.8.3 Co-op Mart Nguyen Dinh Chieu
As the result of the fast development, the operation of Co-op Mart stores was different from
store to store. Realizing the necessary of standardization in supermarket chain, management
of Co-op Mart is trying to construct a suitable model for supermarket then standardize the
supermarket chain based on this model. Therefore, they establish the new store based on the
experience of old stores and learning from other domestic and foreign supermarket then
synchronize the whole chain with the new store. Co-op Mart Nguyen Dinh Chieu is the one.
Opened on 31/12/1999 with operating area of 2620 m
2
, Co-op Mart Nguyen Dinh Chieu is
the flagship of Co-op Mart chain. Applying the newest techniques, arrangement, and
procedures, Co-op Mart management attempt to position this store as a model for the next
generation of supermarket in Viet Nam. In case of success, other Co-op Mart stores will be
reformed as this model.
Figure 2.5: Co-op Mart Nguyen Dinh Chieu Organization chart
Information
Order 30% items
Goods
Order 70% items
Suppliers
Domestic business departmentCo-op Mart stores
Supplier 2
Distribution Center
Co-op Mart store 1 Co-op Mart store 2 Co-op Mart store 3
Supplier 1 Supplier 3
9
Director
Security
supervisor
Marketing
staff
Cashier
supervisor
Office
supervisor
Vice-director for groceries Vice-director for foods
Operating
manager
Operating
manager
Warehouse
supervisor
Sales
supervisor
Warehouse
keepers
Salespeople
Warehouse
supervisor
Sales
supervisor
Warehouse
keepers
Salespeople
Securities
Vehicle
keepers
Cashiers Administrator
Accountant
Treasurer
Office staffs
Figure 2.6: Co-op Mart Nguyen Dinh Chieu sales volume (2000)
3
0
5
10
15
20
25
30
35
40
QI QII QIII QIV
billion VND
After one year of operation, the performance of Co-op Mart Nguyen Dinh Chieu was quite
good. The sales volume per m
2
of Co-op Mart Nguyen Dinh Chieu was higher than other
stores in the chain (except Co-op Mart Cong Quynh, the first store of Co-op Mart). After the
intensive promotion campaigns when opening and the peak shopping season of Tet (Lunar
New Year) in the first quarter, the sales volume was increasing from the second quarter to
the last quarter of year 2000 dramatically.
1.8.4 Competition
The competitors of Co-op Mart chain are other supermarkets and other kinds of retailer such
as traditional market and grocery. However, supermarket has some special characteristics
which are different from others, for example, fixed price, self-service, highly merchandise
3
1USD = 14500VND (03/2001)
10
concentration, cleanliness, etc. Therefore, the direct competitors of Co-op Mart are other
supermarkets.
Table 2.2: List of Co-op Mart’s direct competitors
Store name Address Shop-Area
(m
2
)
No. of
items
Cora Dong Nai 11C4KP1 Long Binh Tan,
Bien Hoa, Dong Nai
20,000 20,000
Cora An Lac 354 Hung Vuong, dist. Binh
Chanh
Under
construction
N/A
Maximart Le Loi 65 Le Loi, dist.1 2,734 22,000
Maximart 3/2 3C 3/2, dist. 10 12,000 22,000
Citimart 21-23 Nguyen Thi Minh Khai,
dist.1
200 10,000
Citimart Minh Chau 369 Le Van Sy, dist. 3 2,900 10,000
Citimart 39 Le Duan, dist.1 3,000 20,000
Minimart 95-101 Nam Ky Khoi Nghia,
dist. 1
600 10,000
Minimart Superbowl A43 Truong Son, dist. Tan
Binh
835 15,000
International Trading Center 95-101 Nam Ky Khoi Nghia,
dist. 1
14,876 15,000
Thuong Xa Tax 135 Nguyen Hue, dist.1 7,500 20,551
Pacific Mart 8B 3/2, dist.10 750 21,440
Foodcomart 1 3/2, dist. 10 1,356 15,000
Tenmart 277B Cach Mang Thang Tam,
dist.10
2,000 15,000
Mien Dong Supermarket 202B Hoang Van Thu 8,000 10,000
Ha Noi Supermarket 189 Cong Quynh, dist.1 1,000 20,000
In Ho Chi Minh City (and Cora Dong Nai in Bien Hoa), there are 16 supermarkets of 11
supermarket chains (excluding Co-op Mart) have considerable scale. Among them, there are
three redoubtable competitors: Cora (Bourbon), Maximart, and Mien Dong Supermarket. All
of the three have considerable larger operating area than Co-op Mart stores.
• Cora: Bourbon Corporation (France). Although Cora Dong Nai is the only operating
supermarket, Cora will develop fast with Cora An Lac and another one in district 10 are in
construction. With a strong financial fund and the support from Bourbon Corporation, they
can spend a lot of money in marketing, promotion campaigns and lower the price to gain
more market share. In addition, the experience in supermarket business and good
management skills help them operate more efficient and professional.
• Maximart: there are many product lines and varieties as well as brand names, especially
in imported products. Other strengths of Maximart are good management skills and low tax.
11
• Mien Dong Supermarket: the operating area is large and having ability to extent. There
are many product lines and varieties as well as brand names. The price is lower than other
supermarket.
In addition, there is the threat of merger of other supermarket into a bigger supermarket
chain. Especially, the intention of the co-operation and might be merger of Maximart,
Citimart, and Mien Dong Supermarket into the biggest supermarket chain in Ho Chi Minh
City.
For survival and development in such a fierce competitive environment, Co-op Mart
positions itself as the most coverage supermarket chain with standardized service and price
by establishing many supermarkets with average operating area cover a large region. The
first step of standardization is to establish the flagship store then synchronize the whole
chain. Co-op Mart Nguyen Dinh Chieu is to be the one.
12
CHAPTER 3: DEVELOPMENT OF TWO-FACTOR MODEL
In this research, a new model is developed to examine service quality of Co-op Mart Nguyen
Dinh Chieu and set up priorities for quality improvement. Although many textbooks
introduce Servqual as a prefer model to measure service quality, it faces a lot of criticisms
from literature as well as empirical testing. In addition, its managerial implication is also
challenged. Therefore, based on the ideas of the relationship of two quality constructed
components and incremental effect of Kano model, an alternative model is designed. As
Servqual and Kano models, this model is also a multi-attribute model, which provides more
insight to managers and researchers than an overall effect model. Before developing the new
model, multi-attribute concept, Servqual model, and Kano model are reviewed.
1.9 REVIEW OF MULTI-ATTRIBUTE CONCEPT
According to Wilkie and Pessemier (1973), in multi-attribute models, a service (or product)
is viewed as a bundle of benefits and costs. The potential advantage of multi-attribute models
over the simpler “overall effect” approach is that yields understanding and feasible
improvement direction. A model which cannot help analysts gain these things is prone to be
theoretically vacuous. Attributes provide the basic dimensionality of the model. However,
the weakness of the construct in this model is that attributes are perceptual rather than
objective product construct, that reasonable candidate lists can be generated by combining
unstructured interviews. Each attribute has two measures, importance weight and belief
rating. Both of them are presumed to add explanatory power; belief rating contribute product
differences while importance weight provide differential stress on attributes.
For applying this kind of models, a service (or product) will be divided into many attributes.
Based on customer perception about each attribute, the measurement will be conducted. By
doing that way, researcher could understand deeper the construct of quality then know how
to improve the quality perception of customer by improving each attribute performance.
Many multi-attribute models were designed to measure service quality up to this time such
as Servqual (Parasuraman, Zeithaml, and Berry, 1985, 1988, 1991), Servperf (Cronin and
Taylor, 1992), Evaluated performance (EP) model and Normed quality model (Teas, 1993).
Among them, Servqual is the most well known one in textbooks. In addition, Kano quality
model is also a multi-attribute model even though it is a quality identification model rather
than a quality measurement model. The next sections will present Servqual and Kano models
as the bases to develop Two-factor model.
1.10 REVIEW OF SERVQUAL MODEL
1.10.1 Quality definition
The concept of Servqual model is generally based on gap theory of Parasuraman, Zeithaml,
and Berry (1985), which suggests that “the difference between customers’ assessment of the
actual performance of a specific firm within a general class of service providers and their
expectation about the performance of that class (P-E gap) drives the perception of service
quality.”
13
1.10.2 Servqual dimensions
According to its developers, Servqual instrument consists of 22 attributes which can be
classified into 5 dimensions: tangible, reliability, responsiveness, assurance, and empathy
(Parasuraman, Berry, and Zeithaml, 1988).
• Tangibility dimension: because of the absence of a physical product, customers often
rely on the tangible evidence that surrounds the service in forming evaluation. This
dimension includes variety of objects such as desks, lightning, wall color, brochures,
appearance of firm’s personnel, etc.
• Reliability dimension: reflects the consistency and dependability of a firm’s
performance. Does the firm provide the same level of service time after time, or does quality
dramatically vary with each encounter? Does the firm keep its promises, bill its customers
accurately, keep accurate records, and perform the service correctly the first time?
• Responsiveness dimension: reflects the commitment of a firm to provide its service in a
timely manner. This dimension concerns the willingness and readiness of personnel to
provide a service. It reflects the preparedness of the firm to provide the service.
• Assurance dimension: addresses the competence of a firm, the courtesy it extends to its
customers, and the security of the service. This dimension refers to how a firm’s personnel
interact with customers and customers’ possession such as courtesy reflects politeness,
friendliness, and consideration for the customers’ property.
• Empathy dimension: is ability of the firm’s personnel to experience customers’ feeling as
their own. Empathic firms understand their customer needs and make their service accessible
to customers.
1.10.3 Servqual questionnaire
Servqual questionnaire includes 22 pairs of question designed to capture the perception of
customer about their expectation toward 22 attributes of a service and their perceived
performance of these attributes. These pairs of question have the same format according to
Parasuraman, Berry, and Zeithaml (1991):
Expectation: Excellent company will have “attribute 1” (attribute 2, 3, .., 22).
Performance: XYZ company has “attribute 1” (attribute 2, 3, .., 22).
1.10.4 Managerial implication
The bigger the gap between attribute performance and customer expectation of the attribute
is, the lower the quality is. Therefore, there is more improvement needed for this attribute
rather than others. As a result, the priorities for improvement are associated with the
magnitude of P-E gaps. The larger the P-E gap is, the more benefits can be gained by closing
the gap and the higher priority to improve the attribute has.
1.10.5 Critiques for Servqual model
a) Reliability and dimensionality of 5-dimension structure
The reliability tests of Cronin and Taylor (1992) in four industries (banks, pest control, dry
cleaning, and fast food) prove that the 5-dimension structure of Servqual is not confirmed in
any of research samples. The chi square statistic universally indicates a poor fit between the
theoretical and measurement model for 5-dimension structure. The adjusted goodness-of-fit
indices are also not indicative of a good fit. In addition, the dimensional test indicates that 22
14
attributes are unidimensional or they are considered as one composite of individual
measures.
From the testing results above, Cronin and Taylor suggest that the dimensional structure of
quality measures and quality attributes should be constructed flexibly according to specific
industry. Five-dimension structure of Servqual has a conceptual meaning rather than a
framework to design a practical research.
b) Validity of Servqual measures
The primary threat to validity of Servqual measures is construct validity. Carmines and
Zeller (1979, p.23) state, “fundamentally, construct validity is concerned with the extent to
which a particular measure relates to other measures consistent with theoretically derived
hypotheses concerning the concepts (or constructs) that are being measure”. The validity test
of Cronin and Taylor (1992) suggests that the performance-based measures provide a more
construct-valid explication of service quality than Servqual measures because of their
content validity. In addition, the findings of Kenneth Teas’ empirical test (1993) prove that
evaluated performance measurement framework is characterized by higher validity than P-E
framework.
Hence, the attributes performance is measured in this research rather than the P-E gaps.
c) Priorities for improvement
The managerial implication of Servqual model implies that the improvement of an attribute
which has bigger P-E gap will provide more benefits than improvement of an attribute which
has smaller P-E gap so the former has higher priority to improve. The results of this research
will prove that this implication is not always valid. In case of some attributes, the
improvement is not worth even though the performance gap is large.
1.11 REVIEW OF KANO MODEL
1.11.1 Quality definition
In JIS (Japanese Industrial Standards) Z8101, quality is defined as “the totality of quality
characteristics, or level of performance, that determines whether a product or service
satisfies the purpose of use” (Kano, 1996, p.114).
Quality concept is divided into 2 components, performance and satisfaction. Having more
meaning than quality definition in Servqual, this definition does not stop at performance
measure (performance is not a benefits related factor) but it goes further, this performance
must contribute to customer satisfaction in order to be defined as quality. This definition
links quality concept with customer benefits.
1.11.2 Kano diagram
It is clear that companies should provide service (or product) with high quality and it is easy
to understand that higher service (or product) performance can result in higher customer
satisfaction. However, the relationship between customer satisfaction and service (or
product) performance is more complicated than this. For some attributes, customer
satisfaction can be greatly improved only with a small improvement of performance; while,
for some other attributes, customer satisfaction can only be improved a little even when the
performance of the service (or product) has been greatly improved. Thus, the deep
understanding of this relationship is the prerequisite to achieving customer satisfaction.
15
For the above purpose, Kano have developed a very useful diagram to characterise customer
needs. This diagram is a tool in the field of R&D for development new products and
services, especially in the integration with Quality Function Deployment (QFD) (Shen, Tan,
and Xie, 2000). It devides service (or product) features into three distinct categories, each of
them affects customer satisfaction in a very different way:
• Must-be attributes: customer take them for granted when fulfilled. However, if the
service (or product) does not meet this basic need sufficiently, the customer may become
very dissatisfied.
• One-dimensional attributes: these attributes result in customer satisfaction when fulfilled
and dissatisfied when not fulfilled. The better the attributes are, the better the customer like
them.
• Attractive attributes: the absence of attractive attributes does not cause dissatisfaction
because they are not expected by customers who may be unaware of such service (or
product) features. However, strong achievement in these attributes delights customer.
Figure 3.1: The Kano diagram
In addition to three main categories above, Kano introduced two more categories (Kano,
1996, p.130) to cover all posible attributes:
• Indifference attributes: an increase or decrease in performance level does not make any
difference. However, it is very hard to have an absolute indifference attribute. Usually, an
attribute has some effects, more or less, on some customer.
• Adverse attributes: an increase in performance level results in customer disatisfaction,
and a decrease results in satisfaction. These attributes are nothing than the oppositions to
three main categories.
To conclude, in Kano model, the measurements of performance level and customer
satisfaction are distinct. Moreover, the relationship of these two measurements is not always
linear but may be convex.
Satisfaction
Must-be
Attractive
One-dimensional
Performance
16