Mechanism and catalyst stability of metal assisted chemical etching of silicon
Bạn đang xem bản rút gọn của tài liệu. Xem và tải ngay bản đầy đủ của tài liệu tại đây (8.97 MB, 137 trang )
MECHANISM AND CATALYST STABILITY OF
METAL-ASSISTED CHEMICAL
ETCHING OF SILICON
PRAYUDI LIANTO
(S.Si., Universitas Pelita Harapan)
A THESIS SUBMITTED
FOR THE DEGREE OF DOCTOR OF PHILOSOPHY
IN ADVANCED MATERIALS FOR MICRO- AND NANO-
SYSTEMS (AMM&NS)
SINGAPORE-MIT ALLIANCE
NATIONAL UNIVERSITY OF SINGAPORE
2013
i
Acknowledgements
This thesis would not have been possible without the blessings of my
Lord Jesus Christ and the support of the following people.
First, I would like to express my utmost gratitude to my thesis
supervisors, Professor Choi Wee Kiong and Professor Carl V. Thompson.
Professor Choi has helped tremendously in shaping me to be an inquisitive and
independent researcher. His patience in monitoring my research progress
through our weekly meetings and in helping me formulate and “sift through”
my results into a meaningful and coherent thesis, even when he had to go
through medical treatments, is invaluable, to say the least. I am also greatly
indebted to Professor Thompson, who has provided many important and
critical suggestions to my research works. His advice and encouragement
greatly aided me in my journey as a PhD student. I am also very grateful for
the useful discussions I had with my thesis committee members, Professor
Chim Wai Kin and Professor Caroline Ross.
I must also give credit to Walter Lim, Xiao Yun, and Ah Lian Kiat as
the technologists of Microelectronics lab, where I carried out all my
experiments. Walter’s technical expertise in the lab equipments have made
him nothing short of a “superman” of the lab. I am also thankful to the
CICFAR staffs: Koo Chee Keong, Ho Chiow Mooi, and Linn Linn, for being
very kind and accommodating, especially towards my “non-office-hour” SEM
bookings. I also would like to thank Koh Hwee Lin (ECE-DSI Laser
Microprocessing lab), Woo Ying Chee (Electrical Machines & Drives lab),
Tan Chee Siong and Tan Kok Kiong (Mechatronics & Automation lab), for
their help with the electrical equipments.
ii
Furthermore, I am grateful to my SMA fellow “PhD soldiers”: Sang,
Thanh, Zongbin, Agung, Ria, and Chiew Yong. All of you have made my
graduate studies more alive and meaningful. I am also thankful for the
companionship of the other students whom I have shared the office space
with: Raja, Tze Haw, Khalid, Gabriel, Yun Jia, Zhoujia, Haitao, Zheng Han,
Thi, Zhu Mei, Bihan, Cheng He, Changquan, Jiaxin, Maruf, Lin Thu, and
Wang Kai.
Special thanks go to my dearest Ria for being very supportive in my
four-year journey with SMA. I also thank my dear brother, Alvin, for his
constant encouragement. Finally, I would like to dedicate this thesis to my
parents, Jio Su Ngo and Suryadi Lianto. Mom and Dad, I would not have
made this far without your continual love, support, trust, and prayers.
iii
Table of Contents
Acknowledgements …………………………………………………….… i
Table of Contents ………………………… ……………………………… iii
Summary ………………………………………………………………… vii
List of Tables ……………………………………………………………… ix
List of Figures ……………………………………………………………… x
List of Symbols ………………………………………………………… xviii
Chapter 1 Introduction ……………………………………………………… 1
1.1 Background ……………………………………………………… 1
1.2 Etching of Silicon ………………………………………………… 3
1.3 Metal-Assisted Chemical Etching of Silicon …………………… 4
1.4 Research Objectives ……………………………………………… 6
1.5 Organization of Thesis …………………………………………… 8
Chapter 2 Literature Review: Metal-Assisted Chemical Etching of Silicon 10
2.1 Introduction ………………………………………………………. 10
2.2 Types of Catalyst and Redox Reactions ………………………… 10
2.2.1 Liquid-Phase Catalyst ………………………………………. 11
2.2.2 Solid-Phase Catalyst …………………………………… … 14
2.2.3 Chartier/Bastide/Lévy-Clément Model …………………… 15
2.3 Porosity …………………………………………………………… 16
2.3.1 Dopant Dependence ……………………………………… 16
2.3.2 Etchant Composition Dependence …………………………. 18
2.4 Etching Direction ………………………………………………… 20
2.4.1 Interconnected Catalyst …………………………………… 20
2.4.2 Isolated Catalyst ……………………………………………. 23
iv
2.5 Electrochemical Etching of Silicon ………………………………. 28
Chapter 3 Experimental Methods ………………………………………… 31
3.1 Introduction ………………………………………………………. 31
3.2 Sample Preparation ……………………………………………… 31
3.3 Lithography ………………………………………………………. 33
3.4 Thermal Evaporation …………………………………………… 37
3.5 Lift-off ……………………………………………………………. 38
3.6 Metal-Assisted Chemical Etching of Silicon …………………… 39
3.7 Scanning Electron Microscopy ………………………………… 40
Chapter 4 Mechanism and Stability of Catalyst in Metal-Assisted Chemical
Etching ……………………………………………………………………… 43
4.1 Introduction ………………………………………………………. 43
4.2 Experimental Details …………………………………………… 45
4.3 Role of Electronic Holes on Etching Underneath Au ……………. 46
4.4 Role of Excess Holes on Pit Formation ………………………… 48
4.4.1 Influence of Catalyst Spacing ………………………………. 49
4.4.2 Influence of [H
2
O
2
] ………………………………………… 50
4.5 Control of Excess Holes ………………………………………… 51
4.5.1 Addition of NaCl …………………………………………… 51
4.5.2 Increase in [HF] ………………………………………… … 53
4.5.3 Effect of Electric Field …………………………………… 53
4.6 Role of Au Back Contact …………………………………………. 56
4.6.1 Double-Sided Hole Injection ……………………………… 57
4.6.2 Hole Fill-Up Effect …………………………………………. 59
4.6.3 Electrochemistry Current vs. Semiconductor Current …… 60
v
4.7 Modes of Catalyst Instability …………………………………… 62
4.7.1 Mode 1: Overlap of Excess Holes ………………………… 62
4.7.2 Mode 2: Generation of H
2
Bubbles ………………………… 64
4.7.3 Etch Stability Diagram …………………………………… 65
Chapter 5 Fabrication of Silicon Nanostructures with Metal-Assisted Chemical
Etching ……………………………………………………………………… 67
5.1 Introduction ………………………………………………………. 67
5.2 Experimental Details …………………………………………… 68
5.3 Dominant Role of Excess Holes in IL-Patterned Catalyst ……… 69
5.3.1 Fabrication of Silicon Nanocones from Porous Silicon
Nanowires ……………………………………………… 70
5.3.2 Influence of Dopant on Porosity of Silicon Nanowires ……. 74
5.3.3 Caterpillar-like and Haystack-like Silicon Nanofins ……… 76
5.4 Control of Excess Holes via Etchant Concentration …………… 77
5.4.1 Influence of [H
2
O
2
] ………………………………………… 77
5.4.2 Influence of [HF] ………………………………………… 79
Chapter 6 Bias-and-Metal-Assisted Chemical Etching of Silicon …………. 81
6.1 Introduction ………………………………………………………. 81
6.2 Experimental Details …………………………………………… 82
6.3 Etching Results from BiMACE …………… ………………… 84
6.4 Etching Mechanism …………………….……………………… 90
6.5 BiMACE to Fabricate Nanowires. ……………………………… 94
Chapter 7 Conclusion …………………………………………………… 96
7.1 Summary ……………………………………………………… 96
7.2 Recommendations ……………………………………………… 98
Appendix A Etching in an Electric Field for [H
2
O
2
] = 0.46 M …………… 99
vi
Appendix B Determination of D Value …………………………………… 100
Appendix C Summary of SEM Images Used for Construction of the Etch
Stability Diagram …………………………………………………………. 101
Appendix D Si Nanofins Etched with Different [H
2
O
2
] ………………… 102
Appendix E Si Nanofins Etched with Different [HF] …………………… 103
Appendix F Role of Extraneous Au Nanoparticles ……………………… 104
F.1 Role of Extraneous Au Nanoparticles …………… 104
F.2 Elimination of Extraenous Au Nanoparticles using Anti-Reflection-
Coating Layer …………………………………… … 106
Appendix G References …………………………………………………… 108
vii
Summary
The objective of this study was to conduct a mechanistic study of
MACE. Specifically, the objectives were to investigate the role of electronic
holes, study the influence of etchant chemistries and catalyst geometry on the
etching stability, study the porosity of etched nanostructures using IL-
patterned catalyst, and investigate the role of voltage bias in the etching
mechanism.
First, we report results of a systematic study on the mechanism and
catalyst stability of metal-assisted chemical etching (MACE) of Si in HF and
H
2
O
2
using isolated Au catalyst. The role of electronic holes on etching of Si
underneath Au catalyst is presented. The role of excess holes is characterized
through the observation of pit formation as a function of catalyst proximity
and the ratio of the H
2
O
2
and HF concentrations in the etch solution. We show
that suppression of excess hole generation, and therefore pitting, can be
achieved by either adding NaCl to the etch solution or by increasing the HF
concentration relative to the H
2
O
2
concentration. We also demonstrate that an
external electric field can be used to direct most of the excess holes to the back
of the Si wafer, and thus reduce pit formation at the surface of the Si between
the Au catalysts. We also explore the role of an Au back contact on the etching
characteristics for three different cases: (i) back contact is exposed to the
etchant, (ii) back contact is not exposed to the etchant, and (iii) etching with an
additional current injection from an applied bias. Next, we propose that there
are two possible causes for catalyst instability during MACE, namely the
overlap of excess holes between neighboring catalysts and the generation of
hydrogen (H
2
) bubbles. From these two modes of instability, we define a
viii
regime of etch chemistry and catalyst spacing for which catalyst stability and
vertical etching can be achieved.
Next, we investigate the etching characteristics with interconnected
catalyst configurations patterned using interference lithography (IL). We
propose that the role of excess holes is more significant in these catalyst
configurations such that the etched nanostructures possess a relatively high
degree of porosity. We demonstrate that the porosity of the nanostructures can
be exploited to obtain an ordered array of Si nanocones, which may find
applications in biomedical research, scanning probe nanolithography, or field-
emitting-tip devices. The influence of doping type and concentration on the
porosity of nanowires is examined. We further demonstrate that the porosity of
the nanostructures can be tuned from the etchant concentration.
Finally, we use an electric field to develop a new etching method called
bias- and metal-assisted chemical etching (BiMACE) of Si. Essential features
of BiMACE are presented and comparisons are made between MACE and
BiMACE. Quantitative analysis of the hole contribution to BiMACE without
and with H
2
O
2
is presented. The etching mechanism of BiMACE is discussed.
Application of BiMACE to fabricate Si nanowires is also demonstrated and its
possible extension to other semiconductor materials is suggested.
ix
List of Tables
Table 4.1: Summary of etching results on Au finger samples with Au back
contact for different biasing conditions. The voltage is relative to the front side
of the sample. [H
2
O
2
] and [HF] were fixed at 1.21 and 1.73 M, respectively,
and the etch duration was 15 minutes. ………………………………… … 61
Table 5.1: The change in nanowire height and the estimated change in
nanowire volume after the nanowires were etched in 10% HF solution for 1
minute at room temperature.
4
…………………………………………….… 74
x
List of Figures
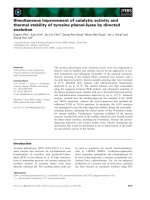
Figure 1.1: (a) Inverted pyramid arrays fabricated on Si <100> substrate.
26
(b)
High-aspect-ratio Si gratings fabricated on Si <110> substrate.
27
…… ……. 3
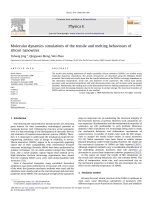
Figure 1.2: Silicon nanowalls (a) and nanopillars (b) fabricated using SF
6
and
CHF
3
reactive ion etching.
28
…………………………………………… … 4
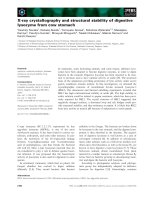
Figure 1.3: (a) Si nanofins obtained using Au perforated film etched in a
mixed solution of 4.6 M HF and 0.44 M H
2
O
2
.
19
(b-c) Cylindrical and helical
Si nanoholes obtained using Pt nanoparticles etched for 5 minutes in a mixed
solution of: (b) 50% HF, 30% H
2
O
2
, and H
2
O at a volume ratio of 2:1:8; (c)
50% HF and 30% H
2
O
2
at a volume ratio of 10:1.
32
(d) Swinging catalyst
etching etched in a mixed solution of 48% HF, 35% H
2
O
2
, and H
2
O at a
volume ratio of 4:1.3:2.8.
33
…………………………………………… …. 5
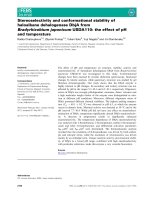
Figure 2.1: (a) Qualitative diagram comparing the energy levels of Si with five
metal reduction systems (E
c
and E
v
are the conduction and valence bands of
Si). (b) Schematic of electroless Ag deposition process on a Si substrate
immersed in HF/AgNO
3
solution.
30
…………………………………… 12
Figure 2.2: (a) Mechanism of nanowire formation using electrolessly
deposited Ag particles in HF/Fe(NO
3
)
3
system. (b) Si nanowire arrays
prepared in 5.0 M HF containing 0.02 M Fe(NO
3
)
3
.
30
………………… 13
Figure 2.3: (a) Au-coated Si(100) after etching in HF/H
2
O
2
for 30 seconds. (b)
Pt-coated Si (100) after etching in HF/H
2
O
2
for 30 seconds.
18
…… …… 14
Figure 2.4: Photoluminescence spectra from Pt-patterned Si after 30-second
etching in HF and H
2
O
2
.
18
……………………………………… ……… 17
Figure 2.5: (a)-(c) TEM micrographs of Si nanowires etched from 10, 0.01 and
<0.005 Ω.cm p-Si wafers, respectively. Scale bars are 100 nm for (a) and (b),
and 50 nm for (c).
42
……………………………………………… ……… 18
Figure 2.6: (a)-(g) SEM images of p-Si (100) samples after HF-H
2
O
2
etching
for ρ values of 7, 9, 14, 20, 27, 30, and 88%, respectively. (h) Diagram
illustrating the mechanism of the formation of cone-shaped pores in HF-H
2
O
2
solutions with 70% > ρ > 20%.
29
…………………………………….…… 19
Figure 2.7: (a)-(c) Nanowire arrays etched using a Au mesh with small hole
spacings patterned using BCP lithography on n(100), n(110), and n(111) Si
substrates, respectively. (d)-(f) Nanowire arrays etched using a Au mesh with
large hole spacings patterned using IL on n(100), n(110), and n(111) Si
substrates, respectively.
20
………………………………………………… 21
Figure 2.8: Surface bond orientation for three crystal planes: (100), (110), and
(111) in HF solution.
48
……………………………………………………… 22
Figure 2.9: (a) Top-view SEM image of Ag NPs etched in 5.3 M HF and 0.18
M H
2
O
2
for 1 minute. (b) Cross-sectional SEM image of Ag NPs etched in 5.3
M HF and 0.0018 M H
2
O
2
for 30 minutes.
24
…………………….…………. 23
xi
Figure 2.10: (a) Cross-sectional SEM image of Pt NPs etched in 50% HF, 30%
H
2
O
2
, and H
2
O (2:1:8 volume ratio) for 5 minutes. (b) Cross-sectional SEM
image of Pt NPs etched in 50% HF and 30% H
2
O
2
(10:1 volume ratio) for 5
minutes.
32
…………………………………………………………………… 24
Figure 2.11: (a)-(c) Cross-sectional SEM images of p-Si (111) loaded with Ag
NPs and etched in [H
2
O
2
] = 0.1, 0.02, and 0.002 M, respectively. (d) Cross-
sectional SEM image of p-Si (111) loaded with Ag NPs and etched for three
periods of the sequence: 1 minute in [H
2
O
2
] = 0.1 M and 10 minutes in [H
2
O
2
]
= 0.002 M. [HF] = 4.6 M for all samples.
51
………………………… …… 25
Figure 2.12: SEM images of Si etched with EBL-patterned Au nanolines (left
column) and Au dog-bone shapes (right column) for 40 minutes. Line widths
are 200, 100, 50, and 25 nm from left to right. Au thickness is 60 nm.
25
26
Figure 2.13: (a) SEM images of erratic etching for non-pinned catalysts. (b)
SEM images of “swinging” catalyst etching.
33
…………………………… 27
Figure 2.14: (a) Schematic diagram for electrochemical etching of Si, showing
potential distribution at the various interfaces. V
a
is the applied voltage, V
ref
is
the solution potential, V
H
is the Helmholtz potential, and V
scr
is the space-
charge potential. (b) Typical I-V relationship for Si in HF showing different
regimes of dissolution.
48
……………………………………………………. 29
Figure 2.15: (a) Schematic diagram illustrating the fabrication of Si
microstructures using electrochemical etching in HF. (b) Cross-sectional view
of an electrochemically etched wall array. (c) Top view of an
electrochemically etched meander-shaped wall array.
57
………………… 30
Figure 3.1: Schematic of a Si oxidation system. ……………………… …. 33
Figure 3.2: Ultra-i 123 softbaked thickness vs. spin speed. ……………… 34
Figure 3.3: Lloyd’s mirror configuration for interference lithography.
63
… 34
Figure 3.4: (a) Line, (b) dot, and (c) fin PR patterns generated using
interference lithography on a Si substrate. …………………………………. 35
Figure 3.5: (a) Optical lithography using contact printing exposure method. (b)
PR ring patterns on Si. …………………………………………………… 36
Figure 3.6: Schematic diagram of an RF-powered plasma etch system. … 37
Figure 3.7: Schematic diagram of a thermal evaporator. ……………… 38
Figure 3.8: (a) Schematic diagram of an ultrasonic bath. (b) Tilted view of PR
patterns coated with Au before lift-off. (c) Top view of inverse PR patterns on
Au after lift-off. Scale bar is 1 μm. ……………………………………… 39
Figure 3.9: Schematic illustrating MACE experiment. ………………….…. 40
Figure 3.10: (a) Schematic dependence of the interaction volume and
penetration depth as a function of incident energy E
0
and atomic number Z of
xii
the incident (primary) electrons.
66
(b) SEM incident beam that is normal to a
specimen surface (at A) and inclined to the surface (at B).
66
(c) Si nanowires
fabricated on Si substrate using MACE. (d) The same nanowire array which
has been shadow-evaporated with nickel (Ni). ………………………… … 41
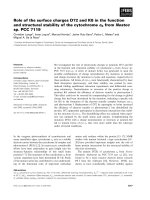
Figure 4.1: (a) Process steps for fabrication of Au strips using optical
lithography. (b) Schematic of photoresist patterns with different spacings. (c)-
(e) SEM images of Au strips with spacings of 2, 13 and 20 µm. The scale bar
for the SEM images is 20 µm. ………………………………………… … 46
Figure 4.2: Si etch rate versus the H
2
O
2
concentration for Au strips with 2-μm
spacing with fixed [HF] = 1.73M. ………………………………………… 47
Figure 4.3: (a) Schematic of hole injection into Si during MACE. (b)
Definitions of regions A and B. ……………………………………… …… 48
Figure 4.4: (a)-(e) Top-view SEM images of etched samples with strip
spacings 2, 9, 13, 17, and 20 μm, respectively. The [HF] and [H
2
O
2
] were
fixed at 1.73 and 1.21 M, respectively, and the etch duration was 15 minutes
for (a) and 20 minutes for (b) through (e). The scale bar for the SEM images is
10 μm. (f) Comparison of pit density in Region A for samples shown in (b)
through (e). ……………………………………………………….………… 49
Figure 4.5: (a)-(d) Top-view SEM images of etched samples with a strip
spacing of 20 μm, etched with H
2
O
2
concentrations of 0.15, 0.46, 0.76, and
1.21 M. [HF] was fixed at 1.73 M and the etch duration was 15 minutes. The
scale bar for the SEM images is 10 μm. (e) Comparison of pit density in
Region A for samples shown in (b) to (d). …………………………………. 50
Figure 4.6: (a) Schematic diagram illustrating the effect of adding NaCl to
etching solution. Na
+
adsorption at the Au-liquid interface suppresses H
+
adsorption and the injection of holes into the Au and Si. (b)–(d) Top-view
SEM images of samples with a 2-μm Au strip spacing; (b) without NaCl in
the etching solution and etched for 10 minutes, (c) with 10mM NaCl in the
etching solution and etched for 10 minutes, (d) with 10 mM NaCl in the
etching solution and etched to reach a depth of 0.9 µm. [HF] and [H
2
O
2
] were
fixed at 1.73 and 0.46 M, respectively. The scale bar for the SEM images is 2
μm. ………………………………………………………………………… 52
Figure 4.7: Top-view SEM images of samples with Au strips of 2-μm spacing
and etched with HF concentrations of (a) 1.73 M and (b) 27.5 M. The H
2
O
2
concentration was fixed at 0.46 M and the samples were etched for 15
minutes. The scale bar for the SEM images is 2 μm. ………………… … 53
Figure 4.8: (a) Schematic illustration of the experimental set-up used for
studies of etching in the presence of an external electric field. (b)–(d) Top-
view SEM images of samples with an Au strip spacing of 20 μm etched for 15
minutes in [HF] = 1.73 M and [H
2
O
2
] = 1.21 M with U = 0, 10, and 100 V,
respectively. The scale bar for the SEM images is 10 μm. …………………. 54
xiii
Figure 4.9: (a) SEM images of the backside surface of a virgin Si sample. (b)–
(d) Backside surface of samples with an Au strip spacing of 20 μm etched for
15 minutes in [HF] = 1.73 M and [H
2
O
2
] = 1.21 M, with U = 0, 10, and 100 V,
respectively. The scale bar for the SEM images is 5 μm. ……………… …. 55
Figure 4.10: Process steps to fabricate Au fingers with Au back contact. .… 57
Figure 4.11: Schematic illustrating MACE experiment for Au fingers with Au
back contact. The large Au pad is not immersed in the etchant solution. … 57
Figure 4.12: (a) and (b) are top-view SEM images of samples etched for 15
minutes with and without Au back contact, respectively. [H
2
O
2
] and [HF]
were fixed at 1.21 and 1.73 M, respectively. (c) Schematic illustrating the
creation of a PR step to obtain an absolute etch depth measurement. (d) and (e)
are cross-sectional SEM images of sample etched without Au back contact at
the active region and the reference point, respectively. (f) and (g) are cross-
sectional SEM images of sample etched with Au back contact at the active
region and the reference point, respectively. ………………………… …… 58
Figure 4.13: (a) Schematic illustration of etching experiment with a droplet.
The large Au pad was not exposed to the etchant droplet. (b) Top-view SEM
image of sample etched with a droplet for 15 minutes. [H
2
O
2
] and [HF] were
fixed at 1.21 and 1.73 M, respectively. ………………………………….…. 60
Figure 4.14: Surface morphology between Au strips for sample etched with I =
0.09 A and V = – 1 V (sample 3 in Table 4.1). [H
2
O
2
] and [HF] were fixed at
1.21 and 1.73 M, respectively, and the etch duration was 15 minutes. … … 61
Figure 4.15: (a) Schematic diagram defining the coordinates for the calculated
hole concentration. (b)-(c) Time evolution profiles of the hole concentration at
Au-Si interface during etching for Au strips with spacings of 20 μm and 2 μm,
respectively. (d)-(e) Cross-sectional SEM images of samples with Au strip
spacings of 20 μm and 2 μm, respectively. [H
2
O
2
] and [HF] were fixed at 1.21
and 1.73 M, respectively, and the samples were etched for 20 minutes. The
scale bar for the SEM images is 2 μm. …………………………………… 63
Figure 4.16: (a) Schematic illustrating the effect of trapped H
2
bubbles on the
etching profile. (b)-(d) SEM cross-sectional views of the etching profile with
[H
2
O
2
] = 0.017 M, [HF] = 1.73M, for samples with Au strip spacings of 2, 5,
and 20 μm, respectively. The scale bar for the SEM images is 2 μm. … …. 65
Figure 4.17: Stability diagram for MACE of Si as a function of the Au strip
spacing and the concentration of H
2
O
2
. …………………………………… 66
Figure 5.1: Schematic diagrams illustrating fabrication of Si nanowires or
nanofins using a combination of interference lithography and MACE. ……. 68
Figure 5.2: Si nanofins fabricated using interference lithography and MACE
on (a) p-Si (100) 4-8 Ω.cm, (b) p-Si (110) 1-10 Ω.cm, and (c) p-Si (111) 1-10
Ω.cm. ……………………………………………………………………… 69
xiv
Figure 5.3: Schematic of hole injection into Si during MACE using IL-
patterned catalyst. ………………………………………………………… 70
Figure 5.4: Schematic diagram illustrating the formation of porous Si
nanowires during MACE and the subsequent process flow to obtain Si
nanocones from nanowires. Note that the bending of nanowires is not
illustrated in this schematic diagram. ………………………………………. 70
Figure 5.5: SEM images of large-area, precisely located (a) straight, (c) top-
bent, and (e) severely bent Si nanowires that were etched in a mixed solution
of H
2
O, HF, and H
2
O
2
at room temperature, respectively. SEM images (b), (d),
and (f) show the different shapes of nanostructures after etching Si nanowires
in 10% HF solution for 1 minute at room temperature. SEM image (g) shows
Si nanocones produced by an additional wet thermal oxidation and HF etching
of the top-bent nanowires in (c).
21
……………………………………… 72
Figure 5.6: The SEM images of as-etched nanowires with (a) p-Si with
resistivity 10 Ω.cm, (c) p-Si with a lower resistivity of 0.1 Ω.cm, and (e) n-Si
with resistivity 0.1 Ω.cm. Etch durations were 10, 7, and 7 minutes for (a), (b),
and (c), respectively. SEM images of the respective nanocones obtained by
wet thermal oxidation and HF etch of the nanowires are shown in (b), (d), and
(f) respectively.
21
……………………………………………………… 75
Figure 5.7: Clustered Si nanofins fabricated using interference lithography and
MACE on (a) p-Si (100) 4-8 Ω.cm, (b) p-Si (110) 1-10 Ω.cm, and (c) p-Si
(111) 1-10 Ω.cm. Etch duration was 14 minutes for all samples. (a) shows
caterpillar-like nanofins while (b) and (c) show haystack-like nanofins. … 76
Figure 5.8: (a) Straight Si nanofins fabricated using interference lithography
and MACE. (b) The same Si nanofins after immersion in 10% HF for 1
minute. ……………………………………………………………… … … 77
Figure 5.9: Si nanowires etched with: (a) [H
2
O
2
] = 0.46 M for 10 minutes, (b)
[H
2
O
2
] = 0.2 M for 30 minutes, and (c) [H
2
O
2
] = 0.08 M for 60 minutes. [HF]
was fixed at 1.73 M. (d)-(f) are SEM images of the nanowires shown in (a)-
(c), after aged for ~ 1 day in atmospheric condition and etched in 10% HF for
1 minute. ……………………………………………………………… … 78
Figure 5.10: Si nanowires etched with: (a) [HF] = 1.73 M for 10 minutes, (b)
[HF] = 4.6 M for 5 minutes, and (c) [HF] = 8.63 M for 7 minutes. [H
2
O
2
] was
fixed at 0.46 M. (d)-(f) are SEM images of the nanowires shown in (a)-(c),
after aged for ~ 1 day in atmospheric condition and etched in 10% HF for 1
minute. …………………………………………………………………… 80
Figure 6.1: (a) Process steps for fabrication of Au fingers for BiMACE
experiments. (b) SEM image of Au fingers with a spacing of 20 μm. The scale
bar for the SEM image is 100 μm. (c) Schematic diagram illustrating the setup
for BiMACE experiment. …………………………………………… …… 83
xv
Figure 6.2: Cross-sectional SEM image of 20-μm-apart Au fingers etched with
[HF] = 1.73 M and U = 2 V for 30 minutes. The scale bar for the SEM image
is 10 μm. ………………… ………………………………………………. 85
Figure 6.3: (a) Si etch rate versus voltage for 20-μm-apart Au fingers using
BiMACE. (b)-(d) are cross-sectional SEM images of 20-μm-apart Au fingers
etched with U = 1, 1.5, and 2 V, respectively. [HF] = 1.73 M and etch duration
= 30 minutes. The scale bar for the SEM images is 10 μm. …………… …. 86
Figure 6.4: (a)-(b) Top-view SEM images of 20-μm-apart Au fingers etched
using MACE with H
2
O
2
concentrations of 1.21 M for 30 minutes (etch depth ~
3 μm) and 0.017 M for 4 hours (etch depth ~ 1 μm), respectively. (c) Top-view
SEM image of 20-μm-apart Au fingers etched using BiMACE with U = 2 V
for 30 minutes (etch depth ~ 3 μm). [HF] is fixed at 1.73 M for all the
samples. Scale bar for the SEM images is 10 μm. …………… ……… …. 86
Figure 6.5: (a)-(b) Cross-sectional SEM images of 2-μm-apart Au fingers
etched using MACE with H
2
O
2
concentrations of 1.21 M for 30 minutes and
0.017 M for 4 hours, respectively. (c) Cross-sectional SEM images of 20-μm-
apart Au fingers etched using BiMACE for 30 minutes with U = 1.5 V. [HF] is
fixed at 1.73 M for all the samples. Scale bar for the SEM images is 10 μm.
………………………………………………………………………………. 88
Figure 6.6: (a) Si etch rate versus voltage for 20-μm-apart Au fingers using
BiMACE with and without H
2
O
2
. (b) Number of reacting holes per unit time
versus voltage for 20-μm-apart Au fingers using BiMACE with and without
H
2
O
2
. (c) Current versus voltage for 20-μm-apart Au fingers using BiMACE
with and without H
2
O
2
. ……………………………………… ……… …. 90
Figure 6.7: Cross-sectional SEM images of 20-μm-apart Au fingers connected
to the negative terminal and etched using BiMACE for (a) double-side
polished p-type Si (100) of resistivity 1-10 Ω.cm with U = 2 V for 20 minutes;
(b) single-side polished n-type Si (100) of resistivity ≤ 0.005 Ω.cm with U = 1
V for 30 minutes; (c) double-side polished n-type Si (100) of resistivity 1-10
Ω.cm with U = 2 V for 20 minutes. [HF] is fixed at 1.73 M for all the samples.
The scale bar for the SEM images is 10 μm. …………… ……… ……… 91
Figure 6.8: (a) Schematic illustrating possible conduction paths in BiMACE.
(b) Electrical circuit representation of BiMACE system. …………… … 91
Figure 6.9: Cross-sectional SEM images of 20-μm-apart Au fingers etched
using BiMACE for (a) double-side polished p-type Si (100) of resistivity 1-10
Ω.cm with U = 2 V for 20 minutes; (b) single-side polished n-type Si (100) of
resistivity ≤ 0.005 Ω.cm with U = 1 V for 30 minutes; (c) double-side polished
n-type Si (100) of resistivity 1-10 Ω.cm with U = 2 V for 20 minutes. [HF] is
fixed at 1.73 M for all the samples. The scale bar for the SEM images is 10
μm. …………… ……… ………………………………………………… 92
Figure 6.10: Cross-sectional SEM images of 20-μm-apart Au fingers etched
using BiMACE for double-side polished n-type Si (100) of resistivity 1-10
xvi
Ω.cm for (a) U = 0.5 V and (b) U = 1.4 V. [HF] is fixed at 1.73 M and etching
duration is 20 minutes. The scale bar for the SEM images is 10 μm. … … 94
Figure 6.11: (a) SEM image of Au perforated film connected to an Au pad. (b)
Tilted-view SEM image of Si nanowires etched using BiMACE with U = 1.5
V and [HF] = 4.6 M for 35 minutes. Scale bar for the SEM image is 2 μm.
………………………………………………………………………………. 95
Figure A1: (a)-(c) Top-view SEM images of samples with an Au strip spacing
of 20 μm etched for 15 minutes in [HF] = 1.73 M and [H
2
O
2
] = 0.46 M with U
= 0, 10, and 100 V, respectively. The scale bar for the SEM images is 10 μm.
…………………………………………………………………………… 99
Figure B1: (a) Schematic of 2-D isotropic hole diffusion inside Si during
etching. (b)–(c) Top-view and cross-sectional SEM images of an etched
sample with strip spacing of 20 μm, etched with [H
2
O
2
] = 1.21 M. The [HF]
was fixed at 1.73 M and the etch duration was 20 minutes. The scale bar is 2
μm. …………………………………………………………………… …. 100
Figure C1: Cross-sectional SEM images of the etched samples used to
construct the stability diagram in Figure 4.17. [HF] was fixed at 1.73 M.
…………………………………………………………………………… 101
Figure D1: Si nanofins etched with: (a) [H
2
O
2
] = 0.46 M for 10 minutes, (b)
[H
2
O
2
] = 0.2 M for 30 minutes, and (c) [H
2
O
2
] = 0.09 M for 90 minutes. [HF]
was fixed at 1.73 M. (d)-(f) are SEM images of the nanofins shown in (a)-(c),
after aged for ~ 1 day in atmospheric condition and etched in 10% HF for 1
minute. The etch rates for (a), (b), and (c) are 300, 120, and 60 nm/min,
respectively. ……………………………………………………………… 102
Figure E1: Si nanofins etched with: (a) [HF] = 1.73 M for 10 minutes, (b)
[HF] = 4.6 M for 8 minutes, and (c) [HF] = 8.63 M for 10 minutes. [H
2
O
2
] was
fixed at 0.46 M. (d)-(f) are SEM images of the nanofins shown in (a)-(c), after
aged for ~ 1 day in atmospheric condition and etched in 10% HF for 1 minute.
The etch rates for (a), (b), and (c) are 300, 500, and 400 nm/min, respectively.
…………………………………………………………………………… 103
Figure F1: (a) Si nanowires etched for 6 minutes. (b) Si nanofins etched for 5
minutes. [HF] and [H
2
O
2
] were 4.6 and 0.46 M, respectively. Surface damage
is obvious at the top portion of both nanostructures. …………………… 104
Figure F2: (a) Schematic diagram illustrating the deposition of extraneous Au
NPs on the Si surface beneath the scalloped PR sidewall. (b)-(d) Si sample
with PR posts after: (b) Au deposition, (c) lift-off of PR posts, and (d) etching
for 1 minute. ………………………………………………………………. 105
Figure F3: Schematic diagrams illustrating fabrication of Si nanowires or
nanofins using a combination of interference lithography and MACE with
additional ARC layer. …………………………………………………… 106
Figure F4: (a) Schematic diagram illustrating the elimination of extraneous Au
nanoparticle deposition on the Si surface by using an ARC layer beneath the
xvii
PR. (b) Si sample with PR+ARC posts after Au deposition. (c) Si nanowires
after etching sample (b) for 7.5 minutes. (d) Si nanofins etched for 5 minutes
using the same procedure. ……………………………………………… 107
xviii
List of Symbols
2D Two-dimensional
3D Three-dimensional
AAO Anodic aluminum oxide
Ag Silver
AgNO
3
Silver nitrate
ARC Anti-reflection-coating
Au Gold
BCP Block copolymer
BiMACE Bias- and metal-assisted chemical etching
C(x,y,t) Hole concentration inside Si as a function of position
and time (etch duration)
C
0
Hole concentration at Au-Si interface
CHF
3
Trifluoromethane
Cl Chlorine
Cu Copper
Cu(NO
3
)
2
Copper (II) nitrate
D Hole diffusivity
DI Deionized
DOF Degree of freedom
E
0
Energy of primary electron
EBL Electron-beam lithography
E
C
Conduction band edge of Si
E
C,0
Conduction band edge of Si under zero bias
E
F
Fermi level
E
G
Band gap of Si
erfc Complementary error function
EtOH Ethanol
E
V
Valence band edge of Si
xix
E
V,0
Valence band edge of Si under zero bias
Fe Iron
Fe(NO
3
)
3
Iron (III) nitrate
G Conductance
GaAs Gallium arsenide
GaN Gallium nitride
h
+
Electronic holes
H
+
Proton
H
2
Hydrogen
H
2
O Water
H
2
O
2
Hydrogen peroxide
H
2
SiF
6
Hexafluorosilicic acid
HCl Hydrochloric acid
HeCd Helium cadmium
HF Hydrofluoric acid
I Current
IL Interference lithography
J
n
Electron current
J
p
Hole current
J
PS
Critical current density
J
walls
Spread current
K
2
Cr
2
O
7
Potassium dichromate
K
2
PtCl
6
Potassium hexachloroplatinate (IV)
KAuCl
4
Potassium gold (III) chloride
KMnO
4
Potassium permanganate
KOH Potassium hydroxide
L
p
Hole diffusion distance
M Molar
MACE Metal-assisted chemical etching
xx
n Donor-doped Si
Na Sodium
Na
2
S
2
O
8
Sodium persulfate
NaCl Sodium chloride
NH
4
OH Ammonium hydroxide
NHE Normal hydrogen electrode
Ni Nickel
NP Nanoparticle
O
2
Oxygen
p Acceptor-doped Si
p Spatial period in IL setup
Pd Palladium
pH Acidity
PL Photoluminescence
PR Photoresist
Pt Platinum
R Resistance
RCA Radio Corporation of America
RF Radio frequency
RIE Reactive Ion Etching
SC Standard cleaning
SE Secondary electron
SEM Scanning electron microscope
SF
6
Sulfur hexafluoride
Si Silicon
SiGe Silicon germanium
SiO
2
Silicon dioxide
TEM Transmission electron microscope
U Voltage bias
xxi
UV Ultraviolet
V Voltage
VB Valence band
V
H
Helmholtz potential
VLS Vapor-liquid-solid
V
sc
Space-charge potential
Z Atomic number
φ Angle between primary electron and sample surface
Φ Work function
Φ
B
Schottky barrier height
χ Electron affinity of Si
λ Laser wavelength in IL setup; escape depth in SEM
ρ Molar ratio, defined as [HF]/([HF]+[H
2
O
2
])
θ Half-angle in IL setup
Ω Unit of resistance
1
Chapter 1. Introduction
1.1 Background
Nanostructures are assembly of materials in microscopic scale. In 1960,
Feynman
1
predicted that materials which are manipulated on such a small
scale could exhibit interesting properties which are absent in macroscopic
scale. In particular, many potential applications have been demonstrated for
silicon (Si) nanostructures, such as Si nanowire-based field effect
transistors,
2,3
nanowire anodes for batteries,
4,5
thermoelectric devices,
6
biomedical sensors,
7,8
photovoltaic cells,
9,10,11
and templates for magnetic data
storage.
12
These Si nanostructures are fabricated using either bottom-up
(growth) or top-down (etching) approaches.
The most well-known growth method is the vapor-liquid-solid (VLS)
mechanism,
13
in which chemical vapor deposition is used with a metal catalyst
particle (e.g. Au) under conditions for which growth occurs only at the
particle-silicon interface. However, the use of the VLS process for
applications has a number of drawbacks. First, the VLS technique only allows
formation of cylindrical wires. In many applications, one-dimensional
nanostructures with other cross-sectional shapes would be useful. For
example, fin shapes are of great interest for use in metal-oxide-semiconductor
field effect transistors in which the channel current can be more readily
controlled than in planar or cylindrical structures.
14,15
Second, there are
concerns with the use of catalysts such as Au at the temperatures required for
VLS processes, because the catalyst metal is likely to be incorporated into the
wires. Third, crystallographic orientation of the grown nanowire depends on
2
its diameter.
16
Also, it has been found that no wires can be grown on highly
doped Si wafers.
17
Among various etching methods, the metal-assisted chemical etching
(MACE)
18
has recently emerged as a promising method to fabricate Si
nanostructures for several reasons. First, cross-sectional shapes of the etched
nanowires can be readily varied.
19
Second, it is a low-temperature process and
thus, Au incorporation into Si can be eliminated. Third, crystallographic
orientation of the nanowires can be controlled.
20
Fourth, MACE is known to
work on Si wafers independent of doping type and level.
21
Finally, it is able to
produce very high-aspect-ratio structures,
22
which are hardly achievable by
any other fabrication methods.
However, due to difficulties in direct in-situ observation, the exact
mechanism of MACE is still under scrutiny. For example, there are different
proposed chemical reactions governing MACE process as reported in the
literature.
23
It is also intriguing as to why isolated catalyst tend to change its
etch directions in a non-uniform manner,
24,25
in contrast to etching with
interconnected catalyst.
19,20
It is therefore important to conduct a more
systematic study on the mechanism of and catalyst stability in MACE in order
to gain better leverage of this process to sculpture Si. The subsequent sections
will describe general etching methods of Si, followed by a brief overview of
MACE.