Probabilistic models for reliability assessment of ageing equipment and maintenance optimization
Bạn đang xem bản rút gọn của tài liệu. Xem và tải ngay bản đầy đủ của tài liệu tại đây (2.85 MB, 169 trang )
PROBABILISTIC MODELS FOR RELIABILITY
ASSESSMENT OF AGEING EQUIPMENT AND
MAINTENANCE OPTIMIZATION
SARANGA KUMUDU ABEYGUNAWARDANE
(B.SC., UNIVERSITY OF PERADENIYA, SRI LANKA)
A THESIS SUBMITTED
FOR THE DEGREE OF DOCTOR OF PHILOSOPHY
DEPARTMENT OF
ELECTRICAL AND COMPUTER ENGINEERING
NATIONAL UNIVERSITY OF SINGAPORE
2013
DECLARATION
I hereby declare that this thesis is my original
work and it has been written by me in its entirety.
I have duly acknowledged all the sources of
information which have been used in the thesis.
This thesis has also not been submitted for any
degree in any university previously.
Saranga Kumudu Abeygunawardane
24 December 2012
i
Acknowledgements
I wish to thank everyone who helped me during my doctoral studies.
First, I express my sincere gratitude to my supervisor, Asst. Prof. Panida Jirutitijaroen for
giving me an opportunity to pursue my doctoral studies in National University of Singapore.
Her constant guidance and sincere advice greatly helped me to overcome difficulties that I
encountered in my research. I truly appreciate the efforts that she made to develop my
research and communication skills and to revise my papers. I am also thankful to her for
giving friendly advice when I faced hard times in my personal life. Her kind and friendly
behavior greatly helped to reduce the greatest sorrow that I have ever experienced in my life
due to the loss of my beloved father.
Next, I would like to thank Asst. Prof. Huan Xu for his valuable ideas, suggestions and
support given towards my research. I am also grateful to my thesis committee members for
their time, constructive comments and suggestions.
I would like to acknowledge National University of Singapore and the Department of
Electrical and Computer Engineering for providing academic and financial support during my
doctoral studies.
I also want to thank Thillainathan Logenthiran, Xiong Peng, Bordin Bordeerath, Shu
Zhen, Bai Hong, Bi Yunrui, Sumith Madampath and all my colleagues in the power systems
laboratory and the lab officer, Mr. H. C. Seow for the tremendous support given at the lab. I
appreciate the valuable friendship of Arunoda Basnayake, Supunmali Ahangama, Chamila
Liyanage, Thanuja Kulathunga and Rupika Swarnamala. I think I am fortunate to have such
friends and colleagues during my stay in Singapore.
I should not miss to convey my gratitude to all my teachers who strengthened me and
supported me, when I was a student at Ferguson High School and University of Peradeniya. I
would especially like to mention the names of two teachers whom I adore most; Mrs. Lilani
Jayasinghe (FHS) and Prof. Janaka Ekanayake (UOP). I should not forget to thank Ass. Prof.
ii
Saman Abeysekara (NTU), who motivated me to apply for doctoral scholarships in
Singapore.
Last but not least, I would like to thank my beloved family members for their love,
admiration and encouragement. I wish my father was alive to share the pleasure of completing
this PhD thesis. I dedicate this thesis to my late father.
iii
Table of Contents
Abstract vii
List of Tables viii
List of Figures x
List of Abbreviations xiii
List of Symbols xiv
Chapter 1 : Introduction 1
1.1 The Background 1
1.1.1 Ageing of Equipment 1
1.1.2 Maintenance 2
1.2 Literature Review 4
1.3 Research Objectives 6
1.4 Thesis Outline and Organization 8
Chapter 2 : A New Probabilistic Model for Scheduled Maintenance 9
2.1 Introduction 9
2.2 Classical State Diagrams in Maintenance Modeling 10
2.2.1 A Generalized Classical State Diagram 10
2.2.2 An Idealistic Modeling Property of Classical State Diagrams 10
2.3 The Proposed Scheduled Maintenance Model 11
2.3.1 The Proposed State Diagram 11
2.3.2 Mathematical Realization of Maintenance Models 15
2.4 A Numerical Example 18
2.5 Summary 22
Chapter 3 : Applications of Markov Maintenance Models to Power Systems 25
3.1 Introduction 25
3.2 Reliability and Cost Analysis of Circuit Breakers 26
iv
3.2.1 Reliability and Cost Assessments 26
3.2.2 Effect of Inspection and Maintenance on Reliability 29
3.3 State Prediction of Transformers 41
3.3.1 Deterioration and Condition Monitoring of Transformers 42
3.3.2 Classification of Transformers and Hypothesis Testing 44
3.3.3 Results and Analysis of Hypothesis Testing 46
3.3.4 State Prediction Model 49
3.3.5 Results and Analysis of State Prediction 50
3.4 Effects of Subcomponent Characteristics on Reliability of a Wind Energy
Conversion System 53
3.4.1 A Wind Energy Conversion System 54
3.4.2 A Markov Model for a Wind Energy Conversion System 57
3.4.3 A Test System 60
3.4.4 A Sensitivity Analysis of Sub Component Characteristics on the System
Reliability 62
3.5 Summary 69
Chapter 4 : Reliability and Cost Trade-off in Maintenance Strategies Using Probabilistic
Models 71
4.1 Introduction 71
4.2 Maintenance Models, Performance Measures and Decision Variables 72
4.2.1 Maintenance Models 73
4.2.2 Performance Measures 74
4.2.3 Decision Variables 76
4.3 Selection of Optimal Inspection Rates 77
4.3.1 Relationships among Different Performance Measures 77
4.3.2 Sensitivity Analyses of Inspection Rate on First Passage Time and Total
Cost 79
4.3.3 Problem Definition 82
v
4.3.4 A Grid Search Algorithm 82
4.4 Case Studies 83
4.4.1 85
4.4.2
86
4.5 Discussion 88
4.6 Summary 90
Chapter 5 : Adaptive Maintenance Policies Using a Markov Decision Process 91
5.1 Introduction 91
5.2 Background 92
5.2.1 Markov Decision Processes in Power Systems 92
5.2.2 The Framework of a Markov Decision Process 93
5.2.3 Inspection and Maintenance Decision Making in Actual Practice 95
5.2.4 Modeling the Process of Decision Making 97
5.3 Problem Formulation 98
5.3.1 Decision epochs 99
5.3.2 States and Actions 99
5.3.3 Transition Probabilities and Rewards 103
5.3.4 Incorporating the Effects of Aging 104
5.4 Solution Procedure 105
5.5 Case Study 107
5.5.1 Condition Based Maintenance of Oil Insulated Transformers 107
5.5.2 The Markov Decision Process Model of Transformers 108
5.5.3 Results and Discussion 111
5.6 Using Markov Decision Process Models in System-level Maintenance Planning
116
5.7 Summary 119
vi
Chapter 6 : Conclusions and Future Work 121
6.1 Conclusions 121
6.2 Future Research Work 123
6.2.1 Model Development and Applications 123
6.2.2 Maintenance Optimization 124
6.2.3 System-level Maintenance Planning 124
Bibliography 126
List of Publications 135
Appendix A : The Proposed Markov Decision Process Model for Transformers 136
Appendix B : Deterioration Probabilities for the Markov Decision Process Model of
Transformers 143
vii
Abstract
Many electrical devices with considerable life spans are subjected to deterioration
throughout their useful lives. Catastrophic failures of such devices in power systems can
result in substantial social and economic losses. Maintenance is commonly performed to
Probabilistic maintenance models are widely used to quantify the benefits of maintenance in
terms of reliability and costs and to determine optimal maintenance policies. This thesis aims
to propose analytically solvable probabilistic models to obtain accurate results in power
system reliability assessments and maintenance optimization.
The thesis first proposes a new Markov model for scheduled maintenance. This proposed
model can accurately assess reliability and costs, while the existing Markov maintenance
models provide accurate results only for periodic inspections. The proposed and existing
models are applied to assess reliability and costs of circuit breakers. In two other application
studies, Markov models are utilized for state prediction of transformers and for analyzing the
effects of sub-component characteristics on reliability of a wind energy conversion system. A
maintenance optimization problem is formulated to find optimal inspection rates using a grid
search algorithm. Optimization results show that practical solutions can be obtained with the
careful selection of maintenance models. To obtain adaptive optimal inspection and
maintenance policies, a Markov decision process (MDP) model is proposed. This model can
explicitly incorporate inspection and maintenance delay times and combine the long term
The
applicability of the model is demonstrated using historical condition monitoring and
maintenance data of local transformers. System-level maintenance planning is investigated
using a system-wide MDP model and through the coordination of MDP models of individual
equipment. The proposed models are valuable for reliability evaluation, maintenance-related
cost assessments, maintenance decision making and maintenance planning.
viii
List of Tables
Table 2.1: Transition Rates (1/years) [29] 20
Table 2.2: State Probabilities 21
Table 2.3: Visit Frequencies (1/years) 21
Table 2.4: Mean Durations (years) 21
Table 2.5: Reliability Indices (years) 22
Table 2.6: Percentage Deviations of Reliability Indices 22
Table 3.1: Costs ($) [7] 28
Table 3.2: Reliability Indices and Costs for Imperfect Maintenance Models [30] 28
Table 3.3: Percentage Deviations of Reliability Indices and Cost Measures 29
Table 3.4: Test Statistics for Transformers Grouped by Maximum Loading 47
Table 3.5: Test Statistics for Transformers K-Means Clustered by First Year of Operation 47
Table 3.6: Test Statistics for Transformers K-Means Clustered by Loading 48
Table 3.7: Test Statistics for Transformers K-Means Clustered by Loading and Age 49
Table 3.8: Actual and Predicted States of Transformer A 51
Table 3.9: Actual and Predicted States of Transformer B 52
Table 3.10: Actual and Predicted States of Transformer C 52
Table 3.11: Actual and Predicted States of Transformer D 53
Table 3.12: Equivalent Failure Rates and Repair Rates of Sub-groups 60
Table 3.13: Transition rates from up state to de-rated state and from de-rated state to down
state 62
Table 4.1: Constrain
max
and Hourly Interruption Costs 84
Years 86
Table 4.3: Results Obtained Using the Condition Monitoring Based Inspection and
s 86
87
ix
Table 4.5: Results Obtained Using the Condition Monitoring Based Inspection and
100 Years 87
Table 5.1 (a): Deterioration/Failure Probabilities 108
Table 5.1 (b): Deterioration/Failure Probabilities 109
Table 5.2: Transition Probabilities upon Choosing Maintenance Actions at C
3
110
Table 5.3 (a): Optimal Actions to Perform Condition Monitoring at C
1
112
Table 5.3 (b): Optimal Actions to Perform Condition Monitoring at C
1
113
Table 5.4 (a): Optimal Actions to Perform Condition Monitoring at C
2
114
Table 5.4 (b): Optimal Actions to Perform Condition Monitoring at C
2
115
Table 5.5: Optimal Actions to Perform Condition Monitoring at C
3
115
Table 5.6: Optimal Actions to Perform Maintenance 116
Table 5.7: Budget Constraints 118
Table 5.8: Optimal Actions for Case Study 1 118
Table 5.9: Optimal Actions for Case Study 2 118
Table 5.10: Optimal Actions for Case Study 3 119
Table B.1 (a): Deterioration Probabilities for the Markov Decision Process Model of
Transformers 143
Table B.1 (b): Deterioration Probabilities for the Markov Decision Process Model of
Transformers 144
Table B.1 (c): Deterioration Probabilities for the Markov Decision Process Model of
Transformers 145
Table B.1 (d): Deterioration Probabilities for the Markov Decision Process Model of
Transformers 146
Table B.1 (e): Deterioration Probabilities for the Markov Decision Process Model of
Transformers 147
Table B.1 (f): Deterioration Probabilities for the Markov Decision Process Model of
Transformers 148
Table B.1 (g): Deterioration Probabilities for the Markov Decision Process Model of
Transformers 149
Table B.1 (h): Deterioration Probabilities for the Markov Decision Process Model of
Transformers 150
x
List of Figures
Figure 1.1: Bathtub curve [5] 2
Figure 1.2: Overview of maintenance approaches [2] 3
Figure 2.1: A generalized classical state diagram 10
Figure 2.2: The proposed state diagram for probabilistic maintenance models 14
Figure 2.3: The reduced state diagram of the proposed state diagram in Figure 2.2 15
Figure 2.4: Example of a classical state diagram [29] 19
Figure 2.5: The proposed state diagram 19
Figure 3.1: Example of a classical state diagram for imperfect maintenance [7] 27
Figure 3.2: The proposed state diagram for imperfect maintenance 27
1
2
30
1
3
30
2
1
31
Figure 3.6: The variation of mean time between
2
3
32
3
1
33
3
2
33
Figure
1
2
34
1
3
35
2
1
36
Figur
2
3
36
3
1
37
3
2
37
Figure 3.15: Loading profiles of transformers grouped using k-means clustering 44
xi
Figure 3.16: Critical region 46
Figure 3.17: The state diagram of the state prediction model 50
Figure 3.18: Nacelle of a typical geared wind turbine [57] 54
Figure 3.19: Reliability block diagram of a typical wind energy conversion system [58] 55
Figure 3.20: Distribution of number of failures 56
Figure 3.21: Percentage of downtime per component 56
Figure 3.22: State space diagram of the proposed wind energy conversion system 59
Figure 3.23: Intermediate states model 61
Figure 3.24: Two-state model 61
Figure 3.25: The variation of mean time to failure with failure rates 64
Figure 3.26: The variation of mean time to repair with failure rates 65
Figure 3.27: The variation of mean time to repair with repair rates 66
Figure 3.28: The variation of availability with failure rates 67
Figure 3.29: The variation of availability with repair rates 68
Figure 4.1: The state diagram of the condition monitoring based inspection and maintenance
model 73
Figure 4.2: The state diagram of the inspection based maintenance model [7] 74
Figure 4.3: The variation of first passage time with
1
79
Figure 4.4: The variation of first passage time with
2
80
Figure 4.5: The variation of first passage time with
3
80
Figure 4.6: The variation of total cost with
1
81
Figure 4.7: The variation of total cost with
2
81
Figure 4.8: The variation of total cost with
3
82
Figure 5.1: Decision horizon, decision intervals and decision epochs 94
Figure 5.2: The simple state transition diagram of a Markov decision process model 95
Figure 5.3: Decision making process regarding inspection and maintenance 96
xii
Figure 5.4 (a): The state transition diagram of the proposed Markov decision process model
for maintenance decision making 100
Figure 5.4 (b): The state transition diagram of the proposed Markov decision process model
for maintenance decision making 101
Figure 5.5: Decision epochs at different age levels of the equipment 105
Figure 5.6: The Markov decision process model of equipment A 117
Figure 5.7: The Markov decision process model of equipment B 117
Figure A.1 (a): The proposed Markov decision process model for transformers 136
Figure A.1 (b): The proposed Markov decision process model for transformers 137
Figure A.1 (c): The proposed Markov decision process model for transformers 138
Figure A.1 (d): The proposed Markov decision process model for transformers 139
Figure A.1 (e): The proposed Markov decision process model for transformers 140
Figure A.1 (f): The proposed Markov decision process model for transformers 141
Figure A.1 (g): The proposed Markov decision process model for transformers 142
xiii
List of Abbreviations
CBM
Condition monitoring based inspection and maintenance
CM
Condition monitoring
DGA
Dissolved gas analysis
FPT
First passage time
IBM
Inspection based maintenance
MDP
Markov decision process
MDT
Mean down time
MTBF
Mean time between failures
MTTF
Mean time to failure
MTTFF
Mean time to first failure
MTTR
Mean time to repair
NRD
Non-redrawing
RD
Redrawing
TDCG
Total dissolved combustible gases
WECS
Wind energy conversion system
xiv
List of Symbols
a
Action
A
Transition probability matrix
a
0
Doing nothing
a
1
Inspection/ CM
a
2
Minor maintenance
a
3
Major maintenance
a
4
Replacement
a
5
Repair
Optimal action in state i at the decision epoch t
C
i
Last known condition of the equipment
C
I
Costs of performing an activity of inspection
C
M
Costs of performing an activity of minor maintenance
C
MM
Costs of performing an activity of major maintenance
C
F
Costs of performing an activity of repair
C
IC
Hourly interruption cost
C
LP
Hourly loss of profit
C
S
Cost of performing an activity in state S
Set of decision epochs
d(S)
Mean duration in state S
i
Transition rate from I
i
to M
i
F
Failure state
FI
Frequency of interruption
f(S)
Frequency of entering or leaving state S
FI(S)
Frequency of interruption due to activities in state S
G
i
Grid of values of
i
xv
i
Inspection rate at the deterioration stage S
i
of the scheduled maintenance
model
c
Inspection rate of a transformer in condition c
max
The maximum inspection rate
i
Present state of the equipment
IC
Annual interruption cost
I
i
Inspection state corresponding to the i
th
deterioration stage
State at the decision epoch
i
Deterioration rate of the i
th
deterioration stage
Deterioration rate of the condition C
Transition rate from up state to de-rated state of sub-component i, i=1, 2, 4
Transition rate from de-rated state to down state of sub-component i, i=1, 2, 4
3
Transition rate from up state to down state of sub-component 3
i
Failure rate of sub-component i
eq
Equivalent failure rate
UD
Transition rate from up state to de-rated state
DD
Transition rate from de-rated state to down state
eq
Equivalent repair rate
i
Transition rate from down state to up state of sub-component i, i=1, 2, 3, 4
LCC
Annual life cycle cost
LP
Annual loss of profit
M
i
Minor maintenance state corresponding to the i
th
deterioration stage
MM
i
Major maintenance state corresponding to the i
th
deterioration stage
MTTR
i
Average time required to repair component i
MTTR
eq
Average down time of the WECS
i
Maintenance rate at M
i
Total number of states
xvi
Number of inspections conducted when the condition is c
N
Number of decision epochs
Number of consecutive times that the inspection is postponed
n
max,i
The maximum number of decision intervals that the equipment spends in C
i
Steady state probability vector
Steady state probability that the embedded Markov chain is in state S
P
U
Probability of being staying in up state of the intermediate states model
P
DR
Probability of being staying in de-rated state of the intermediate states model
P
D
Probability of being staying in down state of the intermediate states model
P
U*
Probability of being staying in up state of the two-state model
P
D*
Probability of being staying in down state of the two-state model
P(S)
Steady state probability of state S
P
c
Probability of being found in deterioration condition c
Probability of transiting from state i to any state kS, upon choosing action a
in state i at the t
th
decision epoch
Boundary value of state i
Summation of the transition rates from state S to other neighboring states
Immediate reward for choosing action in state at the decision epoch
S
Set of states
S
i
i
th
deterioration stage
S
i,k
Sub deterioration state k of the deterioration state i
S
c
Deterioration stage corresponding to the C
th
condition of a transformer
t
th
decision epoch
t
c
Duration that the transformer spent in condition c
T
Decision horizon
T
o
Total time of observation
Interval at which I & M decision making is performed
xvii
I
Time interval between two consecutive inspections
TC
Annual total cost
t
I
Time to perform next inspection
t
M
Time taken to perform maintenance
t
I,i
Time to perform next inspection when the last known condition is C
i
(inspection delay time in C
i
)
t
max,i
The maximum allowable time between two consecutive inspections in C
i
t
min,i
The minimum time between two consecutive inspections in C
i
t
M,i
Time spent in C
i
(maintenance delay time in C
i
)
t
i
The maximum time period spent in condition C
i
Average time spent in the condition C
U
Unavailability
U(S)
Unavailability caused by the activities in state S
Total expected reward received upon choosing action a in state at time
The maximum total expected reward in state , at the N
th
epoch
The maximum total expected reward in state , at the decision epoch t+1
The maximum total expected reward in state , at the t
th
epoch
z
Test statistic of hypothesis testing
1
Chapter 1 : Introduction
Most equipment in electrical transmission and distribution networks has been in use for
several decades [1]. Catastrophic failures of such aging equipment can reduce system
reliability, while causing substantial economic losses. However, replacing this aging
equipment in bulk will be unbearable due to financial constraints. Therefore, electrical
utilities adopt different maintenance strategies to minimize the occurrence of catastrophic
failures. Too frequent inspection and maintenance would increase the cost of performing
inspection and maintenance. On the other hand, lesser inspection and maintenance would
result in a lower reliability level. Thus, it is desirable to perform maintenance in an optimal
manner. In order to determine optimal maintenance policies, the benefits of maintenance
should be quantified in terms of reliability and costs using maintenance models. This chapter
reviews the literature on maintenance models after providing some background information
related to ageing and maintenance.
1.1 The Background
1.1.1 Ageing of Equipment
In power systems, most electrical equipment is continuously in operation and is
subjected to wear out over time. E physical and electrical strengths gradually
deteriorate, until a failure occurs at some point of time causing a termination of
operation. This process is called the deterioration process [2] or the ageing process [3] of
equipment. The physical and
electrical strengths as a function of chronological time in operation [4]. There are two main
types of equipment failures, namely, random failures and deterioration failures. Random
condition. Deterioration failures are the failures that occur due to deterioration of equipment
condition.
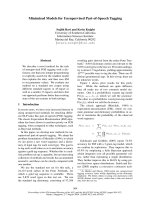
The failure rate of equipment is not uniform with the age. In reliability theory, the
2
shown in Figure 1.1 [5]. The bathtub curve is a combination of early failures, wear out
failures and random failures of the equipment. Since failures in the early life of the equipment
are mostly due to defects in manufacturing and problems in installation, the failure rate
decreases in the infant mortality region. In the useful life region, failures occur at random and
thus the failure rate is constant. In the wear out region, failure rate increases, as the ageing
progresses.
Typically, the design life of equipment spans across the infant mortality and useful life
regions. Equipment which is in operation beyond its design lifetime is called aging equipment
[3].
Age
Failure
rate
Early
failures
Useful life
Wearout
failures
Random
failures
Infant
mortality
Wearout
Overall
curve
Figure 1.1: Bathtub curve [5]
1.1.2 Maintenance
Many costly electrical devices such as transformers, generators and circuit breakers are
usually not replaced at the end of their useful life specified by the manufacturer. Utilities
prefer to use them in operation as long as possible. However, in every year, such electrical
equipment in power systems gets older and their deterioration mechanisms get accelerated. In
order to improve the condition of ageing equipment, maintenance activities are performed. By
performing maintenance regularly, the deterioration of the equipment is arrested, reduced or
eliminated [2]. It is noteworthy that maintenance is different from the repair activity which is
performed on a failed equipment to improve its condition from the failed condition to an
3
operable condition [2].
Utilities adopt different maintenance strategies. According to the classification in [2], an
overview of maintenance approaches is shown in Figure 2.1. Basic maintenance approaches
described in [2]
maintenance and predictive maintenance. The simplest maintenance approach is to perform
maintenance based on the long term experience or
recommendations given in manuals [2]. Replacement schemes ignore the possible small scale
improvements in the equipment condition which can be performed at a lower cost.
Scheduled maintenance is carried out at regular intervals according to a fixed schedule [2].
Predictive maintenance activities are performed when periodic inspections or condition
monitoring reveals that it is necessary to perform maintenance [2].
Maintenance
Age, bulk
Manufacturer’s
specifications
Replacement
Scheduled
maintenance
Predictive
maintenance
Condition
monitoring
Analysis of needs
and priorities
Reliability centered
maintenance
Mathematical
models
Empirical
approaches
Figure 1.2: Overview of maintenance approaches [2]
Maintenance is beneficial to both electrical utilities and power consumers. Through
maintenance strategies, utilities can reduce costly equipment replacements by extending
social and economic losses experienced by power consumers due to sudden power failures
can be minimized through timely inspection and maintenance. However, too frequent
inspection and maintenance would unnecessarily increase the cost of inspection and
4
maintenance. It would also increase the number of planned outages, and cause economic
losses to consumers [6], especially to industries that consume power in a large scale. During
outages, utilities too will experience economic losses due to loss of profit that they generate
by selling electricity. Thus, optimal maintenance strategies should be determined considering
the trade-off between reliability and costs.
1.2 Literature Review
In order to determine optimal maintenance policies, the effect of inspection and
maintenance should be quantified in terms of reliability and costs. Probabilistic maintenance
models [7-24] are preferably used for this purpose in preventive maintenance studies as well
as in reliability centered maintenance approaches, due to their simplicity and the ability to
incorporate uncertainties associated with the deterioration of equipment and the outcomes of
inspection and maintenance. Many probabilistic maintenance models are based on state
diagrams due to two main advantages. Firstly, state diagrams can combine deterioration,
inspection and maintenance processes of a device to form simple and straightforward
graphical models which indicate connections between different states of the device. Secondly,
state diagrams can be directly converted into mathematical models called Markov models
which can be easily solved using standard methods and analytical equations.
Markov maintenance models are firstly used to model scheduled maintenance when
inspection rates are periodic [8, 9, 25]. Later, with the change in the maintenance practice to
increase the inspection frequency based on the knowledge of the increased deterioration level
of the device, non-periodic inspection rates are introduced to state diagrams in maintenance
modeling [10-15, 26]. In [7], a non periodic inspection and maintenance model is proposed
for the maintenance of high voltage air blast circuit breakers. It is discussed further in [10]
and utilized in an asset management planner which can be used to decide the best
maintenance option which maximizes reliability with a minimum cost. In [12], a maintenance
model is proposed for the inspection and maintenance of oil immersed transformers and it is
later used in [13] to analyze the effect of different inspection rates on reliability and all
associated costs. Based on the results in [13], it has been suggested to increase the inspection
5
rate with the deterioration for effective maintenance in terms of cost and reliability. A similar
probabilistic model has been introduced in [14] for the inspection and maintenance of circuit
breakers. This model is utilized in [15] to carry out a sensitivity analysis and this analysis has
shown that the probability of failure and the total cost can be reduced by conducting
inspections at a higher rate when the device is more deteriorated. Based on the model in [7], a
decision varying Markov model is proposed in [27] to occupy different transition probabilities
depending on the maintenance decisions made at different time intervals. This model is
applied in [27] for optimization of substation maintenance. In [28], the same model is applied
for composite power systems to optimize maintenance schedules. However, the above
mentioned Markov maintenance models are unable to represent the actual maintenance
situation of equipment [29].
Reaching a major milestone, unrealistic properties of the basis of above maintenance
models are first discussed in [29]. Some interesting results are provided in [29] by comparing
the results of a Markov model with Monte Carlo simulation results. These results prove that
existing Markov maintenance models provide accurate results for periodic inspections, but
they do not provide accurate results when inspection rates are non-periodic [29]. The author
of this paper concludes that any Markov maintenance model based on state diagrams do not
provide accurate results.
In view of this, an alternative model is proposed in [29] to obtain accurate results. This
model proposed in [29] assumes that the deterioration process and inspection and
maintenance process are two independent processes, which are only connected at inspection
and maintenance or failures. Due to this assumption, an effort has been made to eliminate
direct connections between the two processes. This effort finally led to a complicated state
diagram for a probabilistic maintenance model. The main drawback of this graphical model in
[29] is the difficulty of finding analytical solutions. To solve this model, Monte Carlo
simulation is required. One of the intentions of the work presented in this thesis is to propose
scheduled maintenance models based on new state diagrams which can be analytically solved
using Markov techniques to obtain accurate results.
6
In addition, this thesis highlights two main issues which are still not addressed in
previously proposed maintenance models. Firstly, time delays in making decisions regarding
inspection and maintenance are not included in most previous models [7, 8, 13, 15, 19, 21, 22,
30-41]. Since optimal inspection and maintenance actions may depend on delay times in
making decisions regarding inspection and maintenance, these delays should be considered
when determining optimal policies. Secondly, time based maintenance models represent
[7, 8, 13, 15, 19, 21, 22,
30-35], while condition based maintenance models represent the deterioration of the
equipment by some observable measurements [36-43]. However, the deterioration of the
accurate if models can integrate the deteriorat
effects of ageing on deterioration. If a model can address the two aforementioned issues, such
a model would be able to provide more adaptive inspection and maintenance policies. This
thesis intends to propose a Markov decision process model to address the abovementioned
two issues.
1.3 Research Objectives
In view of the review in section 1.2, there is a need to propose new maintenance models
which address the limitations of maintenance models in the literature. The main objective of
this thesis is to propose analytically solvable maintenance models to obtain accurate results in
power system reliability assessments and maintenance optimization. The specific objectives
within this general objective and the significance of the work are discussed below.
To propose a new probabilistic model for scheduled maintenance
As reviewed in section 1.2, existing scheduled maintenance models based on state
diagrams do not provide accurate results for non periodic inspections, when they are solved
using Markov techniques [29]. Although accurate results can be obtained using Monte Carlo
simulation, it consumes more time and requires more computational power to run the
simulation until convergence. Therefore one of the objectives of this thesis is to develop
analytically solvable, more accurate scheduled maintenance models.