A site specific design of a fixed pitch fixed speed wind turbine blade with multiple airfoils as design variable
Bạn đang xem bản rút gọn của tài liệu. Xem và tải ngay bản đầy đủ của tài liệu tại đây (256.44 KB, 12 trang )
INTERNATIONAL JOURNAL OF
ENERGY AND ENVIRONMENT
Volume 6, Issue 3, 2015 pp.287-298
Journal homepage: www.IJEE.IEEFoundation.org
ISSN 2076-2895 (Print), ISSN 2076-2909 (Online) ©2015 International Energy & Environment Foundation. All rights reserved.
A site-specific design of a fixed-pitch fixed-speed wind
turbine blade with multiple airfoils as design variable
Arturo Del Valle-Carrasco
1
, Delia J. Valles-Rosales
1
, Luis C. Mendez
2
, Alejandro
Alvarado-Iniesta
2
1
New Mexico State University, Department of Industrial Engineering, MSC 4230/ECIII, PO Box 30001,
Las Cruces NM, 88003-8001, USA.
2
Autonomous University of Ciudad Juarez, Department of Industrial Engineering and Manufacturing
Av. Del Charro, 450 Nte, Ciudad Juarez, Chihuahua, 32315, Mexico.
Abstract
This study seeks to optimize a fixed-pitch fixed speed (FPFS) wind turbine blade’s performance using
the chord, twist and the use of 3 different airfoils with varying relative thickness as design variables for
the maximization of the Annual Energy Production for the wind profile of Roswell NM. A baseline
design of the blade starts with a replica of the Phase VI blade utilized in a NASA-Ames experiment and a
Matlab script utilizes the Blade Element Momentum Theory (BEM) for the aerodynamic analysis. The
SQP method for Local Search are used to exploit the model utilizing the Phase VI design as a starting
point which contains the S809 airfoil with a 0.21 relative thickness for the complete blade. Optimization
results reduced the relative thickness of the airfoils to 0.17 and an increase of 36% in energy production
was observed using this method.
Copyright © 2015 International Energy and Environment Foundation - All rights reserved.
Keywords: BEM; SQP; Optimization; HAWT; Wind energy.
1. Introduction
Global warming along with depletion of fossil fuels have created changes in energy policies in countries
around the globe. Several countries in Western Europe are developing wind energy capacities
aggressively such as Denmark having 30% of its electricity supplied by wind energy, Portugal 18%,
Ireland 16%, Germany 10%, and the US presently consists of only 4.4%. However, the U.S. Department
of Energy [1] stated a goal of reaching a 20% electricity production generated by wind resources by the
year 2030.
There are two main types of wind turbines: the Vertical Axis Wind Turbine (VAWT) and the Horizontal
Axis Wind Turbine (HAWT). Of the two topologies the most popular with manufacturers is the two or
three-bladed HAWT due to its cost effectiveness in reliability, acoustics and efficiency [2]. Some
HAWTs possess a blade pitching mechanism and therefore are known as a variable-pitch turbine,
whereas their counterparts lacking this mechanism are known as fixed-pitch (FP) [3]. An additional
variation is related to the speed at which the rotor spins: the two topologies are the fixed-speed (FS) and
the variable-speed (VS) wind turbines. A variety of wind turbine which does not pitch its blades and has
a fixed speed rotor is known as a fixed-pitch fixed-speed (FPFS) wind turbine. Compared to a FPVS
turbine which use permanent magnet synchronous generators requiring complex electronics for grid
International Journal of Energy and Environment (IJEE), Volume 6, Issue 3, 2015, pp.287-298
ISSN 2076-2895 (Print), ISSN 2076-2909 (Online) ©2015 International Energy & Environment Foundation. All rights reserved.
288
connections, the FPFS have the advantage of being robust, reliable and of lower cost than the variable-
speed [4]. A FPFS will yield a maximum coefficient of power at only one given wind speed unlike a VS
rotor, however research has shown that for high values of the Weibull’s shape parameter of a wind
profile, the FPFS turbines have competitive Annual Energy Production (AEP), to about 88% of its
variable-speed version [5].
Wind turbine design optimization has been an ongoing research in academia and in the industrial practice
during the last couple of decades. Previous optimization efforts have focused in an optimization of the
twist and the chord of a given FPFS wind turbine with the objective to maximize the energy production
[6-8]. Additional efforts have been performed in the area of airfoil optimization to improve the
aerodynamic efficiency of the HAWT’s airfoils for VS rotors [17-19]. For example Fuglsang (2004)
designed the RISO family of airfoils to maximize the coefficient of torque and lift and minimize
roughness [9], other studies modified the leading edge for roughness sensitivity [10, 11].
Some wind turbine airfoils are designed to have a high C
l
/C
d
and at the same time a high C
l
for a given
alpha-design angle of attack [12]. The optimizations of the C
l
/C
d
for a given alpha-design can be useful
for an airfoil that is to be fitted in a VP or a VS turbine, since a control strategy can be implemented
where the pitch or speed of the rotor is modified to maximize the exposure of the airfoil’s optimum
alphas. This is not the case in a FPFS which may not modify either parameter and hence its airfoils will
be exposed at its optimum alpha-design for only one given wind speed, and consequently function at
suboptimum levels for any other wind speed.
The Phase VI wind turbine will be utilized as a starting point design of the optimization process. In 2001,
The U.S. National Renewable Energy Laboratory published experimental data [13] for the Phase VI
wind turbine performed in the NASA-Ames wind tunnel located in Moffet Field, California. The wind
turbine consists of 2-blades with 5.03-meter radius with chord and twist variable along the blade and a 3-
degree pitch. The airfoil is the S809 and it is the same along the blade with a relative thickness of 0.21;
the rotational velocity is 72 RPM [14].
The energy production of the rotor is simulated using BEM theory as in Manwell [15]; BEM Theory is
widely used in the literature and in the industry to simulate the energy production of rotors for the energy
optimization of wind turbines [7, 16-18]. The design proposed consists of a 2-bladed FPFS rotor with 3
different airfoils with variable relative thickness described by four Bezier curves; the chord and the twist
are also modeled using one Bezier curve each. In particular the airfoils will have variable relative
thickness with possible values ranging from 0.16 to 0.40 ratio thickness/chord length (t/c). Since there
are three airfoils, each one of them will be utilized for one third of the total length of the blade and will
be referred as root, mid-section and tip airfoil.
The flow analysis of the airfoils is calculated with Drela’s XFOIL [19] code to find their coefficients of
lift and drag. XFOIL is a method used widely in the literature for the design of low speed airfoils [20-
23]. Since BEM theory requires an extrapolation of the coefficients of lift and drag from -180 to 180
degrees the AERODAS method by Spera [24] was utilized to perform the extrapolation.
It is the aim of this study to investigate the impact of chord, twist with the addition of airfoil design and
their relative thickness in the energy production of a FPFS wind turbine. The article is organized as
follows: Section 2 explains the objective function to be maximized, Section 3 elaborates the design
variables and constraints; Section 4 describes the methodology utilized for maximization of the
objective. Finally, Section 5 and 6 close with results and conclusions of the study.
2. Objective function
The objective function to maximize will be the AEP using the wind profile for the location of Roswell
NM. The data consists of hourly data wind speed obtained from the National Oceanic and Atmospheric
Administration [25] station name Roswell Industrial Air Park, NM US with station ID
GHCND:USW00023009 for the periods of January 1
st
2010 to December 31
st
2010. The data is
characterized with a Weibull probability density function (pdf):
])/(exp[)/()/()(
1 kk
w
cUcUckUf −⋅=
−
(1)
where U represents the speed of the wind and k and c are the shape and scale parameters of the
distribution. After a calculation of the Coefficient of Power (C
p
) curve by BEM theory, the AEP can be
obtained with the formula established by Hau [26]
International Journal of Energy and Environment (IJEE), Volume 6, Issue 3, 2015, pp.287-298
ISSN 2076-2895 (Print), ISSN 2076-2909 (Online) ©2015 International Energy & Environment Foundation. All rights reserved.
289
dUUfUCUAAEP
wp
outcut
incut
)()(8760
3
2
1
××=
∫
−
−
ηρ
(2)
where η is the transmission efficiency of the wind turbine including the mechanical and electrical
efficiency which is considered 85% in this study, ρ is the air density 1.062 kg/m
3
, A=79.485m
2
corresponds to the area spanned by the rotor, the cut-in and cut-out speeds are 5 and 25 m/s.
3. Design variables and constraints
The shape of the blade is determined by the airfoil contour, the chord, and the twist distribution of each
section of the blade. In order to achieve smooth distributions of the chord and the twist, two Bezier
curves are used to describe them; for the airfoil shape four composite Bezier curves will be used to
determine their shape.
The design proposed consists of a 2-bladed FPFS rotor with three different airfoils each described
by four Bezier curves. Since three airfoils are proposed, each will be used for one third of the total length
of the blade. In particular the first airfoil occupies the length from the root at 1.257 to 2.51m; the second
airfoil from a length of 2.51 to 3.77m and the third airfoil from a length of 3.77m to the tip of the blade at
5.03m; they are referred as root, mid, and tip airfoils for simplicity.
3.1 Chord and twist distributions
Bezier curves require four control points each containing two coordinates, in this case the first coordinate
represents the position of the point along the radius and the second represents either the chord or the
twist values. Thus, the points that define the chord’s Bezier are:
),(
ici
cr for 4,3,2,1=i (3)
And the twist’s by
),(
ici
tr for 4,3,2,1=i (4)
The chord is constrained to be a decreasing curve for structural reasons, hence the constraint obtained is:
03.5257.1
4321
=
≤
≤≤=
chchchch
rrrr (5)
075.0
4321
≥≥≥≥≥ cccc (6)
In Eq. (6) a limit in the length of the chord is set at 0.75m, and each subsequent chord coordinate must be
decreasing to achieve a blade that tapers down.
The Phase VI has twist values ranging from 25 to 3 degrees from the root to the tip respectively, in this
study a larger set of values will be allowed for exploration resulting in the constraints
1
257.1
t
r= and 03.5
4
=
t
r (7)
03.5,257.1
32
≤≤
tt
rr (8)
400 ≤≤
i
t for 4,3,2,1=i (9)
An additional constraint is concerned with the distribution of the chord not being larger than the Phase
VI’s as it would be undesirable to create a design that produces more energy at the expense of a wider
blade i.e. more costly; thus the chord distribution of the design will necessarily be constrained to be
‘under’ that of the Phase VI. This results in the constraint:
06.2)()),((), ,,((
03.5
257.1
4411
03.5
257.1
=−≤
∫∫
drchordPhaseVIBezierdrcrcrBezier
cc
(10)
International Journal of Energy and Environment (IJEE), Volume 6, Issue 3, 2015, pp.287-298
ISSN 2076-2895 (Print), ISSN 2076-2909 (Online) ©2015 International Energy & Environment Foundation. All rights reserved.
290
3.2 Airfoils
A variation in several of the dimension in the airfoils will be allowed in the study including relative
thickness. As it was previously established by Grasso [12] a variation in relative thickness is
recommended for the inner part of the blade to be larger than the outer part for structural requirements
since they have a higher priority in the inside of the blade. In this study relative thickness values between
16% to 40% will be explored for the designed airfoil. The structural integrity of the blade is not
considered in the scope of this study
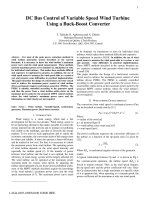
For the parameterization of the airfoils, four composite Bezier curves are used as shown in Figure 1; The
first curve is formed by points 1-4, the second curve by points 4-7, the third by 7-10, and the fourth curve
is composed of points 10, 11, 12, and back to point 1. Points 1, 4, 7, and 10 are shared by adjacent
curves. In addition, Point 1 and Point 7 are always fixed at (1,0) and (0,0) respectively.
0 0.2 0.4 0.6 0.8 1
-0.2
-0.15
-0.1
-0.05
0
0.05
0.1
0.15
x-axis
y-axis
9
11
10
6
8
1
12
4
5
2
3
7
Figure 1. Parametrization of S809 with Beziers
Each x and y-coordinates of control points not fixed have upper and lower bound constraints. Table 1
sets the lower and upper limits for each coordinates of the airfoils’ control points; x-coordinates in point
6 and 8 are fixed at zero to achieve a smooth transition between curves connecting at Point 7; the same
case applies to Points 3 and 5 y-coordinates in which the values are set equal to Point 4, as this yields a
smooth transition between curves connecting at Point 4.
Table 1. Control Points upper and lower bounds
x-Coordinates y-coordinates
Point No. min max min max
Point 2 0.525 0.9 0.04 0.15
Point 3 0.52 0.675 Same as Pt. 4
Point 4 Fixed at 0.4 0.08 0.2
Point 5 0.1075 0.2725 Same as Pt. 4
Point 6 Fixed at 0 0.02 0.10
Point 8 Fixed at 0 -0.10 -0.01
Point 9 0.12 0.3 Same as Pt. 10
Point 10 Fixed at 0.37425 -0.20 -0.08
Point 11 0.475 0.6375 Same as Pt. 10
Point 12 0.65 0.85 -0.10 0.07
The problem yields six variables for the chord, six for the twist, and each airfoil requires the use of
twelve variables for each of the three airfoils i.e. root, midsection and tip areas; a total of 48 variables are
considered in the problem.
International Journal of Energy and Environment (IJEE), Volume 6, Issue 3, 2015, pp.287-298
ISSN 2076-2895 (Print), ISSN 2076-2909 (Online) ©2015 International Energy & Environment Foundation. All rights reserved.
291
Airfoils performance is also affected by Reynolds number (Re) defined as [15]
µ
ρ
/Re cU
rel
= (11)
where c is the chord length of the airfoil, U
REL
is the relative wind velocity to the airfoil, and
µ
is the
viscosity of the airfoil. An estimation of the Reynolds number in the blade’s mid-section of the baseline
Phase VI blade which has a chord length of 0.54m needs to be established in order to set a baseline of
analysis
Considering that the most of the energy gathered from the wind profile in the area of Roswell are at wind
speeds of 10m/s as shown in Figure 2 an analysis of the Reynolds number in the baseline blade will be
made for 5, 7.5 and 10m/s.
In Table 2 the Reynold numbers for the midsection of the preliminary blade as estimated from the given
wind speeds are calculated. This speed calculation is based in the triangle of speeds from Blade Element
Theory. In order to obtain the quantity U
REL
necessary for Eq. (1) the formula
)(
22
TANREL
UUsqrtU += (12)
Is used, in which
rU
TAN
⋅Ω= (13)
Since the rotor speed is constant at 72 RPM the Reynolds number of the HAWT do not vary
significantly, which is in the range of 900,000 to 950,000. To simplify the optimization process the
design Reynolds number is chosen as 925,000. However it must be clarified that this technique would
not be appropriate for other topologies of wind turbines such as variable speed where these values vary
significantly.
0 5 10 15 20 25 30
0
0.05
0.1
0.15
0.2
0.25
0.3
0.35
Wind Speed [m/s]
Probability of WS
Figure 2. Wind pdf of Roswell, NM
Table 2. Estimated Reynolds at wind speeds
)/( smU
)/( smU
TAN
)/( smU
REL
Re
5 23.7 24.2 899,224
7.5 23.7 24.9 922,859
10 23.7 25.7 954,966
4. Methodology
In order to calculate the AEP of a given design a set of scripts were written in MATLAB 2014a. It
consists on a function which receives a candidate design in the form of a vector containing the control
points of the chord, twist, and all airfoils. All lower and upper bounds were mapped to the interval [0, 1]
International Journal of Energy and Environment (IJEE), Volume 6, Issue 3, 2015, pp.287-298
ISSN 2076-2895 (Print), ISSN 2076-2909 (Online) ©2015 International Energy & Environment Foundation. All rights reserved.
292
to add simplicity in the coding process. The script receives the vector of the candidate design and a
Bezier function will generate the curve distributions for the chord, twist and the three airfoils. Using a
DOS shell from Matlab the code executes XFOIL to acquire flow analysis for angles of attack from -8 to
22 at a Re = 925,000 then its results are saved in a text file. A MATLAB script reads the previously
written text files and extracts information required for the extrapolation of the coefficients of lift and drag
from -180 to 180 degrees by utilizing the AERODAS model as designed by Spera [24]. An example of
an extrapolation of the coefficients is shown in Figure 3.
-200 -100 0 100 200
-2
-1.5
-1
-0.5
0
0.5
1
1.5
2
C
L
AERODAS
C
L
XFOIL
C
D
AERODAS
C
D
XFOILl
Figure 3. AERODAS extrapolation
A BEM script is executed and returns a Cp curve for the wind speeds 5m/s to 25m/s; finally the formula
in Eq. (2) is implemented to calculate the final result of the objective function. A diagram is shown on
the process utilized in the calculation of the AEP in Figure 4.
Figure 4. Calculation procedure for the AEP
International Journal of Energy and Environment (IJEE), Volume 6, Issue 3, 2015, pp.287-298
ISSN 2076-2895 (Print), ISSN 2076-2909 (Online) ©2015 International Energy & Environment Foundation. All rights reserved.
293
The SQP algorithm in Matlab with a relative step of 0.15 for the finite difference step was implemented
on the AEP calculation for an optimization of the design. The starting point for the search was the design
of the Phase VI wind turbine blade in which the airfoils are the S809 for all sections of the blade with a
relative thickness of 0.21. The optimization took 18 iterations with a total of 1672 function evaluations.
5. Results
The results of the optimized design increase the AEP by 36%. The initial AEP for the Phase VI blade for
the area of Roswell NM yields a value of 4.4x10⁷ W-h. For the designed blade the total energy
production is of 6.0x10
7
W-h.
The most important constraint is for the chord to not have a larger profile than that of the Phase VI as this
would yield a design with an increased cost. In Figure 5, it is shown that chords for the optimized blade
and the Phase VI are almost identical with the optimized being slightly smaller.
Figure 6 presents also twists for both blades where the optimized has a smaller profile for the twist with
decreasing values of around 18 to a little over 0 degrees in the tip of the blade.
1 2 3 4 5 6
0
0.5
1
Blade Length [mts]
Chord Length [mts]
Optimized Chord
Phase VI Chord
Figure 5. Chords of the optimized and Phase VI
1 2 3 4 5 6
0
10
20
30
Blade Length [mts]
Twist [degrees]
Optimized Twist
Phase VI Twist
Figure 6. Twists of the optimized and Phase VI
0 0.2 0.4 0.6 0.8 1
-0.2
-0.15
-0.1
-0.05
0
0.05
0.1
0.15
x-Coordinate
y-Coordinate
Root Airfoil vs S809
Root Airfoil
S809
0 0.2 0.4 0.6 0.8 1
-0.2
-0.15
-0.1
-0.05
0
0.05
0.1
0.15
x-Coordinate
y-Coordinate
Mid Airfoil vs S809
Mid Airfoil
S809
0 0.2 0.4 0.6 0.8 1
-0.2
-0.15
-0.1
-0.05
0
0.05
0.1
0.15
x-Coordinate
y-Coordinate
Tip Airfoil vs S809
Tip Airfoil
S809
Figure 7. Airfoils for the root, mid-section and tip airfoils compared against the S809
The relative thickness of the three airfoils were identical after the optimization process going from a
value of around 0.21 which corresponds to the S809 to a value of exactly 0.1722 for all of them (Figure
7). This indicates as expected that the optimization will tend to shift to smaller thicknesses for better
aerodynamic properties, however this may compromise the structural integrity of the blade if the lower
bounds of this parameter reaches low levels.
International Journal of Energy and Environment (IJEE), Volume 6, Issue 3, 2015, pp.287-298
ISSN 2076-2895 (Print), ISSN 2076-2909 (Online) ©2015 International Energy & Environment Foundation. All rights reserved.
294
Figure 8 shows the coefficients of lift of the optimized airfoils obtained from XFOIL, with values always
above those of the S809 airfoil (Re=9.25x10
6
), also their alpha value at stall are higher than the S809’s.
The Cp curves of all the designed airfoils for an angle of attack at seven degrees is shown in Figure 9
where they show similar shapes as they share several points in common in account of their identical
relative thickness
-10 0 10 20 30
-1
-0.5
0
0.5
1
1.5
2
Coefficients of Lift of all Airfoils [XFOIL]
Angles of Attack [degrees]
C
L
Root Airfoil
Middle Airfoil
Tip Airfoil
S809 Emp Coeffs
Figure 8. Coefficients of Lift at Re= 925,000 for designed airfoils and S809
0 0.2 0.4 0.6 0.8 1
-3
-2
-1
0
1
Cp Curves at AoA = 7
x-coordinate
Cp
Root Airfoil
Mid Airfoil
Tip Airfoil
Figure 9. Cp Curves at 7 degrees
The ratio Cl /Cd of the designed airfoils have values of 63.7, 67.7, and 69.4 for the root, midsection and
the tip respectively at angles of attack 8, 7, and 7 degrees. Figure 10 shows a plot of the C
l
/C
d
for the
designed airfoils and the S809. The plot indicates that the designed airfoils have a maximum
aerodynamic efficiency lower than that of the S809’s, however they have larger values for a larger range
of the angles of attack. This is a possible indication that airfoils suited for a FPFS should have Cl /Cd
curves which do not necessarily require a high max(Cl /Cd) as illustrated by the S809’s, but instead a
flatter curve with non-steep decrements are of preference. This points to the idea that higher aerodynamic
efficiency are required for a large range of alpha values since the lack of pitching mechanism and rotor
speed variability will expose it to several alphas depending on wind speed changes.
International Journal of Energy and Environment (IJEE), Volume 6, Issue 3, 2015, pp.287-298
ISSN 2076-2895 (Print), ISSN 2076-2909 (Online) ©2015 International Energy & Environment Foundation. All rights reserved.
295
-5 0 5 10 15 20 25
-50
0
50
100
Angle of Incidence [degrees]
C
L
/C
D
Root Airfoil
Mid Airfoil
Tip Airfoil
Figure 10. C
l
/C
d
for the designed airfoils and the S809
A contrast of the energy harvested by each airfoil in the optimized blade is presented in Figure 11
compared against the Phase VI’s energy output. Every airfoil curve for outer sections is higher than the
inner segments as they can capture more energy on account of their radial position. Figure 11 shows the
mid-section of the optimized blade generates almost an identical amount of energy as that of the Phase
VI outer portion of the blade which suggests a good optimization level for the design.
A plot of the energy produced by the entire blade for every wind speed is shown in Figure 12, which
shows that for wind speeds of 11 m/s and lower most of the energy is harvested.
For a better analysis of this information a plot of the angles of attack in every segment of the blade is
shown in Figure 13, which shows that the angles of attack in the airfoils go from around 2 degrees to
around 22. This indicates that instead of a maximization of the C
l
/C
d
of the airfoil for a given alpha-
design, the optimization should be implemented for a range of angles of attack which would likely hit the
blade for the majority wind speeds.
5 10 15
0
2
4
6
8
10
x 10
6
AEP Production
Wind Speed
Root Ph VI
Mid Ph VI
Tip Ph VI
Root Optimized
Mid Optimized
Tip Optimized
Figure 11. Energy yields by the root, mid-section and tip portion of the optimized and the Phase VI blade
depending on wind speeds
International Journal of Energy and Environment (IJEE), Volume 6, Issue 3, 2015, pp.287-298
ISSN 2076-2895 (Print), ISSN 2076-2909 (Online) ©2015 International Energy & Environment Foundation. All rights reserved.
296
5 6 7 8 9 10 11 12
0
0.5
1
1.5
2
x 10
7
AEP produced
Wind Speed
Figure 12 Energy produced by the blade at different wind speeds
For a better analysis of this information a plot of the angles of attack in every segment of the blade is
shown in Figure 13, which shows that the angles of attack in the airfoils go from around 2 degrees to
around 22. This indicates that instead of a maximization of the C
l
/C
d
of the airfoil for a given alpha-
design, the optimization should be implemented for a range of angles of attack which would likely hit the
blade for the majority wind speeds.
Finally, in Figure 14 the C
p
curve generated by the optimized blade is shown against that of the Phase
VI’s. The plot shows the optimized curve is above the baseline design for every wind speed, which
means it will be more efficient for any variation of wind profiles.
0 5 10 15 20 25
0
5
10
15
20
25
30
Angle of Incidence [degrees]
Segment of the blade
5 m/s Ph. VI
7.5 m/s Ph. VI
10 m/s Ph. VI
5 m/s
7.5 m/s
10 m/s
Figure 13. Angle of attacks at 5, 7.5 and 10 m/s at given blade segments
International Journal of Energy and Environment (IJEE), Volume 6, Issue 3, 2015, pp.287-298
ISSN 2076-2895 (Print), ISSN 2076-2909 (Online) ©2015 International Energy & Environment Foundation. All rights reserved.
297
5 10 15 20 25
0
0.1
0.2
0.3
0.4
0.5
Wind Speed
C
P
Coefficient of Power
Simulated Phase VI
Experimental Phase VI
Optimized Blade
Figure 14. Coefficient of Power for Phase VI and the designed blade
6. Conclusions
A FPFS wind turbine was optimized in this study to maximize the Annual Energy Production using the
chord, twist, and three different airfoils with variable relative thickness as design variables which where
modeled utilizing Bezier curves. The wind profile used data obtained from the NOAA for a station
located in the city of Roswell, NM. A baseline design for the optimization of this blade starts with the
Phase VI developed in the NASA-Ames experiment which consists of a variable twist and chord with a
length of 5.03m and containing the S809 airfoil with a 0.21 relative thickness. The simulation of the
energy production of the rotors was conducted by the use of the Blade Element Momentum Theory and
the SQP method was employed to optimize the given design. The results returned three airfoils with
identical relative thickness at 0.17, less than the S809’s; also a smaller twist and chord distributions were
found to be optimal if compared to the Phase VI blade. In total the design blade has an AEP increase of
36%.
The designed airfoils had curves of coefficients of lift above those of the S809 airfoil. Furthermore, the
plot of the C
l
/C
d
indicated that the S809 had a higher max(C
l
/C
d
) for a given alpha than those of the
three designed airfoils. However, the aerodynamic efficiency of the S809 quickly goes below those of the
designed airfoils. This result is congruent with the fact that a FPFS turbine is always exposed to a wide
range of angles of attack as wind speeds change. Taking into account that several airfoils in the past have
been designed by maximizing the C
l
/C
d
as they are fitted for VP or VS systems suggests that a
maximization in the aerodynamic efficiency for one alpha-design is not be the best technique to
implement for a FPFS wind turbine.
Acknowledgement
The authors are grateful to the United States Department of Agriculture (USDA) for their support to this
project via the BuildinG a Regional Energy and Educational Network (BGREEN) grant.
References
[1] R. Wiser, 2012 Wind technologies market report. (2014).
[2] R.W. Thresher, D.M. Dodge, Trends in the evolution of wind turbine generator configurations and
systems. Wind Energy 1 (1998) 70-86.
[3] F.D. Bianchi, H. De Battista, R.J. Mantz, Wind turbine control systems: principles, modelling and
gain scheduling design, Springer, 2006.
International Journal of Energy and Environment (IJEE), Volume 6, Issue 3, 2015, pp.287-298
ISSN 2076-2895 (Print), ISSN 2076-2909 (Online) ©2015 International Energy & Environment Foundation. All rights reserved.
298
[4] D. Saheb-Koussa, M. Haddadi, M. Belhamel, S. Hadji, S. Nouredine, Modeling and simulation of
the fixed-speed WECS (wind energy conversion system): application to the Algerian Sahara area.
Energy 35 (2010) 4116-4125.
[5] G. Venkatesh, S. Kulkarni, Energy yield of passive stall regulated fixed speed wind turbine with
optimal rotor speed. Electric power systems research 76 (2006) 1019-1026.
[6] X. Liu, Y. Chen, Z. Ye, Optimization model for rotor blades of horizontal axis wind turbines.
Frontiers of Mechanical Engineering in China 2 (2007) 483-488.
[7] X. Liu, L. Wang, X. Tang, Optimized linearization of chord and twist angle profiles for fixed-pitch
fixed-speed wind turbine blades. Renewable Energy 57 (2013) 111-119.
[8] E. Minisci, M. Campobasso, M. Dell'Antonio, A. Montecucco, M. Vasile, Multi-disciplinary
robust design of variable speed wind turbines, Conferenza EUROGEN, Settembre, 2011.
[9] P. Fuglsang, C. Bak, M. Gaunaa, I. Antoniou, Design and verification of the Risø-B1 airfoil family
for wind turbines. Journal of solar energy engineering 126 (2004) 1002-1010.
[10] C. Bak, P. Fuglsang, Modification of the NACA 632-415 leading edge for better aerodynamic
performance. Journal of solar energy engineering 124 (2002) 327-334.
[11] W. Timmer, R. Van Rooij, Summary of the Delft University wind turbine dedicated airfoils.
Journal of Solar Energy Engineering 125 (2003) 488-496.
[12] F. Grasso, Development of thick airfoils for wind turbines. Journal of Aircraft 50 (2013) 975-981.
[13] C. Lindenburg, Investigation into rotor blade aerodynamics. Netherlands Society for Energy and
the Environment, Paper ECN-C-03-025 (2003).
[14] M. Hansen, Documentation of code and airfoil data used for the NREL 10-m wind turbine.
ROTABEM-DTU, November (2000).
[15] J. Manwell, J. McGowan, A. Rogers, Wind energy explained: theory, design and application., 2nd
Edition ed., Wiley, New York, NY, USA, 2009.
[16] G.R. Fischer, T. Kipouros, A.M. Savill, Multi-objective optimisation of horizontal axis wind
turbine structure and energy production using aerofoil and blade properties as design variables.
Renewable Energy 62 (2014) 506-515.
[17] R. Lanzafame, M. Messina, Design and performance of a double-pitch wind turbine with non-
twisted blades. Renewable Energy 34 (2009) 1413-1420.
[18] X. Liu, Blade Design Optimisation for Fixed-Pitch Fixed-Speed Wind Turbines. ISRN Renewable
Energy 2012 (2012).
[19] M. Drela, XFOIL: An analysis and design system for low Reynolds number airfoils, Low
Reynolds number aerodynamics, Springer, 1989, pp. 1-12.
[20] B. Bavanish, K. Thyagarajan, Optimization of power coefficient on a horizontal axis wind turbine
using bem theory. Renewable and Sustainable Energy Reviews 26 (2013) 169-182.
[21] T. Kim, S. Lee, H. Kim, S. Lee, Design of low noise airfoil with high aerodynamic performance
for use on small wind turbines. Science in China Series E: Technological Sciences 53 (2010) 75-
79.
[22] X. Li, K. Yang, J. Bai, J. Xu, A method to evaluate the overall performance of the CAS-W1
airfoils for wind turbines. Journal of Renewable and Sustainable Energy 5 (2013) 063118.
[23] N. Mittal, S. Ahmed, N. Tenguria, EVALUATION OF PERFORMANCE OF HORIZONTAL
AXIS WIND TURBINE BLADES BASED ON OPTIMAL ROTOR THEORY. Journal of Urban
and Environmental Engineering 5 (2011) 15-23.
[24] D.A. Spera, Models of lift and drag coefficients of stalled and unstalled airfoils in wind turbines
and wind tunnels. National Aeronautics and Space Administration, NASA/CR-2008-215434
(2008).
[25] National Oceanic and Atmospheric Administration. (2014, January). Retrieved from
[26] E. Hau, Wind turbines: fundamentals, technologies, application, economics, 2006, in: L. Hansen
(Ed.), Springer, 2006.