Structural characterization and biochemical analysis of ID2, an inhibitor of DNA binding 2
Bạn đang xem bản rút gọn của tài liệu. Xem và tải ngay bản đầy đủ của tài liệu tại đây (1.6 MB, 19 trang )
!
17!
the E-proteins, ID1 was shown to positively regulate the cell cycle by inhibition of an
E-protein transcribed gene, the cyclin dependent kinase (CDK) inhibitor, p21.
Downregulation of p21 caused a cascade of signaling events that ultimately led to the
activation of genes required for S phase progression (Prabhu, et al., 1997). In a
different experiment, stable transfection of ID2 in U2OS, a human osteosarcoma cell
line, resulted in an increase of cells in S phase detected by flow cytometry (Iavarone,
et al., 1994).
Constitutively expressed ID genes in immortalized fibroblast cells was shown to
cause cytoskeletal disorganization and loss of adhesion (Deed, et al., 1993). ID
genes had also been shown to immortalize primary mouse fibroblasts when co-
transfected with Bcl2 (Norton, et al., 1998) and in particular, ID1 was able to
immortalize primary human keratinocytes leading to the activation of telomerase and
inhibition of pRb, a known tumour suppressor (Alani, et al., 1999).
Best illustrated in breast cancer, overexpression of ID1 caused mammary
epithelial cells to invade the basement membrane and had been shown to be highly
associated with more aggressive tumours (Desprez, et al., 1998). Constitutive
expression of ID1 in a non-invasive breast cancer cell line produced uncontrolled
growth and increased invasion (Lin, et al., 2000). In addition, ID1 was shown to be
involved in the regulation of steroid-hormone-responsive growth in breast cancer
cells, a loss of which led to uncontrolled growth of breast cancer cells.
1.8 Properties and roles of ID2
!
ID2 was first cloned in 1991 and functioned to inhibit bHLH-domain containing
transcription factors in a similar capacity as the other IDs (Langlands, et al., 1997,
Sun, et al., 1991). Full-length monomeric ID2 has 134 residues and a calculated
molecular weight of 15kDa. The HLH domain of ID2 predicted by Pfam centered
around residues 24-76. Expression of ID2 was prevalent in early development in
!
18!
many different cell types (Biggs, et al., 1992, Sun, et al., 1991) but had been most
studied in the developing muscle and nervous systems (Neuman, et al., 1993, Zhu,
et al., 1995). Recently, it was also found to be the earliest marker of trophectoderm
cell fate in mouse pre-implantation embryos (Guo, et al., 2010).
Besides inhibition of bHLH-containing proteins, ID2, unlike ID1 and ID3 had the
ability to bind a non-HLH tumour suppressor, the retinoblastoma protein (pRb), a
nuclear phosphoprotein that blocked cell cycle progression by complexing with E2F
transcription factors (Sidle, et al., 1996). E2F transcription factors acted to transcribe
genes involved in the G1-S transition as well as the S phase of the cell cycle. pRb
bound E2F proteins to inhibit their function by blocking cell cycle progression.
Sequestering of pRb by ID2 therefore promoted cell cycle progression (Iavarone, et
al., 1994, Lasorella, et al., 1996, Toma, et al., 2000). Introduction of pRb in pRb-null
SAOS2 human osteosarcoma cells showed a reduction in proliferation. When these
cells were co-transfected with both pRb and ID2, the proliferative inhibition was
mitigated by the binding of ID2 HLH to Rb (Iavarone, et al., 1994). Owing to this
property, an increased level of ID2 in some tumour cells was shown to lead to cellular
transformation and tumourigenesis (Gabellini, et al., 2006, Perk, et al., 2005). This
made ID2 a promising therapeutic target for the treatment of some cancers (Fong, et
al., 2004, Gray, et al., 2008). Therefore, biochemical and structural studies would be
useful in understanding ID2’s mechanism of action for developing compounds to
block the ID2-pRb interaction.
Sequence conservation to the other IDs within the HLH domain averaged at 85%
identity whilst at the N and C-termini, the identity dropped to an average of 0-40%
over 70-80 residues. As the HLH domain was found to be key for dimerization (Pesce,
et al., 1993), the high amount of identity suggested that subtle structural differences
between ID2 and other IDs as well as the other bHLHs at the dimer interface could
!
19!
be responsible for these binding preferences. Extrapolating the ID3 homology model
to ID2, it was expected that the predicted homo- and heterodimeric interactions
would be very similar. At a sequence level, the modeled ID3 and ID2 homodimers
shared conserved hydrogen bonds at Y44, L50, Y72, Q77 as well as core
hydrophobic residues M39, L46, L49, M62, I69, I72, L75. At a structural level, the
predicted ID-HLH topology was the same as other bHLH-containing proteins so it
was expected that they would bind to all bHLH-containing proteins of the same
structure.
However, studies showed that ID2 did not form heterodimers with all bHLH-
containing proteins; rather, it selectively interacted with the Group A HLH-containing
proteins E47 and E12 as well as MYOD1 but not the Group B USF1 (Sun, et al.,
1991) nor the bHLH-z structures like MYC and MAX (Figure 4). When ID2 was
cloned, the authors wrote that it did not homodimerize well (Sun, et al., 1991). Others
reported ID2 homodimer to be insoluble and tending to aggregate, especially at high
concentrations (Colombo, et al., 2006). This could be a reason for the sparse
structural information on ID2.
!
20!
1.9 Aim and Scope of Project
!
From previous studies, it was clear that the bHLH-containing proteins played
crucial roles in early development, neurogenesis, myogenesis and cancer. The HLH
domain was found to be well conserved throughout evolution with ID2 having an
ortholog in Drosophila (emc gene). A special class of HLH-containing proteins, the
IDs were especially interesting due to their lack of a basic domain along with their
availability in almost all eukaryotic cells. Members of this family have been known to
regulate other Group A bHLH-containing proteins such as E47 (TCF3) and MyoD
(MYOD1) but very little was known about why they were so specific in their
interactions given the structural similarities to each other and to all the different
groups of HLH-containing proteins. Compounded with this was the fact that IDs were
short-lived proteins, as they functioned to regulate cell fate and were required to
disengage once their roles were complete. This caused problems in studying these
proteins as they tended to be highly unstable.
ID2 was chosen to represent the Group D HLH-containing proteins in order to find
a way in which to stabilize the protein enough for expression and crystallization
without compromising its functionality. An ID2 structure would provide a means to
better understand how this group differed structurally from other HLH-containing
proteins as well as to its paralog ID3. Finally, mutations at key residues based on the
structural analysis of ID would help to explain differences in binding affinities.
Hence, the specific aims of this study were to:
1) Clone, express, purify and crystallize ID2
2) Solve the crystal structure of ID2
3) Analyze the structure of ID2 and look at similarities and differences to other
HLH-containing proteins including ID3
!
21!
4) Determine differences in binding between ID1, ID2 and ID3 to E47, MyoD and
MASH1 through electrophoretic mobility shift assays and mutagenesis experiments
of specific residues based on the structural analysis
!
22!
CHAPTER 2: MATERIALS and METHODS
!
2.1 Cloning
ID2 constructs detailed in Table 2 were cloned from full-length cDNA (a gift from
Scripps) using Gateway (Invitrogen) cloning technology. Inserts were amplified by
PCR using custom attB-containing primers shown in Table 3 and Table 4. PCR
products were recombined with entry vector pDONR221 (Invitrogen) to yield an entry
clone that was transformed into OneShot competent Escherichia coli (DE3) cells
(Invitrogen) and plated on LB agar plates containing 100 µg/ml kanamycin. Single
colonies were used to inoculate 5 ml Luria Broth (LB) containing 50 µg/ml kanamycin
and allowed to grow shaking overnight at 37°C. The overnight culture was
centrifuged at 720 g in an Eppendorf 5804R with A-4-44 swing-bucket rotor and the
pellet used for plasmid isolation using QiaPrep Spin Plasmid Miniprep Kit. The entry
clone was subsequently subcloned via the Gateway LR reaction (Invitrogen)
according to the manufacturer’s protocols into several expression vectors containing
sequences for different affinity and solubility tags namely, pDest-17 (His6), pETG-
20A (His6-TrxA), pDest-565 (His6-GST), pDest-HisMBP (His6-MBP), pETG-60A
(His6-NusA). The expression clones were transformed into BL21 (DE3) Competent E.
coli cells (Invitrogen) and plated on LB agar plates containing 100 µg/ml Ampicillin.
Single colonies were isolated and grown in 5 ml LB + 100 µg/ml Ampicillin and
allowed to grow overnight at 37°C, shaking. The same protocol used to isolate the
entry clones was used for the expression plasmids. Inserts were confirmed by
sequencing (1
st
base, ). In addition, 2 ml glycerol stocks of
the expression clones were stored (1 ml 70% glycerol + 1 ml overnight culture) at -
80°C for future use.
!
23!
Table 2: ID2 constructs and their theoretical biochemical properties estimated by ProtParam
(Wilkins, et al., 1999). Constructs described in detail (yellow highlight)
Construct
cDNA
(bp)
AA
start
AA
end
#AA
pI
MW
(kDa)
Extinction
Coefficient
(M
-1
cm
-1
)
Full Length
402
1
134
134
7.8
14.9
4595
HLH24-82
177
24
82
59
6.1
6.8
4470
N-HLH82
246
1
82
82
8.8
9.3
4470
N-HLH113
339
1
113
113
9.2
12.7
4470
HLH24-82-L
219
24
82
73
6.1
8.3
4470
N-HLH82-L
288
1
82
96
8.8
10.8
4470
Table 3: Primer base for BP cloning (Invitrogen) to create the entry clone for Gateway LR
reaction (Invitrogen). attB sites (italics), sequence transferred into pDonr vector during BP
reaction (bold), protease sites (underlined). Final selected protease is highlighted in yellow.
Primer
Type
Protease
Site
Primer base sequence
Forward
5’
Prescission
GGGGACAAGTTTGTACAAAAAAGCAGGCTTCCTGG
AAGTGCTGTTTCAGGGCCCG
Forward
5’
TEV
GGGGACAAGTTTGTACAAAAAAGCAGGCTTCGAAA
ACCTGTATTTTCAGGGC
Forward
5’
Thrombin
GGGGACAAGTTTGTACAAAAAAGCAGGCTTCCTGG
TGCCGCGTGGCAGC
Reverse
3’
All
ggggaccactttgtacaagaaagctgggttTTA
Table 4: Sequences for each construct were added to the primer base in Table 3 to complete the
primer sequences used for BP cloning.
Construct
Forward 5’
Reverse 3’
Full Length
ATGAAAGCCTTCAGTCCCGT
GAGG
TCAGCCACACAGTGCTTTGC
TGTC
HLH24-82
CGGAGCAAAACCCCTGTGG
ACGAC
ATGCGAGTCCAGGGCGATCT
GCA
N-HLH82
ATGAAAGCCTTCAGTCCCGT
GAGG
ATGCGAGTCCAGGGCGATCT
GCA
N-HLH113
ATGAAAGCCTTCAGTCCCGT
GAGG
ACAGGATGCTGATATCCGTG
TTGAG
HLH24-82-L
CGGAGCAAAACCCCTGTGG
ACGAC
GATGCGAGTCCAGGGCGATC
TGCA
N-HLH82-L
ATGAAAGCCTTCAGTCCCGT
GAGG
GATGCGAGTCCAGGGCGATC
TGCA
!
24!
2.2 Site directed mutagenesis
Site-directed mutagenesis (QuickChange Kit, Stratagene) was performed as per
manufacturer’s instructions. ID2 helix-1 single mutants Y37D, D41G, D41H, K47R
and the double mutant Y37D_D41H were created using specific primers. The same
was done for ID2 helix-2 mutants Y71A, Y71F, Q76A, Q76D and double mutant
Y71A_Q76A. Mutants to interrogate the loop region of ID2 were Q55A, Q55R, K61A,
K61Q and the double mutant Q55A_K61A. The equivalent ID3 loop mutants were
R60A, R60Q, Q66A and Q66K. Primers are listed in Table 5 and were ordered as
HPLC grade to ensure purity for the increased success of the mutagenesis
experiment.
Table 5: Mutagenesis primers. Mutation shown after first underscore and changed residue
denoted by red bold letter. Forward and reverse primers denoted by _F and _R respectively.
Changed nucleotide (s) denoted by grey highlight.
Hydrogen-bond mutants (helix-2)
Residue 66-76
ID2_Y71A_F
ID2_Y71A_R
Q H V I D A I L D L Q
CAG CAC GTC ATC GAC GCC ATC TTG GAC CTG CAG
CTG CAG GTC CAA GAT GGC GTC GAT GAC GTG CTG
Residue 71-81
ID2_Q76A_F
ID2_Q76A_R
Y I L D L A I A L D S
TAC ATC TTG GAC CTG GCG ATC GCC CTG GAC TCG
CGA GTC CAG GGC GAT CGC CAG GTC CAA GAT GTA
Residue 68-79
ID2_Y71A_Q76A_F
ID2_Y71A_Q76A_R
V I D A I L D L A I A L
GTC ATC GAC GCC ATC TTG GAC CTG GCG ATC GCC CTG
CAG GGC GAT CGC CAG GTC CAA GAT GGC GTC GAT GAC
Residue 71-81
ID2_Q76D_F
ID2_Q76D_R
Y I L D L D I A L D S
TAC ATC TTG GAC CTG GAT ATC GCC CTG GAC TCG
CAG CGA GTC CAG GGC GAT ATC CAG GTC CAA GAT
Residue 65-75
ID2_Y71F_F
ID2_Y71F_R
L Q H V I D F I L D L
CTG CAG CAC GTC ATC GAC TTC ATC TTG GAC CTG
CAG GTC CAA GAT GAA GTC GAT GAC GTG CTG CAG
!
!
!
!
!
!
!
!
!
!
!
!
!
!
25!
!
!
Table 5: Mutagenesis primers (continued from above)
N-terminal helix-1 binding specificity mutants
Residue 32-43
ID2_Y37D_F
ID2_Y37D_R
-P M S L L D N M N D C Y-
CCGATGAGCCTGCTAGACAACATGAACGACTGCTAC
GTAGCAGTCGTTCATGTTGTCTAGCAGGCTCATCGG
Residue 35-47
ID2_D41G_F
ID2_D41G_R
-L L Y N M N G C Y S K L K-
CTGCTATACAACATGAACGGCTGCTACTCCAAGCTCAAG
CTTGAGCTTGGAGTAGCAGCCGTTCATGTTGTATAGCAG
Residue 35-47
ID2_D41H_F
ID2_D41H_R
-L L Y N M N H C Y S K L K-
CTGCTATACAACATGAACCACTGCTACTCCAAGCTCAAG
CTTGAGCTTGGAGTAGCAGTGGTTCATGTTGTATAGCAG
Residue 42-52
ID2_K47R_F
ID2_K47R_R
-C Y S K L R E L V P S-
TGCTACTCCAAGCTCAGGGAGCTGGTGCCCAGC
GCTGGGCACCAGCTCCCTGAGCTTGGAGTAGCA
Residue 35-47
ID2_Y37D_D41G_F
ID2_Y37D_D41G_R
-L L D N M N G C Y S K L K-
CTGCTAGACAACATGAACGGCTGCTACTCCAAGCTCAAG
CTTGAGCTTGGAGTAGCAGCCGTTCATGTTGTCTAGCAG
Residue 35-47
ID2_Y37D_D41H_F
ID2_Y37D_D41H_R
-L L D N M N H C Y S K L K-
CTGCTAGACAACATGAACCACTGCTACTCCAAGCTCAAG
CTTGAGCTTGGAGTAGCAGTGGTTCATGTTGTCTAGCAG
ID2 loop region mutants
Residue 50-60
ID2_Q55A_F
ID2_Q55A_R
-V P S I P Q N K K V S-
GTGCCCAGCATCCCCGCGAACAAGAAGGTGAGC
GCTCACCTTCTTGTTCGCGGGGATGCTGGGCAC
Residue 50-60
ID2_Q55R _F
ID2_Q55R _R
-V P S I P Q N K K V S-
GTGCCCAGCATCCCCCGGAACAAGAAGGTGAGC
GCTCACCTTCTTGTTCCGGGGGATGCTGGGCAC
Residue 56-66
ID2_K61A_F
ID2_K61A_R
-N K K V S K M E I L Q-
AACAAGAAGGTGAGCGCGATGGAAATCCTGCAG
CTGCAGGATTTCCATCGCGCTCACCTTCTTGTT
Residue 56-66
ID2_K61Q_F
ID2_K61Q_R
-N K K V S K M E I L Q-
AACAAGAAGGTGAGCCAGATGGAAATCCTGCAG
CTGCAGGATTTCCATCTGGCTCACCTTCTTGTT
Residue 52-64
ID2_Q55A_K61A_F
ID2_Q55A_K61A_R
-S I P Q N K K V S K M E I-
AGCATCCCCGCGAACAAGAAGGTGAGCGCGATGGAAATC
GATTTCCATCGCGCTCACCTTCTTGTTCGCGGGGATGCT
ID3 loop region mutants
Residue 55-65
ID3_R60A_F
ID3_R60A_R
-V P G V P A G T Q L S-
GTACCCGGAGTCCCGGCAGGCACTCAGCTTAGC
GCTAAGCTGAGTGCCTGCCGGGACTCCGGGTAC
Residue 55-65
ID3_R60Q_F
ID3_R60Q_R
-V P G V P Q G T Q L S-
GTACCCGGAGTCCCGCAAGGCACTCAGCTTAGC
GCTAAGCTGAGTGCCTTGCGGGACTCCGGGTAC
Residue 61-71
ID3_Q66A_F
ID3_Q66A_R
-G T Q L S A V E I L Q-
GGCACTCAGCTTAGCGCGGTGGAAATCCTACAG
CTGTAGGATTTCCACCGCGCTAAGCTGAGTGCC
Residue 61-71
ID3_Q66K_F
ID3_Q66K_R
-G T Q L S K V E I L Q-
GGCACTCAGCTTAGCAAGGTGGAAATCCTACAG
CTGTAGGATTTCCACCTTGCTAAGCTGAGTGCC
!
!
26!
2.3 Protein expression optimization
To test for protein expression and solubility of the different expression clones,
factors known to affect protein expression were varied. Experiments were performed
in 5 ml small-scale experiments. Variable factors included media (Luria Broth (LB)
and Terrific Broth (TB)), induction temperatures and times (17°C for 18 hrs, 25°C for
5 hrs, 30°C for 3 hrs), IPTG concentrations (0.2 mM – 1 mM) and solubility tags.
Glycerol stock scrapes were used to inoculate 5 ml LB overnight at 37°C. 2%
overnight inoculums were added to 5 ml fresh LB or TB and grown shaking at 37°C
till an OD
600
of 0.6 was reached. 500 µl samples were taken before induction,
pelleted down for 10 min at 15,700 g in an Eppendorf 5415R mini-centrifuge with
F45-24-11 rotor at 4°C, and stored at -20°C for sodium dodecyl sulphate
polyacrylamide gel electrophoresis (SDS-PAGE). Each tube was then induced with
varying concentrations of Isopropyl-β-D-thio-galactoside (IPTG) and grown at each of
the temperatures mentioned previously. At the end of the induction times, the
cultures were centrifuged at 4,225 g for 10 min at 4°C in a Sorvall SLA-3000 rotor
and the supernatant discarded. Pellets were resuspended in 500 µl lysis buffer (50
mM Tris-HCL pH 8.0, 300 mM NaCl), transferred to a 1.5 ml eppendorf tube and
sonicated on ice for 10s at 35% amplitude (1s on, 1s off). The sonicate was
centrifuged for 10min at 15,700 g in an Eppendorf 5415R mini-centrifuge with F45-
24-11 rotor at 4°C and samples of the supernatant and pellet together with the
uninduced sample were evaluated by SDS-PAGE on 12% SDS-Tris-Glycine gels run
at 200V for 40 min.
2.4 Native protein expression
Glycerol stock scrapes of HLH24-82-L and N-HLH82-L pDest-565/TEV constructs
were grown overnight in 200 ml LB at 37°C. 10 ml overnight inoculums were cultured
in 5L of LB containing 100 µg/ml Ampicillin separated equally into 10 2L flasks in a
!
27!
shaker/incubator at 37°C until an OD
600
of 0.7 was reached. The cultures were
induced with 0.2 mM IPTG and allowed to grow at 17°C for 18 h while shaking.
2.5 Seleno-Methionine (Se-Met) substituted protein expression
HLH24-82-L pDest-565/TEV glycerol stock was plated on Ampicillin selective agar
overnight at 37°C. A single colony was picked and grown in 5 ml LB+100 µg/ml
Ampicillin at 37°C overnight in a shaker incubator. The culture was centrifuged at 720
g in an Eppendorf 5804R with A-4-44 swing-bucket rotor for 5 min. The pellet was
resuspended in 5 ml M9 (12.8 g/L Na
2
HPO
4
-7H
2
O, 3.1 g/L KH
2
PO
4,
0.5 g/L NaCl, 0.5
g/L MgSO
4,
0.1 mM CaCl
2,
5 g/L NH
4
Cl, 20% d-Glucose) minimal media and
centrifuged again at 720 g in an Eppendorf 5804R with A-4-44 swing-bucket rotor for
5 min. The pellet was resuspended in 2 ml M9 media and added to 150 ml M9 media
and allowed to grow overnight at 37°C in a shaker incubator. 5ml of overnight culture
was added to fresh M9 media in a ratio of 1:100 till OD
600
reached 0.6 at 37°C (~6hrs).
Amino acid mix containing 100 mg K, F, and T; 50 mg I, L, and V, and 60 mg Se-Met
per liter was added and mixed for 10 min at 37°C. The culture was induced with
0.4mM IPTG and allowed to grow at 18°C for 18 hours.
2.6 Cell Harvesting
Cells were harvested by ultracentrifugation in Nalgene plastic 50 ml tubes at
11,952 g in a Sorvall SS-34 rotor for 10 min at 4°C. The pellets were resuspended in
cold lysis buffer (50 mM Tris-HCL pH 8.0, 300 mM NaCl, 30 mM Imidazole) and
ultrasonicated for 8 min at 30% amplitude pulsed for 2 s on, 2 s off on ice. The
supernatant was filtered through a 0.22 µm membrane after ultracentrifugation for 2 h
at 36,603 g in a Sorvall SS-34 rotor, 4°C to remove any cell debris in preparation for
purification. Buffer contained 5 mM DTT for Se-Met protein.
!
28!
2.7 Protein Purification
Protein purification was performed on the Akta Express (GE Healthcare) system at
4°C. The first step involved affinity chromatography using nickel beads (5 ml HisTrap
FF columns from GE Healthcare) equilibrated in lysis buffer to capture all His6-
tagged fusion proteins from crude lysate. The peak elutions (buffer: 50 mM Tris-HCL
pH 8.0, 300 mM NaCl, 300 mM Imidazole) were immediately desalted in 50 mM Tris-
HCL pH8.0, 100 mM NaCl buffer using a Hiprep 26/10 desalting column (GE
Healthcare). The protein solution was mixed in a TEV protease to protein ratio of
1:100 at 4°C overnight. 6 ml Resource S (GE Healthcare) ion-exchange
chromatography was performed in an increasing salt gradient up to 1M NaCl on the
cleaved protein mixture to separate the fusion tag from the protein. To remove
residual tag, the eluted protein fractions were pooled and run on a slow gradient
through a 1 ml HisTrap HP (GE Healthcare) and the unbound fractions were
collected, pooled and buffer exchanged (50 mM Tris-HCL pH 8.0, 100 mM NaCl)
while being concentrated using a membrane-based concentrator with a 3000 Da MW
cutoff (Vivaspin, Sartorius). All buffers contained 5mM DTT for the Se-Met protein to
prevent selenium oxidation that could cause problems with detecting a signal for Se
with X-rayed. The Bradford (Quickstart, BioRad) assay was used to quantitate protein
concentration as per manufacturer’s instructions. 20 µl aliquots of HLH24-82-L (11
mg/ml), N-HLH82-L (7 mg/ml) and HLH24-82-L-Se-Met (7.5 mg/ml) at 90% purity and
higher were stored at -80°C.
2.8 Electrophoretic mobility shift assay
Electrophoretic mobility shift assays (EMSA) were performed in triplicate and as
described previously (Hara, et al., 1997) with minor modifications. The EMSAs used
protein from N-HLH82-L construct as this had the highest resolution dataset. Single
stranded forward and reverse 5’-Cy5-labelled probes for e-box-containing
!
29!
(underlined) MCK promoter sequence 5’-GGATCCCCCCAACACCTGCTGCCTGA
and mutant e-box probe 5’-GGATCCCCCCAAACTGGTCTGCCTGA (Sigma, Proligo)
with their exact reverse complements were annealed in a BioRad thermal cycler.
Purified E47 (residues 545-606) was used alone and in combination with ID2-N-HLH
after serial dilution and incubated for 10 min at room temperature in binding buffer
(20 mM Tris-HCL pH 8.0, 50 mM KCl, 1 mM DTT, 1 mM EDTA, 10% glycerol, 0.1 mg
ml
-1
BSA). 2 μM Cy5-labelled probe was added for an additional 15 min at room
temperature to a final reaction volume of 20 μL. Samples were electrophoresed on a
6% Tris-glycine native polyacrylamide gel in 1xTris-glycine (25 mM Tris pH 8.3, 192
mM Glycine) buffer at 4°C for 130 min at 300 V and imaged using a Typhoon
phosphor-imager (Amersham Biosciences).
2.9 Crystallization
Initial screens were done by an automated robot liquid-dispenser (Innovadyne) in
a 96-well format via sitting-drop vapour diffusion by combining 200 nl protein with 200
nl precipitant solution equilibrated over a 50 μl reservoir of precipitant. Screening kits
from Qiagen and Hampton Research were used and the best crystals were found in
Qiagen’s Cation Suite for all constructs after 4-5 days at 18°C. Hits were found in
conditions 4.5M Ammonium Acetate (grid ID: E8) for HLH24-82-L-Se-Met, 0.1 M
MES pH 6.5, 2.0 M Potassium Acetate (grid ID: G8) for N-HLH82-L and 0.1 M MES
pH 6.5, 2.5 M Lithium Acetate (grid ID: C9) for HLH24-82-L. Conditions were
optimized manually by hanging drop vapor diffusion using 1 μl of protein solution
mixed with 1 μl precipitant solution and allowed to grow at room temperature, 18°C
and 4°C. Optimal manual setup temperature was found to be 18°C at the same
conditions as the screens except for the Se-Met protein which could only be
replicated with 3M Ammonium Acetate. Crystals started to form on Day 3 and
maximized growth was usually around Day 7. Crystals were cryo-looped and flash
!
30!
cooled in liquid nitrogen prior to data collection.
Microseeding was required for HLH24-82-L construct. A seed stock was created
by using a drop of crystals crushed in 60 μl of mother liquor and centrifuged for 10
mins at 15,700 g in an Eppendorf 5415R mini-centrifuge with F45-24-11 rotor. Serial
dilutions of 1:10, 1:100, 1:1000, 1:10,000 were prepared from the seed stock.
Hanging drops were setup for each dilution by using 1 μl diluted stock solution, 1 μl
mother liquor and 1 μl protein solution.
2.10 X-ray data collection and processing
Crystals from the optimized manual screens were tested for diffraction on a
PLATINUM 135 CCD detector with focused X-ray source Cu Kα radiation from an X8
PROTEUM rotating-anode generator (Bruker AXS) controlled by PROTEUM2
software (Sheldrick, 2008). Native and MAD datasets were collected at Argonne
National Laboratory synchrotron, GM/CA-CAT, Sector 23, beam line ID-D equipped
with a MAR300 CCD detector for HLH24-82-L and HLH24-82-L-Se-Met crystals
respectively. MAD dataset was collected at Peak (12,658.3 eV), Inflection (12,656.5
eV) and Remote (13,058.3 eV) energies.
Native datasets for crystals of N-HLH82-L were collected at Brookhaven National
Laboratory synchrotron on the X29 beamline equipped with ADSC Q315r detector at
wavelength 1.08090 Å. All datasets were collected under standard cryogenic
conditions (-173°C).
Both native datasets were integrated, indexed, merged and scaled with HKL2000
(Miller-Hance, et al., 1991) software. Although a MAD dataset was collected for
HLH24-82-L-Se-Met, only the Peak energy data was used; indexed and integrated in
MOSFLM (Miller, et al., 1991) and scaled with SCALA (CCP4 suite) (Evans, 2006).
Details of expression and purification protocols for the mutants can be found in
the Appendix.
!
31!
CHAPTER 3: RESULTS and DISCUSSION
(Expression to X-ray Data Collection)
3.1 Cloning and Small-scale Protein Expression
The motivation behind the different ID2 constructs was based on reports that ID2
did not homodimerize well (Sun, et al., 1991) and that the homodimer was known to
be insoluble and to aggregate at high concentrations (Colombo, et al., 2006). Many
published in vitro experiments used ID proteins that retained solubility tags or were
made at low concentrations for biochemical studies. The challenge was to express
enough soluble ID2 that was stable at high concentrations in order to conduct
crystallization trials.
To alleviate the instability issues, constructs (Table 2) were created based on the
published properties of ID2. Combined domain prediction sites pFam (protein family
database) (Finn, et al., 2010) and The Simple Modular Architecture Research Tool
(SMART) (Schultz, et al., 1998) predicted that the HLH region ranged from residues
28-81 (Table 6). Previous experiments found that the HLH domain alone was enough
for dimerization (Ellenberger, et al., 1994, Ma, et al., 1994) but additional residues
surrounding it were required for stability (Liu, et al., 2000). Beyond the HLH region,
the sequence diverged except for small pockets of similarity. An example was the
canonical D-box (destruction box) motif (RxxLxxxN) located C-terminal of the HLH at
residues 100-107 in ID2 and conserved in ID1 and ID4 (Lasorella, et al., 2006). This
motif was shown to be a target for APC (anaphase promoting complex) to bind,
hence signaling the protein for degradation (Lasorella, et al., 2006). In addition,
mutation of the D-box increased the half-life of ID2 10-fold without compromising its
ability to dimerize (Meng, et al., 2009).
!
!
32!
Table 6: Domain prediction results for ID2 from Ensembl release 67
Domain Database
AA Start
AA End
Description
Ascession
Superfamily
38
108
-
SSF47459
Prosite_profiles
8
76
HLH_DNA-bd
PS50888
Smart
28
81
HLH_DNA-bd
SM00353
Pfam
37
76
HLH_DNA-bd
PF00010
To avoid degradation via the D-box and increase stability but include minimally
the HLH and some surrounding residues, a construct was created to start at residue
24 and end at residue 82 (HLH24-82) (Table 2). Additionally, the full-length protein,
as well as a construct including the D-box (N-HLH113) were made based on
Superfamily (Reinke, et al., 1991) domain prediction (Table 6) to see how they
performed in comparison. As expected, results of the small-scale expression studies
showed that the full-length and N-HLH113 constructs either did not produce any
soluble protein or were completely absent even with different solubility tags, induction
temperatures and media (Figure 6).
!
33!
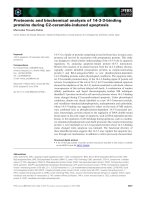
Figure 6: Representative small-scale protein expression tests.
SDS-PAGE on 12% gels: Insoluble (P) and soluble (S) fractions were alternated with 30°C and
17°C induction temperatures. Each gel denotes a different expression vector (labeled at the
bottom of gel). All experiments used LB media and were induced with 0.2 mM IPTG. The order of
the samples was the same for all gels apart from the positions of the marker. Red boxes denote
where expected bands should be.
(A) before induction (lane U), marker (lane M), full-length insoluble (lane P) at 30°C, full-length
soluble (lane S) at 30°C, full-length insoluble (lane P) at 17°C, full-length soluble (lane S) at 17°C,
HLH24-82-L insoluble (lane P) at 30°C, HLH24-82-L soluble (lane S) at 30°C, HLH24-82-L insoluble
(lane P) at 17°C, HLH24-82-L soluble (lane S) at 17°C, N-HLH113 insoluble (lane P) at 30°C, N-
HLH113 soluble (lane S) at 30°C, N-HLH113 insoluble (lane P) at 17°C, N-HLH113 soluble (lane S)
at 17°C. Expressed only in insoluble fraction for His6 tag
(B) Expressed only in insoluble fraction for His6-Trx tag
(C) Expressed only in insoluble fraction for His6-MBP tag
(D) Red arrow shows soluble fraction of ID2 (HLH24-82-L) induced at 17°C for His6-GST tag
(E) No expression with His6-NusA tag
!
34!
However, HLH24-82 inserted in vector pDest-565 (His6-GST) induced at 17°C
showed some expression in the soluble fraction (Figure 6D, red arrow). This was
used for downstream large-scale expression and purification described in the next
section. To confirm that the insert was that of ID2, HLH24-82 (pDest-565) was
analyzed by sequencing (1
st
Base). Sequencing results pointed to an error in the
reverse primer used in the BP cloning step (Table 4, last 2 rows). Instead of a stop
codon after residue 82, an additional nucleotide (Table 4, bold and underlined)
caused a frameshift that introduced a short polypeptide (LKPSFLVQSGDIAS) at the
C-terminus. Therefore, the construct was renamed as HLH24-82-L to denote the
additional C-terminal polypeptide.
To correct the error, new primers (Table 4, rows 2-3) were used to repeat all the
cloning and expression steps for HLH24-82. As before, the pDest-565 construct
produced soluble protein. However, once the tag was removed, the protein
immediately precipitated. Changes to the pH of the buffer, the buffer itself, as well as
the experimental temperature did not improve the insolubility issues. Since previous
reports suggested a need for additional residues to stabilize the HLH domain, a new
construct containing the full N-terminus up to residue 82 was made (N-HLH82).
However, that still did not solve the insolubility issue post tag removal.
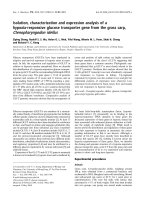
In parallel, the protein containing the C-terminal polypeptide, HLH24-82-L, was
used in large-scale protein expression (Section 3.2) and was successful. The purified
protein showed no signs of aggregation and looked unchanged for a week at room
temperature (Figure 7).
To test if the polypeptide aided in the protein’s stability, the erroneous primer was
used to create N-HLH82-L that used residues 1-82 of ID2 as the base and introduced
the C-terminal polypeptide. Small-scale expression of this protein proved to be
completely stable after solubility tag cleavage so the two constructs containing the C-
!
35!
terminal polypeptide stabilizer were subsequently used for large-scale protein
expression and purification.
Figure 7: Stability of HLH24-82-L containing polypeptide stabilizer over 6 days at room
temperature (25°C). SDS-PAGE 12% gel: marker (lane M), Day 0 (lane 1), Day 1 (lane 2), Day 3
(lane 3), Day 6 (lane 4)
3.2 Protein Expression and Purification
Optimal expression conditions were found using Luria broth induced with 0.2 mM
IPTG for 18 h at 17°C with the expression vector pDest-565 containing an N-terminal
His6-GST-TEV tag that included each of inserts HLH24-82-L and N-HLH82-L.
HLH24-82-L was used in a seleno-methionine replacement experiment for
anomalous dispersion. Typical yields ranged between 1.5 – 2 mg of pure ID2 per litre
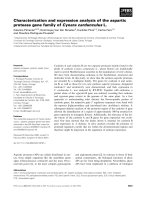
of bacterial culture. The chromatography profiles of all 3 constructs were virtually
identical so a representative set of profiles is shown in Figure 8 (A, C, E). The affinity
chromatography profile utilizing the His6 tag to trap the fusion ID2 protein was
performed and immediately desalted (Figure 8A). All fractions were pooled (Figure 8
B, lane 3; G, lane 2; J, lane 3) and the tag cleaved off with TEV (Figure 8 B, lane 4; G,
lane 3; J, lane 4). The resulting mixture was used as the starting material for ion
exchange chromatography (Figure 8C) to remove the tag from the protein of interest