Manipulation of turbulent flow for drag reduction and heat transfer enhancement 5
Bạn đang xem bản rút gọn của tài liệu. Xem và tải ngay bản đầy đủ của tài liệu tại đây (13.91 MB, 23 trang )
Chapter 5
Heat transfer over protrusions
1
In this chapter, heat transfer characteristics and flow structures over
protrusions in a turbulent channel flow are systematically investigated by
DES numerically. The thermal-hydrodynamic performances are also closely
examined, including Nussselt number, friction and performance factor, and
the effect of changing the height ratio. Additionally, the distribution
of friction factors and Nusselt number are studied with the objective
of providing the connectivity, if any, between them and the flow/vortex
patterns over the protrusion.
5.1 Configuration of protrusions
In this chapter, fluid flows inside a channel with length L, width W and
height 2H in the x, z and y direction, respectively (Figure 5.1). For all the
cases discussed here, only the lower wall consists of protrusions, while the
1
Part of this chapter has been published as Chen et al. (2012b)
186
upper wall is always flat. The protrusion’s print diameter is a constant at
D =5H, and its height h varies from 5%D to 25%D.
X
Y
Z
2H
L
W
D
h
Figure 5.1: Channel with protrusions
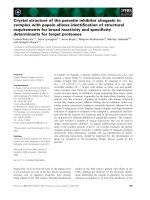
The spherical protrusion with smooth rounded edge (see Figure 5.2)
considered in the present chapter is the inverse of the dimple case from
Chapter 4. The geometry of protrusion can be described by the following
height functions:
⎧
⎪
⎪
⎪
⎪
⎪
⎪
⎪
⎪
⎪
⎪
⎪
⎨
⎪
⎪
⎪
⎪
⎪
⎪
⎪
⎪
⎪
⎪
⎪
⎩
[y
i
(x, z)+R − h]
2
+ x
2
r
= R
2
,x
r
<x
I
[y
i
(x, z) − r]
2
+(x
r
− x
e
)
2
= r
2
,x
I
<x
r
<x
E
y
i
(x, z)=0,x
r
>x
E
.
(5.1)
In Eq. (5.1), x
r
=
(x − x
ci
)
2
+(z − z
ci
)
2
is the horizontal distance
between a protrusion’s surface point to the center axis of protrusion, where
(x
ci
,z
ci
)isthecenterofthei
th
protrusion at the plane of the channel floor.
187
R
D=2X
E
d
2X
I
r
h
Figure 5.2: Sectional drawing of a single protrusion
R, h, d and r are, respectively, the protrusion’s radius of curvature in
inner region, height, nominal diameter and rounded edge’s radius. Other
parameters are given by the following equations:
• Radius of curvature in inner region: R =
h
2
+
d
2
8h
,
• External boundary radius: x
E
=
h (2R +2r − h),
• Print diameter: D =2x
E
,
• Internal region radius: x
I
=
R
R+r
x
E
.
For the cases in which there are N protrusions on the channel floor,
the composite height function is given by the summation of the individual
height functions:
Y = −H +
N
i=1
y
i
(x, z), (5.2)
188
where Y = 0 indicates the center plane of the channel, and Y = −H
indicates the flat portion of the channel floor where the protrusions reside.
The dimpled surface in Chapter 4, which is used to compare with
protrusions, has the same dimension with the protrusions except that the
dimpled portion is below the flat plate instead of above the flat plate for
the protrusion.
5.2 Results and Discussion
In this chapter, eight protrusions are closely placed in a staggered pattern
on the lower wall of the channel to study the interaction between neigh-
boring protrusions, and the upper wall is smooth and flat (see Figure 5.1).
As such, a channel with length L =10
√
3, width W = 10 and half channel
height H = 1 is taken as the main/working computational domain. The
grid resolution of current study is 160 ×128 ×96,sothegridsizeisfairly
similar to that of mesh 3 in Table 2.3 albeit slightly better resolution for
the protrusion features. In this section, heat transfer and flow structure
over protrusions with different height ratios (h/D = 5%, 10%,15%, 20%,
25%) are presented and discussed.
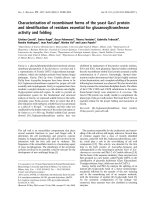
5.2.1 Hydrodynamic and thermal performance
The normalized average friction ratio C
f
/C
f0
, Nusselt number ratio
Nu/Nu
0
and performance factors (Ga/Ga
0
and Gv/Gv
0
) for protrusions
with various height ratios are shown in Figure 5.3 and compared with
189
those obtained for dimpled surface taken from Chapter 4. It is observed
from Figure 5.3(a) that protrusions with larger height ratio (h/D) produce
higher heat transfer rate and friction. It can be also seen that the friction
ratio C
f
/C
f0
increases much more rapidly than the Nusselt number ratio
Nu/Nu
0
does as the height ratio (h/D) increases. As will be shown in the
§5.2.3, the rapid increase of the normalized friction coefficient C
f
/C
f0
is due
to the acceleration of main flow with reduced flow cross-sectional area and
the flow instability induced by vortices. As shown in Figure 5.3(c), with
the increase of height ratio, the performance factors (Ga/Ga
0
and Gv/Gv
0
)
also show an initial increase. However, as a result of the more rapid rise of
the friction factor than Nusselt number, the performance factors very soon
reach their asymptotic limit and even start to decrease at larger height
ratio (h/D).
It can be observed from Figures 5.3(a) and (b) that the trend of
hydrodynamic performance of protrusions bears much similarity to that
of dimpled surface in terms of trend. Still quantitatively, the protrusions
induce much higher friction and heat transfer rate than dimples do at
the corresponding depth/height ratio (h/D). It is also found from Figure
5.3(c) and (d) that the volume goodness factor Gv/Gv
0
for protrusions are
much higher than that of dimples at the same depth/height ratio (h/D).
Additionally, the area goodness factor ratios Ga/Ga
0
for both protrusions
and dimples are similar to each other at the same depth/height ratio (h/D).
Perhaps based on the Ga/Ga
0
criterion, there is the continual rivalry in the
application of dimple or protrusion for enhanced heat transfer. The present
finding suggests that the optimum depth/height ratio (h/D) to achieve the
190
h/D
C
f
/C
f0
,Nu/Nu
0
0 0.05 0.1 0.15 0.2 0.25
0
2
4
6
8
10
C
f
/C
f0
Nu/Nu
0
(a) C
f
/C
f0
and Nu/Nu
0
for protrusions
h/D
C
f
/C
f0
,Nu/Nu
0
0 0.05 0.1 0.15 0.2 0.25
0
2
4
6
8
10
C
f
/C
f0
Nu/Nu
0
(b) C
f
/C
f0
and Nu/Nu
0
for dimples
h/D
Ga/Ga
0
,Gv/Gv
0
0 0.05 0.1 0.15 0.2 0.25
0
0.5
1
1.5
2
2.5
3
Ga/Ga
0
Gv/Gv
0
(c) performance factors for protrusions
h/D
Ga/Ga
0
,Gv/Gv
0
0 0.05 0.1 0.15 0.2 0.25
0
0.5
1
1.5
2
2.5
3
Ga/Ga
0
Gv/Gv
0
(d) performance factors for dimples
Figure 5.3: Effect of h/D on Nusselt number, friction coefficient and
performance factors: h/D stands for height ratio for protrusion, while it
stands for depth ratio for dimple
highest volume goodness factor (Gv/Gv
0
) are around 15%–20% for both
the protrusions and dimples arrangement. Higher volume goodness factor
herein means that implementing protrusions reduces the volume of heat
exchanger, although the area goodness factors are comparable which means
the surface area of the heat exchanger is still similar.
5.2.2 Distribution of local drag and heat transfer rate
The distributions of local average friction factor C
f
(comprising the
components of time averaged skin friction Sm and form drag Fm)and
Nusselt number on protrusions with different height ratios are presented
and discussed in this section.
191
5.2.2.1 Skin friction
The normalized skin friction Sm/Sm
0
distribution on protrusions is pre-
sented in Figure 5.4. It is shown that two local highest skin friction (red
region) are located at the upstream portion of protrusion while the lowest
skin friction (blue region) is found around the downstream centerline of
protrusion. It can be observed that the skin friction on protrusions with
larger height is generally larger than that on protrusions with lower height.
The distribution of skin friction factor significantly depends on the height
ratio of protrusion h/D. In particular, two local highest skin friction
positions are located fairly symmetrically about the streamwise centerline
of protrusion when height ratio is low (h/D ≤ 10%). Conversely for
h/D ≥ 15%, the value of skin friction distributes asymmetrically about
the streamwise of protrusions, especially for the local highest skin friction
at the upstream portion. As such, the local highest skin friction as found
on one side (which can be on the left or right side, depending on the initial
input conditions, see §5.2.2.4) is higher than the other side of upstream
portion of protrusion when h/D ≥ 15%.
5.2.2.2 Form drag
The normalized form drag Fm/Sm
0
distribution on protrusions is pre-
sented in Figure 5.5. It is shown that the single highest form drag (red
region) is located at the upstream portion of protrusion while the lowest
form drag (blue region) is found around the downstream centerline of
protrusion. It can be observed that the form drag on protrusions with larger
192
X
Z
0 5 10 15
0
2
4
6
8
10
Sm/Sm
0
1
0.8
0.6
0.4
0.2
0
(a) 5%
X
Z
0 5 10 15
0
2
4
6
8
10
Sm/Sm
0
2
1.6
1.2
0.8
0.4
0
-0.4
(b) 10%
X
Z
0 5 10 15
0
2
4
6
8
10
Sm/Sm
0
2.8
2
1.2
0.4
-0.4
(c) 15%
X
Z
0 5 10 15
0
2
4
6
8
10
Sm/Sm
0
3
2.2
1.4
0.6
-0.2
-1
(d) 20%
X
Z
0 5 10 15
0
2
4
6
8
10
Sm/Sm
0
4.4
3.6
2.8
2
1.2
0.4
-0.4
-1.2
-2
(e) 25%
Figure 5.4: Normalized friction Sm/Sm
0
at different height ratios h/D
193
height is generally higher than that on the protrusions with lower height.
It can be also found that the form drag distributes fairly symmetrically
about the streamwise centerline of protrusion when height ratio is low
(h/D ≤ 10%). Conversely for h/D ≥ 15%, the form drag distributes
asymmetrically about the streamwise centerline of protrusions. However,
the asymmetry of form drag distribution is less obvious than that for
friction drag. Being so, the highest form drag is found at a position slightly
offset from the upstream centerline of protrusions (arbitrary offset, either
on the left or right side, see §5.2.2.4).
5.2.2.3 Nusselt number
To further investigate the influence of protrusions on the heat transfer, the
normalized Nusselt number distribution on protrusions is presented in Fig-
ure 5.6. It is shown that the highest Nusselt number (red region) is located
at the upstream portion of protrusion while the lowest Nusselt number
(blue region) is found around the downstream centerline of protrusion. It
can be observed that the Nusselt number for the protrusions with larger
height is generally higher than that on the counterpart with lower height.
It can be also found that Nusselt number distributes fairly symmetrically
about the streamwise centerline of protrusion when the height ratio is low
(h/D ≤ 10%), and there exists two local highest Nusselt number located
on the two sides of centerline of protrusions. Otherwise (h/D ≥ 15%), the
Nusselt number distributes asymmetrically about the streamwise centerline
of protrusions. Being so, the highest Nusselt number is found on one single
side (either on the left or right side, see §5.2.2.4) of upstream portion of
194
X
Z
0 5 10 15
0
2
4
6
8
10
Fm/Sm
0
2.8
2.2
1.6
1
0.4
-0.2
-0.8
-1.4
(a) 5%
X
Z
0 5 10 15
0
2
4
6
8
10
Fm/Sm
0
11
9
7
5
3
1
-1
-3
(b) 10%
X
Z
0 5 10 15
0
2
4
6
8
10
Fm/Sm
0
27
23
19
15
11
7
3
-1
-5
-9
(c) 15%
X
Z
0 5 10 15
0
2
4
6
8
10
Fm/Sm
0
50
40
30
20
10
0
-10
(d) 20%
X
Z
0 5 10 15
0
2
4
6
8
10
Fm/Sm
0
85
70
55
40
25
10
-5
-20
(e) 25%
Figure 5.5: Normalized friction Fm/Sm
0
at different height ratios h/D
195
the protrusion. In addition, the location of the highest Nusselt number
generally coincides with the location of both the highest skin friction and
form drag.
X
Z
0 5 10 15
0
2
4
6
8
10
Nu/Nu
0
2.
2
2
1.
8
1.
6
1.
4
1.
2
1
0.
8
(a) 5%
X
Z
0 5 10 15
0
2
4
6
8
10
Nu/Nu
0
4.
6
4.
2
3.
8
3.
4
3
2.
6
2.
2
1.
8
1.
4
1
(b) 10%
X
Z
0 5 10 15
0
2
4
6
8
10
Nu/Nu
0
7.
5
7
6.
5
6
5.
5
5
4.
5
4
3.
5
3
2.
5
2
1.
5
(c) 15%
X
Z
0 5 10 15
0
2
4
6
8
10
Nu/Nu
0
10
9.
2
8.
4
7.
6
6.
8
6
5.
2
4.
4
3.
6
2.
8
2
1.
2
(d) 20%
X
Z
0 5 10 15
0
2
4
6
8
10
Nu/Nu
0
1
1
1
0
9
8
7
6
5
4
3
2
(e) 25%
Figure 5.6: Normalized Nusselt number Nu/Nu
0
at different height ratios
h/D
196
5.2.2.4 Effect of initial conditions for protrusions with h/D =
20%
It is noticed that the highest skin friction, form drag and Nusselt number
are located on one side of protrusions if the height is sufficiently large
(h/D ≥ 15%), hence leading to asymmetric distribution. To further
verify this finding and to ascertain what affects the location of the highest
hydrodynamic and thermal factors, more computational runs were carried
out for the flow and heat transfer over protrusion at h/D = 20% with
different initial conditions imposed. The results obtained are shown in
Figure 5.7.
The initial condition is set as follows:
⎧
⎪
⎪
⎪
⎪
⎪
⎪
⎨
⎪
⎪
⎪
⎪
⎪
⎪
⎩
u = u
pre
[1 + εN(0, 1)]
v = εN(0, 1)
w = εN(0, 1)
(5.3)
where ε 1andN (0, 1) is the standard normal distribution. u
pre
is the
predicted velocity based on the velocity distribution of turbulent flow over
flat channel:
u
pre
=
⎧
⎪
⎪
⎨
⎪
⎪
⎩
y
+
0 <y
+
<y
+
critic
1
κ
lny
+
+ C, κ =0.4andC =5.5 y
+
>y
+
critic
. (5.4)
where y
+
critic
is the height of buffer layer about 15, and a smoothing
technology is implemented in this transition region between the viscous
sub-layer the log-law region.
197
So the random perturbation component εN(0, 1) determines the
initial condition, which does affect the final result. It is found that the local
highest skin friction, form drag and Nusselt number may be found at either
side of protrusions subject to the initial conditions. The distributions of
hydrodynamic and thermal factors for the original run (shown in earlier
sections) and the subsequent run are generally opposite. Additionally,
extra runs caried out which are not shown here indicate that the highest
localized factors are found at arbitrary side of centerline; these locations are
essentially mirror images of each other on the respective side. These imply
that the asymmetrical location of the highest Nusselt number generally
only depends on the initial condition because all the other parameters are
kept the same for these runs.
What we have observed can be broadly classified as bifurcation phe-
nomenon, which is inactive or insignificant when protrusion is low and
becomes active or important when the protrusion is high. Furthermore,
the locations of the highest skin friction, form drag and Nusselt number
are found on the same side of the protrusions, thus implying the strong
connectivity between them. To understand better the possible mechanisms
for such asymmetric distribution of hydrodynamic and thermal factors, the
various quantities on streamlines, vortex structures and velocity contours
are studied and discussed in the next section.
198
X
Z
0 5 10 15
0
2
4
6
8
10
Sm/Sm
0
3
2.2
1.4
0.6
-0.2
-1
(a) Sm/Sm
0
for original run
X
Z
0 5 10 15
0
2
4
6
8
10
Sm/Sm
0
3
2.2
1.4
0.6
-0.2
-1
(b) Sm/Sm
0
for additional run
X
Z
0 5 10 15
0
2
4
6
8
10
Fm/Sm
0
50
40
30
20
10
0
-10
(c) F m/F m
0
for original run
X
Z
0 5 10 15
0
2
4
6
8
10
Fm/Sm
0
50
40
30
20
10
0
-10
(d) F m/F m
0
for additional run
X
Z
0 5 10 15
0
2
4
6
8
10
Nu/Nu
0
10
9.
2
8.
4
7.
6
6.
8
6
5.
2
4.
4
3.
6
2.
8
2
1.
2
(e) Nu/Nu
0
for original run
X
Z
0 5 10 15
0
2
4
6
8
10
Nu/Nu
0
10
9.
2
8.
4
7.
6
6.
8
6
5.
2
4.
4
3.
6
2.
8
2
1.
2
(f) Nu/Nu
0
for additional run
Figure 5.7: Normalized skin friction Sm/Sm
0
,formdragFm/Fm
0
and
Nusselt number Nu/Nu
0
at h/D = 20%
199
5.2.3 Flow structure
In order to explore the underlying mechanisms for the asymmetric distri-
bution of hydrodynamic and thermal factors over protrusions with large
height ratio, the associated flow structures are studied in some greater
details. For simplicity but without loss of generality, only the cases with
height ratio h/D = 10% and 20% are compared and shown.
5.2.3.1 Mean flow field
In this section, the mean flow field (streamlines) based on time averaged
velocity field are investigated. The streamlines in the vicinity of the
protrusions (y
+
=1.5) for the cases with height ratio h/D = 10% and
20% are compared in Figure 5.8. The fluid bifurcates at the upstream edge
of protrusions, and then flows through the valleys between protrusions.
Thereafter, fluid starts to recirculate, forming vortex structure behind
protrusions. However, these vortex features are symmetric when the height
ratio is low, but asymmetric when the height ratio is large. The asymmetric
flow and vortex pattern in deep dimples, which was also observed by Kornev
et al. (2010), was believed to enhance heat transfer more than symmetric
flow in shallow dimple. This may be a cause of higher heat transfer rate
on higher protrusions other than blockage effects as introduced by Hwang
et al. (2008).
According to the Taylor’s hypothesis, the evolution of flow pattern
along the mean flow direction can present the temporal evolution of fluid
flow. In order to examine what happens to the vortical flow over the
200
X
Z
0 5 10 15
0
2
4
6
8
10
(a) h/D = 10%
X
Z
0 5 10 15
0
2
4
6
8
10
(b) h/D = 20%
Figure 5.8: Streamlines on y
+
=1.5 at different height ratios h/D
protrusions, 3-dimensional streamlines are shown in Figure 5.9. For a
clearer presentation of the 3D streamlines, the streamlines are colored by
vertical position Y . In order to show the whole evolution cycle of fluid
flow over protrusions, Figures 5.9(a) and (b) depict the behavior of the
fluid before these vortices are generated; on the other hand, Figures 5.9(c)
and (d) show the behaviors of fluid after these vortices are generated.
Specifically, Figures 5.9(a) and (b) are streamlines traced backwards from
the series of markers between the last two row protrusions; on the other
hand, Figures 5.9(c) and (d) are streamlines traced forwards from the series
of markers between the first two row of protrusions. Similar to planar 2D
streamlines above, it is also found in Figure 5.9 that the fluid bifurcates
at the upstream edge of protrusions, and then recirculates and is lifted
up, hence forming the vortex structure. However, the patterns of the
streamlines differ for protrusions with different height ratios both before
and after the vortices are generated.
Before the vortices are generated, the fluid sweeps down to the valley
between the neighboring protrusions from the center plane of channel (Y =
0). The number of the coming flow groups before vortices are generated over
201
the low protrusions is four, but the counterpart over the high protrusions
is two. This may be due to the symmetric and asymmetric flows over the
low and high protrusions: for symmetric flow pattern over low protrusions,
two groups of flow can merge into one flow group inside the valley between
protrusions; for asymmetric/inclined flow, only one group of incoming flow
can enter the valley between protrusions. However, the angle of sweep of
the flow over protrusions with larger height ratio is much larger than that
over the low protrusions, hence resulting in a stronger mixing between the
fluid in the center region and near-wall region. This partially explains the
higher Nusselt number observed for the higher protrusions.
After the vortices are generated: (i) for low protrusions (h/D =
10%), the vortices are relatively less intense and symmetric, so they are
transported through the valley of next row of protrusions; (ii) for high
protrusions (h/D = 20%), the vortices are more intense and asymmetric,
so they flow directly downstream and then impinge on one side of the next
row of protrusions. As a result of the different behavior of vortices above
the protrusions at different height ratios, the Nusselt number distribution
is symmetric for low protrusion geometry (h/D = 10%) while asymmetric
for high protrusion geometry(h/D = 20%). Furthermore, the positions of
the highest Nusselt number for the high protrusion (h/D = 20%) coincide
with the impingement between vortex and protrusion wall. There is more
intense mixing between the center region of channel and near-wall region,
and stronger vortices which impinge the downstream protrusions have led
to higher Nusselt number for protrusions with larger height ratio.
It is also worthwhile to further investigate the impingement and recir-
202
X
Y
Z
Y: -1 - 0.9 -0.8 -0.7 -0.6 -0.5 -0.4 -0.3 -0.2 -0.1 0 0.1 0.2 0.3 0.4 0.5
1
2
3
4
(a) before vortex generation at h/D =
10%
X
Y
Z
Y: -1 -0.9 -0.8 -0.7 -0.6 -0.5 -0.4 -0.3 -0.2 -0.1 0 0.1 0.2 0.3 0.4 0.5
1
2
(b) before vortex generation at h/D =
20%
X
Y
Z
Y: -1 -0.9 -0.8 -0.7 -0.6 -0.5 -0.4 -0.3 -0.2 -0.1 0 0.1 0.2 0.3 0.4 0.5
(c) after vortex generation at h/D = 10%
X
Y
Z
Y: -1 -0.9 -0.8 -0.7 -0.6 -0.5 -0.4 -0.3 -0.2 -0.1 0 0.1 0.2 0.3 0.4 0.5
(d) after vortex generation at h/D = 20%
Figure 5.9: 3-D streamlines at different height ratios h/D, the dashed line
refers to the streamline tracing markers, the fluid flows from left bottom
corner to right top corner
culation regions, respectively, in the upstream and downstream portions of
protrusions. For simplicity but without loss of generality, only streamlines
for the cases with height ratio h/D = 10% and 20% are compared in Figure
5.10. It is found that there is recirculation behind the protrusion around
the centerline (Z = 5). It can also be observed that the recirculation for
higher protrusion (h/D = 20%) is stronger than that for lower protrusion
(h/D = 10%). On the upstream portion of protrusion, the streamlines
follows the surface profile of the protrusion on the wind-ward side and over
the top and then join the freestream. In addition, the higher protrusion
tends to trigger more intense mixing between the center region of channel
and near-wall region than the lower protrusion does. In general, the intense
203
mixing flow and recirculation, respectively, on upstream and downstream
portions of protrusion can explain the highest Nusselt number located at
the upstream portion of protrusion and the lowest Nusselt number located
at the downstream portion of protrusion.
X
Y
681012
-2
-1
0
1
2
(a) Z=5 for h/D = 10%
X
Y
681012
-2
-1
0
1
2
(b) Z=5 for h/D = 20%
Figure 5.10: Streamlines on X-Y planes for different height ratios h/D
5.2.3.2 Mean velocity contours
The asymmetric distribution of Nusselt number for protrusion with height
ratio h/D = 20%, however, cannot be easily revealed by the pattern of
streamlines alone. Thus, it behooves us to explore and further examine the
time averaged velocity in the vicinity of protrusion (y
+
= 8) which is shown
in Figure 5.11. It can be found that the values of both streamwise and
vertical velocity (U and V) are symmetric about the centerline of protrusion
when height ratio is low (h/D = 10%). Conversely, both U and V are
located asymmetrically about the centerline for protrusion with large height
ratio (h/D = 20%). In particular, there are two local highest values of U
for h/D = 20%, of which one is located a little offset from the centerline
and another is located in the valley between two neighboring protrusions.
Additionally, there is one single highest value of V for h/D = 20% located
204
a little offset from the centerline. The location of highest values of U and
V which is a little offset from centerline coincides with the highest Nusselt
number. This is because large magnitude of convection velocity contributes
significantly to heat transfer from the wall to the fluid downstream.
X
Z
051015
0
2
4
6
8
10
u
9
8
7
6
5
4
3
2
1
0
-1
(a) U for h/D = 10%
X
Z
051015
0
2
4
6
8
10
u
4.5
3.5
2.5
1.5
0.5
-0.5
-1.5
(b) U for h/D = 20%
X
Z
051015
0
2
4
6
8
10
v
2.6
2.2
1.8
1.4
1
0.6
0.2
-0.2
(c) V for h/D = 10%
X
Z
051015
0
2
4
6
8
10
v
2.6
2.2
1.8
1.4
1
0.6
0.2
-0.2
(d) V for h/D = 20%
Figure 5.11: Velocity contours in vicinity of protrusion (y
+
=8)with
different height ratios
5.2.3.3 Mean vortical flow structures
In this section, the time averaged vorticity field of flow over the protrusion
with different height ratios are presented and examined to reveal the
mechanism leading to the distribution of skin friction, form drag and
Nusselt number as shown in the above sections.
Firstly, the streamwise vorticity (ω
x
) and streamlines over protrusions
are investigated by showing them on the different vertical Z-Y plane slices
205
(these positions are given in Figure 5.12). According to the Taylor’s
hypothesis, the evolution of flow pattern through these slices represents the
temporal evolution of fluid flow over the protrusions. This is approximately
true here since unlike flat plate, the flow is modified by the geometry of
the protrusions. The fluid flows through the planes 1, 2, 3, 4, 5, 6, 7 and
consequently moves over the second row of protrusions. In doing so, the
vorticity and streamlines on these slices can show the evolution of vortex
over the protrusions.
X
Z
0 5 10 15
0
1.25
2.5
3.75
5
6.25
7.5
8.75
10
11.25
1234567
I
II
I
II
II
Figure 5.12: Slices position over protrusions
Before examining the vorticity and streamlines on each Z-Y plane, it
is thought expedient to introduce and demarcate the different zones of the
Z-Y plane, which are given as follows:
1. Zone I with 1.25 ≤ Z ≤ 3.75 and 6.25 ≤ Z ≤ 8.75.
2. Zone II with 0 ≤ Z ≤ 1.25, 3.75 ≤ Z ≤ 6.25 and 8.75 ≤ Z ≤ 10
206
It shall be noted that Z=0 and 10 are actually the same position for
the periodic boundary condition employed in this study. As the fluid passes
through planes 1 to 7 consecutively in zone I, broadly it originates from the
tail region of the valley between the first row of protrusions and arrives at
the front ridge of the second row of protrusion, then consequently flows over
the forward-facing ridge and the backward-facing ridge of the second row
of protrusions, and finally enters the valley of the third row of protrusions.
When the fluid passes through planes 1 to 7 consecutively in zone II, it
firstly flows over backward-facing ridge of the first row of protrusions,
then flows through the valley between the second row of protrusions, and
finally arrives at the upstream or forward-facing ridge of the third row of
protrusion. In general, zone I covers the forward-facing and backward-
facing ridge of the protrusion, while zone II covers the valley between two
side-by-side protrusions in the spanwise direction. The behavior of fluid
respectively in these two zones integrate the whole cycle of fluid flow over
the “ridge” and “valley”.
The streamwise vorticity (ω
x
) and streamlines on different Z-Y plane
slices at h/D = 10% are shown in Figure 5.13(a). On each plane, there
are generally four pairs of contra-rotating vortices: two pairs located in
thezoneI(1.25 ≤ Z ≤ 3.75 and 6.25 ≤ Z ≤ 8.75) are characterized as
group I; the other two pairs of vortices found in the zone II (0 ≤ Z ≤ 1.25,
3.75 ≤ Z ≤ 6.25 and 8.75 ≤ Z ≤ 10) are characterized as group II.
In the zone I, the group I contra-rotating vortices which come from the
upstream valley become weaker and weaker as they pass through the planes
1–2. Thereafter, the fluid arrives at the front ridge of the second row of
207
protrusions and is lifted up and forms a new pair of contra-rotating vortices
(planes 3–5). Then the fluid flows around the top and backward-facing ridge
of the second row of protrusion with rotation leading to a new pair of strong
and small vortices very near to the wall (planes 6–7). It can be found that
the new pair of vortices generated at backward-facing ridge coexist with
the contra-rotating vortices transported from the forward-facing ridge on
planes 6–7. In the zone II, the group II contra-rotating vortices, which
come from the top of the first row of protrusion, merge with the small but
strong vortices which are generated over the backward-facing ridge of the
first row of protrusions (planes 1–3). Thereafter, the contra rotating vortex
enter the valley between the protrusions in the second row (planes 3–5).
Finally, the group II vortices become weak at the upstream rim of the third
row of protrusions (planes 5–7).
Examining the combined behavior of the contra-rotating vortices in
the zones I and II, the flow structures of fluid passing through the ”ridge-
valley” topography of interspaced protrusions can be summarized as the
following. Firstly, a new pair of contra-rotating vortices is generated on
the front ridge of protrusions. Then the vortices merge with the small
but strong contra-rotating vortex which are generated over the back ridge
of protrusions. Thereafter, the contra-rotating vortices enter the valley
between the next row of protrusions and become weaker and weaker till
they reach the next “ridge”. Then the flow patterns repeat the “ridge-
valley” cycle. It may be noted that the contra-rotating vortices which are
generated at the back ridge of protrusions are much stronger than those
which are generated at the front ridge of protrusions. The existence of
208