Fluid mixing enhancement through chaotic advection in mini micro channel 2
Bạn đang xem bản rút gọn của tài liệu. Xem và tải ngay bản đầy đủ của tài liệu tại đây (11.09 MB, 25 trang )
Chapter 4 Fabrication and Experimental Testing
— —
64
Chapter 4 Fabrication and Experimental Testing
4.1 Introduction on fabrication of microfluidic devices
The fabrication technique is an important aspect of microfluidics technology. In
some previous studies on microfluidic mixer, they were prototyped using traditional
photolithography method (Liu et al., 2000; Park et al., 2004; Hong et al., 2004; Kim et
al., 2005), which involves mask making, deposition, exposure, chemical etching
processes, etc. Silicon wafer are usually used as the substrate. While this technique
has been developed for many years and is easy to implement, it is time-consuming
and expensive.
In recent years, alternative fabrication methods using polymers such as
polycarbonate (PC), poly(methylmethacrylate) (PMMA), and poly(dimenthylsiloxane)
(PDMS), etc., have been reported (Boone et al., 2002; Kim & Xu, 2003). Polymers
are increasingly used due to their good properties such as biocompatibility, and great
flexibility for fabrication. Compared with silicon wafer, polymer materials are also
cheaper and thus reduce the cost. Relevant fabrication methods include template
imprinting (Martynova et al., 1997; Xu et al., 2000; McDonald et al., 2002), injection
molding (McCormick et al., 1997), laser mask patterning (Roberts et al., 1997;
Zimmer et al., 2000; Wan et al., 2005), and laser direct writing (Lade et al., 1999; Lim
et al., 2003; Hauer et al., 2003). The first three methods need the fabrication of a mask,
template or mold. Comparatively, the laser direct writing method is more flexible.
Lasers have been used for micromachining of various materials including
polymers for many years. The discussions about the laser ablation mechanism and its
Chapter 4 Fabrication and Experimental Testing
— —
65
effects on the material properties can be found elsewhere (Pugmire et al., 2002; Siew
et al., 2005; Moreno et al., 2006). While scanning the laser beams on the substrate
surface with the laser intensity above the ablation threshold fluence, the material can
be removed from the target through photochemical reaction. It may also involve
photothermal effects which directly melt and evaporate the material. This process
usually leaves debris on the surface which affects the quality of the cut. Among the
various laser systems, nanosecond excimer lasers have been widely used for
machining of microstructures below 100
m
µ
. Femtosecond laser involves less
photothermal effects; clean ablation and precision micromachining can be achieved.
CO
2
laser is less costly and suitable for micro-machining of polymeric materials,
especially for PMMA (Klank et al., 2002; Bowden et al., 2003; Jensen et al., 2003). In
contrast to photochemical ablation, CO
2
laser machining mainly involves the
photothermal process.
Many microfluidic components have complex 3D structures. It can be realized
with gray level and contour mask technique (Zimmer et al., 2000), multi-level
photolithography (Anderson et al., 2000), solid-object printing (McDonald et al.,
2002), etc. All these methods involve additional work of fabrication of masks or
templates, and complex processing strategies. An alternative way for 3D fabrication is
to bond the substrates layer by layer. When hard materials such as silicon and glass
are used, adhesion failure or stress failure may occur. Comparatively, binding soft
polymer materials is much easier. The bonding techniques mainly include: (1) Spin-
on glass bonding (SOG) that can be applied for silicon wafers (Alexe et al., 2000); (2)
Laser bonding that is used to bond a transparent acrylic substrate with an opaque one
(Potente et al., 1999); (3) Thermal bonding of polymer substrates in oven or boiling
water (Martynova et al., 1997; Kelly & Woolley, 2003), etc.
Chapter 4 Fabrication and Experimental Testing
— —
66
4.2 Meso-scale mixer devices for preliminary testing
According to the similarity principle in fluid dynamics, the flow characteristics
are only affected by the Reynolds number. If the diffusion process in a chaotic mixer
is so weak that it can be neglected, the flow pattern will remain invariant at the same
Re, despite the dimension of the mixer. Based on this principle, the scaled-up mixer
models were fabricated for preliminary experimental testing. At the same Re, they are
supposed to provide reliable evaluation on the new design. In this study, all the mixer
devices (including the miniature mixers as will be introduced in the following sections)
were fabricated in the Singapore Institute of Manufacturing Technology (SIMTech).
4.2.1 Fabrication processes
Compared with the miniature micromixer, it is easier to make meso-size models.
In this study, they are fabricated with transparent PMMA (polymerthylmethacrylate)
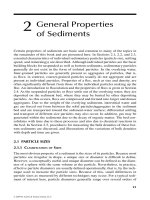
plates. Fig. 4.1 illustrates the fabrication process. A Synrad J48-2w CO
2
laser (Synrad,
Inc.) with a UC-2000 controller is used for cutting. As controlled by a computer, the
desired patterns are transferred into the movements of the laser beam. A laser
galvanometer scanner is used for scanning application. Projecting the laser beam on
the surface of the PMMA plate, the polymer is evaporated and the plate is gradually
cut through to form the channels and the inlet/outlet holes in different layers. Then
the PMMA plates are bonded up layer by layer using acrylic glue to form the
complete mixer. In this way, the channel depth of the mixer is defined by the
thickness of the PMMA plate, which is 1.5 mm in the present study. In simulation, the
channel depth of the mixer is 150
m
µ
. So the fabricated models are scaled up by 10-
times. To reduce the size of the mixer device, the channels are bent into three
segments. As an example, the picture of a TLCCM mixer is given in Fig. 4.2.
Chapter 4 Fabrication and Experimental Testing
— —
67
Fig. 4.1 Fabrication of meso-size mixer models for preliminary experimental testing.
Fig. 4.2 Picture of TLCCM-B made of PMMA.
4.2.2 Experimental mixing results
With the optical method introduced in Section 2.4, the mixing in the channel
can be directly observed and recorded. A highly viscous 98% glycerol-2% liquid food
dye (red and blue) solution was used. At 23
0
C, its kinematic viscosity is about
124
108.6
−−
×≈ sm
ν
. Its diffusivity is estimated according to Nishijima & Oster
(1960),
10
102.0
−
×≈D
12 −
sm . The weak diffusion will provide a stringent testing on
the mixing performance.
Some mixing pictures are shown below. Figures 4.3 (a) and (b), respectively,
demonstrate the mixing in a simple rectangular channel and a 3D serpentine channel
at Re = 1. Apparently in both the models, no mixing is achieved. For the 3D
serpentine channel, it does not exhibit much difference from the planar channel. The
fluid interface remains rather sharp all through the channel which is 15-mixer-unit
length. Since no chaotic advection is produced, the mixing is limited by diffusion.
Chapter 4 Fabrication and Experimental Testing
— —
68
These two pictures clearly suggest the difficulty of fluid mixing in the low-Re laminar
regime.
(a)
(b)
Fig. 4.3 Mixing results at Re = 1 in: (a) a planar rectangular channel, and (b) a
3D serpentine channel.
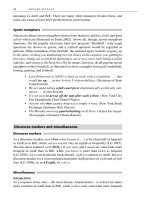
Fig. 4.4 presents the results of TLCCM-A and TLCCM-B at Re=0.01. Due to
the perturbations caused by the channel geometry, the fluids are continuously
subdivided into thinner and thinner stream layers through splitting and recombination
process. The sub-figures show the detailed fluid distribution at different positions
along the mixer. The growth of the number of fluid striations is quite clear. The
ability of the TLCCM mixers to generate chaotic advection at Re of O(10
-2
) indicates
that they do not depend on the fluid inertial effects, and rapid mixing can still be
achieved at extremely low Re. This is a very important feature as in microfluidic
applications, Re is usually small.
Chapter 4 Fabrication and Experimental Testing
— —
69
(a) Mixing in TLCCM-A.
(b) Mixing in TLCCM-B.
Fig. 4.4 Experimental mixing results of the TLCCM mixer at Re=0.01.
Chapter 4 Fabrication and Experimental Testing
— —
70
From the pictures, the thinning rate of the fluid striation thickness
γ
can be
estimated as a mixing index. It is defined as
c
wd=
γ
, where d is the thickness of the
individual fluid striation and
c
w is the channel width. For model A,
γ
decreases from
0.5 near the inlet to about 0.2~0.3 after 2-mixer-unit length, and further drops below
0.1 after 4 mixer units. Compared with model A, model B exhibits faster mixing. As
shown in Fig. 4.4, the number of the fluid striations is nearly doubled after each mixer
unit. In the first cycle, 2 striations are observed (in the lower top-layer channel) in the
figure). Then, it increases to 4, 8 and around 30 in the 2
nd
, 3
rd
and 5
th
mixer unit.
Correspondingly,
γ
decreases from 0.5 to 0.25, 0.13 and reaches around 0.03.
4.3 Miniature PMMA mixer for further confirmation
Though the mixer models of meso-size have exhibited rapid mixing, at micro
scales the effects of surface tension become more intense and this may cause some
difference in the mixing results. So in the next step, smaller mixer models were
fabricated for more convincing evidence.
4.3.1 Direct laser cutting of microchannel
The same CO
2
laser system was applied for fabrication of the miniature mixer
for further confirmation. The microchannel to be machined is in the sub-millimeter
level. To achieve a satisfactory accuracy, the laser ablation process must be
implemented carefully. The wavelength of the CO
2
laser is 10.6
m
µ
. The output
power is controlled through adjusting the pulse width modulation (PWM) duty cycle.
The dimensions of the microchannel are affected by many parameters, such as the
laser fluence, the laser scanning speed, etc. In this study, to simplify the processing
Chapter 4 Fabrication and Experimental Testing
— —
71
procedures, the PWM frequency is set at 5 kHz and the duty cycle is set at 50%. The
microstructure is fabricated by raster scanning of the laser beam. The channel width
can be controlled by the number of overlapping laser beams and the spacing between
them. While the spacing is adjustable, it must be small enough to avoid insufficient
overlapping, which may result in ridges on the bottom surface of the channel. The
channel depth is controlled by the times of laser scan and the scanning speed. With
suitable parameters, desirable microchannels can be achieved. (Some studies on CO
2
laser processing of PMMA material is given in Appendix B.)
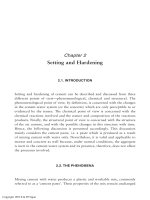
In our study, the microchannels were fabricated using three overlapping laser
beams at a spacing of 75
m
µ
. The number of passes is 2 and the laser scanning speed
is 22 cm/s. The cross-sectional profile of a microchannel engraved with the CO
2
laser
is shown in Fig. 4.5(a). Fig. 4.5(b) shows the top-layer and bottom-layer
microchannels of TLCCM mixer. The channel exhibits a Gaussian-like profile, rather
than a rectangle as in the original design. Slight rims are also observed at the edges of
the channels. These are common in CO
2
laser micromachining. It suggests that
striking thermal effects occurred in the process, which has caused melting and re-
solidification of the polymer material (Klank et al., 2002). These findings suggest that
the current CO
2
laser has limitations for precision fabrication. However, compared
with the feature size of the microchannel which is 500~600 microns, the deformation
of the channel geometry is acceptable. The following functional testing would also
confirm that the deformation does not affect the mixing performance of the design.
Chapter 4 Fabrication and Experimental Testing
— —
72
(a)
(b.1) TLCCM-A.
(b.2) TLCCM-B.
Fig. 4.5 Microchannels fabricated using CO
2
laser. (a) Cross-sectional profile of a
microchannel. (b.1) and (b.2) show the top-layer and base-layer structure of the
TLCCM mixer.
4.3.2 Thermal bonding of PMMA substrates
4.3.2.1 Solvent-assisted thermal bonding
After the channels were fabricated layer by layer, the substrates need to be
bonded together to form the whole mixer. As mentioned in the introduction, for
polymer materials such as PMMA and PC, this can be realized using thermal bonding
technique. During the process, two substrates are placed in contact and a certain
pressure is applied. They are then heated to a temperature near their glass transition
temperature Tg. This will cause the polymer chain near the interface to inter-diffuse
and the substrates will get bonded. To date, there have been many relevant reports.
Chapter 4 Fabrication and Experimental Testing
— —
73
Kelly & Woolley (2003) introduced a fast, low cost method for thermal bonding of
PMMA substrates. In their study, a blank piece of polymer substrate was clamped
with another one with imprinted microchannels, and then immersed in boiling water
for about 1 hour. Good bonding was achieved. Sun et al. (2006) reported a low-
pressure, high-temperature thermal bonding process. A high bonding strength and
good structural integrities can be achieved. In some other studies, suitable solvents
including acetone (Liu et al., 2004), DMSO-methanol solution (Brown et al., 2006)
and epoxy resin were used for surface treatment. The solvent will slightly solubilize
the surface of the polymeric material and facilitate the inter-diffusion.
In the current work, the debris and the rims on the channel edges induced by the
laser machining have raised the difficulty for direct thermal bonding. It requires a
higher pressure and this would cause large deformation of the microstructure. To
maintain the integrity of the microchannel, we adopted a solvent-assisted thermal
bonding method. The applied solvent is an acrylic glue-alcohol solution. The glue is
commercially available (Dama, Singapore) and its composition is as follows: aromatic
hydrocarbon 70%; fatty acid, 10%; diethanolamine salt, 10%; hexylene glycol, 5%
and stabilizer triethanolamine, 5%. This glue cannot be directly used because its
viscosity is too high and it may fill up the channel and cause blockage. Usually the
viscosity of the adhesive material for micro-fabrication must be very low (less than
200 cps according to Kim & Xu (2003)). For pre-bonding, the acrylic glue is first
diluted with alcohol at a best glue-alcohol volume ratio around 3:5. After getting the
two PMMA substrates aligned with the surfaces in contact, the gap between the
substrates can be filled up with a very thin layer of the solution through capillary
effects. The diluted acrylic glue will slightly dissolve the PMMA surface, and keep
the integrity of the microstructures. After several minutes, the substrates will be pre-
Chapter 4 Fabrication and Experimental Testing
— —
74
bonded. Next, the substrates are sandwiched with two pieces of glass microscope
slices and clamped with common binder clips. By immersing the assembly in the
boiling DI water for around 1 hour, the PMMA substrates can be well bonded.
According to our testing, during the pre-bonding and thermal bonding processes,
nearly no air bubbles are trapped in the gap between the polymer substrates, and the
transparency remains good. This will facilitate direct observation of the mixing. Fig.
4.6 shows the photographs of the microchannel structure after bonding, and the
miniature TLCCM mixer.
First half cycle Top-layer channel
Second half cycle Bottom-layer channel
TLCCM-A TLCCM-B
(a) (b)
Fig. 4.6 Photographs of the PMMA micromixers TLCCM-A and TLCCM-B; and the
microstructures of the two-layer flow channels after thermal bonding.
Chapter 4 Fabrication and Experimental Testing
— —
75
4.3.2.2 Bonding quality test
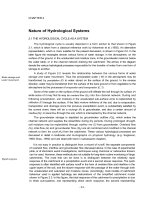
In order to check the performance of the current bonding method, the bonding
strength was tested with the Instron Microtester (Instron Corp., USA). The samples
were prepared following the same procedures as described previously. Microchannels
were first fabricated on 1.5 mm-thick PMMA substrates using CO
2
laser. They were
then aligned and bonded together. As shown in Fig. 4.7, the bonding area is
12
×
mm
40 mm and lies in the middle of the sample. The load is applied at two ends
of the sample. The test length is 120 mm. Two tests were conducted and the results
are shown in Fig. 4.7. Both the samples failed at around 48 kg force, with a
corresponding shear stress of 0.98 MPa (load/bonding area). However, the failure was
caused by the breaking up (the tensile stress is around 26 MPa when the cross section
is taken as 1.5
×
mm
12 mm) of the samples rather than delamination. The bonding
area retains intact throughout the testing. This suggests that the bonding strength is
quite high and durable.
0.0 0.2 0.4 0.6 0.8 1.0
0
10
20
30
40
50
test 1
test 2
Load (kgf)
Extension (mm)
Fig. 4.7
Bonding strength test for solvent-assisted thermal bonding.
Chapter 4 Fabrication and Experimental Testing
— —
76
A leakage test was also performed. Fig. 4.8 shows the test set-up. The
micromixer is first filled with water. Food dye is added for identification of any
leakage. The outlet tube is then closed, and high pressure is applied from the inlet.
The pressure is adjustable and its magnitude is read from a pressure gauge. The
pressure starts from 1.0 bar, and after every 5 minutes it is increased by 0.5 bar to see
whether leakage occurs. Due to the limitation of current experimental facilities, a
maximum pressure of 8.0 bar was applied. Three chips were tested and no leakage
was observed even at the maximum pressure. This further confirmed the durability of
current solvent-assisted thermal bonding.
Fig. 4.8 Schematic of leakage test of thermally bonded microfluidic mixer.
4.3.3 Experimental mixing results
For functional testing, the same optical method was applied. The experimental
set-ups are similar with that shown in Fig. 2.8. The only difference is that the original
Nikkor micro-lens was replaced by a DIN 10X micro objective lens to record the
mixing pictures at a micro scale. It is coupled with the digital camera through an
adapter. The same 98% glycerol-2% liquid food dye solution was applied.
The mixing was recorded at the locations as indicated in Fig. 4.9(a), and they
Chapter 4 Fabrication and Experimental Testing
— —
77
are presented in Fig. 4.9(b) and (c). For both the mixers, the flow rate is 0.14 ml/min,
and the corresponding Reynolds number is around Re ~ 0.01. Results show that
although the Gaussian-like cross-sectional profile of the channel is different from our
original design which is rectangular;
the mixing topology remains nearly the same. In
both mixers, the fluids are continuously laminated into thinner fluid striations, and
therefore a significant increase in interfacial area. This is consistent with previous
observations using meso-size models.
(a.1) TLCCM-A. (a.2) TLCCM-B.
(b) Mixing in TLCCM-A, from left to right, the first 3 cycles.
(c) Mixing in TLCCM-B, from left to right, the 1
st
, 2
nd
, 3
rd
and 5
th
cycles.
Fig. 4.9 Experimental mixing results of the TLCCM mixer at Re ~ 0.01. The dashed
lines in subfigures (a.1) and (a.2) indicate the positions of the observation windows.
Shadowed regions indicate the top-layer channel.
Chapter 4 Fabrication and Experimental Testing
— —
78
4.4 Miniature PDMS mixer
Besides the laser fabrication of PMMA mixer, smaller mixers were fabricated
with PDMS using soft-lithography technique. The fabrication process is outlined in
Fig. 4.10: (a) A layer of SU-8 is first spin-coated onto a silicon substrate. (b) A mask
with the channel design is created on a transparent film. Then, the negative
photoresist is applied. Through the UV exposure, the illuminated SU-8 is polymerized.
(c) Then, the unpolymerized SU-8 is washed away, forming a master for casting
PDMS channels. (d) Next, the PDMS solution is poured over the master and it is
cured at 40-80
o
C for around one hour. (e) Then the PDMS is peeled off from the
master. One-layer channel is obtained. (f) Similarly, the other PDMS layer containing
the microchannel is fabricated. After oxygen plasma treatment, the substrates were
aligned manually under microscope and then bonded together. The microphotographs
of a portion of the mould and the microchannel are shown in Fig. 4.11. The depth of
the channel is 50 micron, and the width of the channel is 100 micron.
Fig. 4.10 Fabrication process of PDMS mixer.
Chapter 4 Fabrication and Experimental Testing
— —
79
(a) (b)
Fig. 4.11 Microphotographs showing a part of (a) the mould, and (b) the cast
microchannel of TLCCM-B.
For experimental testing, a 80% glycerol -20% food dye solution was used. The
previously used 98% aqueous glycerol solution is too viscous (
4
108.6
−
×
12 −
sm ), and
it may cause delamination of the PDMS mixer. For the current solution at 23
0
C, its
viscosity coefficient is
5
1081.4
−
×≈
ν
12 −
sm . Its diffusivity is
10
101.1
−
×≈D
12 −
sm . It
will still guarantee a stringent test on mixing performance. The mixing was performed
at around Re
≈
0.05. The corresponding flow rate is 0.01 ml/min. A DIN 20X micro
objective lens was used to record the mixing pictures. The results are presented in Fig.
4.12. In both the mixers, the fluid striations are clearly recorded, and their
distribution patterns are quite consistent with previous observations using bigger
models. It is also found that, the mixing is faster than the scaled-up models as shown
in Fig. 4.4. This is because: first, the PDMS mixer is much smaller. Correspondingly,
the diffusion length or fluid striation thickness is narrower. Its feature size is only
301
that of the big PMMA models, as the channel width is reduced from 3 mm to
100
m
µ
. Second, as there is less glycerol in the current solution, the diffusion of the
food dye becomes comparatively stronger. Consequently, molecular diffusion
contributes more to the current mixing, blurring the material interface.
Chapter 4 Fabrication and Experimental Testing
— —
80
(a)
(b)
Fig. 4.12 Mixing pictures of PDMS mixer at Re
≈
0.05. (a) TLCCM-A. The dashed
rectangles indicate the positions of the observation windows. (b) TLCCM-B. The
sample windows are consistent with that in Fig. 4.9 (a.2).
Chapter 4 Fabrication and Experimental Testing
— —
81
4.5 Mixing test using chemical method
4.5.1 Testing method
In above mixing test, highly viscous glycerol solution was used. As the
diffusion of the food dye in glycerol is very weak, the fluids’ interface remains quite
sharp. The thinning rate of the fluid striations can be recorded as an index of the
convective mixing. In this section, the performance of the mixer was examined using
a chemical method (refer to Cha et al., 2006). The glycerol solution is diluted, and
diffusive mixing plays a more important role.
A 11.76 WT% NaOH (Aldrich, Germany) aqueous solution and a 1% pH
indicator phenolphthalein (Reagent and Fine Chemicals, UK) are used. Both of them
are mixed with glycerol at a volume ratio 1:5.7. The concentration of glycerol is about
85 Vol.%. Its kinematic viscosity is
5
1037.8
−
×≈
ν
12 −
sm . Its diffusivity is
10
109.0
−
×≈
D
12 −
sm . While the NaOH solution is alkaline, the phenolphthalein
changes its color from colorless to violet red at pH range 8.3~10. As the mixing
continues, the color will become deeper and deeper. The mixing pictures were
recorded by a BX51 Research Microscope (Olympus) coupled with the SONY DXC-
390P 3CCD Camera. Based on the pixel intensity, a revised format of standard
deviation (Eq.(2.3)) is calculated to quantify the mixing degree.
∑
=
−=
N
i
niI
I
N
1
2
)1(
1
σ
(4.1a)
unmixmix
unmixi
ni
II
II
I
−
−
=
(4.1b)
Here,
ni
I = normalized pixel intensity;
i
I = pixel intensity;
Chapter 4 Fabrication and Experimental Testing
— —
82
unmix
I = pixel intensity before mixing;
mix
I = pixel intensity after complete mixing.
The pixel intensities
i
I ,
unmix
I and
mix
I are grayscale values. They are converted
from the RGB pixel intensity using
3/)(
bluegreenred
IIII ++= . (4.1c)
The value of
unmix
I is taken near the inlet before the solutions come into contact. To
obtain the value of
mix
I , the two solutions are first completely mixed. They are then
filled into the mixer, and the pixel intensity is taken under the same working
conditions as the mixing test.
4.5.2 Mixing results
The mixers of meso-size as described in Section 4.2 were tested. The flow rate of
the two fluids is taken as 0.1, 0.4 and 0.8 ml/min, respectively. The corresponding
Reynolds number is around 0.009, 0.035 and 0.070. The results are shown in Fig. 4.13
and Fig. 4.14. When the two colorless fluids come into contact, their color changes to
red. In Fig. 4.13(b.1) and Fig. 4.14(b.1), the fluids’ interfaces can be distinguished
and they grow along the channel. This is consistent with the previous tests using food
dye. In Fig. 4.13(b.2) and Fig. 4.14(b.2), the interface is not so clear. But the pixel
intensity continuously increases along the channel, showing the progress of mixing.
When the flow rate increases from 0.1 to 0.4 ml/min, the Re is still very low, but the
resident time is correspondingly reduced by nearly 4 times. As a result, the mixing
becomes slower. From model A, at 1.0=Q
&
ml/min, the standard deviation decreases
from near 1.0 to around 0.10 after 3.5-unit length. At 4.0=Q
&
and 0.8 ml/min, the
Chapter 4 Fabrication and Experimental Testing
— —
83
values are respectively 0.31 and 0.43 after the same mixer length. For model B, the
mixing also becomes slower with increase in the flow rate. Apparently, the current
mixing attributes more to the diffusion process. Compared with model A, model B
exhibits better mixing. In model A, the standard deviation remains above 0.8 at
location b
4
at all three flow rates. In model B, for a flow rate of 0.8 ml/min, its value is
0.61 after the same mixer length. For a flow rate of 0.1 ml/min, this value is further
reduced to 0.26. This is because the stable regions as discussed in Chapter 3 can be
penetrated through diffusion, and in the current test, diffusive mixing plays a more
important role.
4.6 Conclusions
In this chapter, we demonstrated the fabrication and experimental testing of the
TLCCM mixers. Scaled up models were first fabricated using PMMA plates for
preliminary testing. Subsequently, smaller models (with feature size 300 ~ 400
m
µ
)
were made using laser direct writing and thermal bonding technique for more
evidence. Compared with photolithography techniques, the laser fabrication of
polymeric microfluidic mixers is faster and cheaper. It is very flexible to allow for
design changes and is useful for rapid prototyping. Miniature PDMS mixers were also
fabricated using soft-lithograph technology. Compared with laser machining, this
replica fabrication is more suitable for mass production.
We also demonstrated a simple method to evaluate the mixing performance of a
mixer. When transparent materials such as PMMA or PDMS are used, direct optical
testing can be applied. It could be either dyed liquids or chemical solutions which
change their color upon mixing. Relevant observations are quite consistent with each
Chapter 4 Fabrication and Experimental Testing
— —
84
other and they are also in line with simulation results, further confirming the
effectiveness of the current mixer design.
(a) Observation windows (shadow area shows the top layer).
(a
1
) (a
2
) (a
3
) (a
4
)
(b.1)
(b
1
) (b
2
) (b
3
) (b
4
)
(b
5
) (b
6
) (b
7
) (b
8
)
(b.2)
(b) Mixing pictures of TLCCM-A at 1.0=Q
&
ml/min.
Chapter 4 Fabrication and Experimental Testing
— —
85
(a
1
) (a
2
) (a
3
) (a
4
)
(c.1)
(b
1
) (b
2
) (b
3
) (b
4
)
(b
5
) (b
6
) (b
7
) (b
8
)
(c.2)
(c) Mixing pictures of TLCCM-A at 4.0=Q
&
ml/min.
0 1 2 3 4 5 6 7 8 9
0.0
0.2
0.4
0.6
0.8
1.0
(n)
σ
I
Mixer length (windows b
n
)
0.1 ml/min
0.4 ml/min
0.8 ml/min
(d) Standard deviation
I
σ
along mixer.
Fig. 4.13 Mixing results of TLCCM-A using chemical method.
Chapter 4 Fabrication and Experimental Testing
— —
86
(a) Observation windows (shadow area shows the top layer).
(a
1
) (a
2
) (a
3
) (a
4
)
(a
5
) (a
6
) (a
7
) (a
8
)
(b.1)
(b
1
) (b
2
) (b
3
) (b
4
)
(b
5
) (b
6
) (b
7
) (b
8
)
(b.2)
(b) Mixing pictures of TLCCM-B at 1.0=Q
&
ml/min.
Chapter 4 Fabrication and Experimental Testing
— —
87
(a
1
) (a
2
) (a
3
) (a
4
)
(a
5
) (a
6
) (a
7
) (a
8
)
(c.1)
(b
1
) (b
2
) (b
3
) (b
4
)
(b
5
) (b
6
) (b
7
) (b
8
)
(c.2)
(c) Mixing pictures of TLCCM-B at 4.0=Q
&
ml/min.
Chapter 4 Fabrication and Experimental Testing
— —
88
0 1 2 3 4 5 6 7 8 9
0.0
0.2
0.4
0.6
0.8
1.0
(n)
σ
I
Mixer length (windows b
n
)
0.1 ml/min
0.4 ml/min
0.8 ml/min
(d) Standard deviation
I
σ
along mixer.
Fig. 4.14 Mixing results of TLCCM-B using chemical method.