Investigation of complement protein c1q implications for its protective roles against systemic lupus erythematosus
Bạn đang xem bản rút gọn của tài liệu. Xem và tải ngay bản đầy đủ của tài liệu tại đây (10.32 MB, 207 trang )
INVESTIGATION OF COMPLEMENT PROTEIN C1Q –
IMPLICATIONS FOR ITS PROTECTIVE ROLES
AGAINST SYSTEMIC LUPUS ERYTHEMATOSUS
TEH BOON KING
B. Sc. (Hons), NUS
A THESIS SUBMITTED
FOR THE DEGREE OF DOCTOR OF PHILOSOPHY
DEPARTMENT OF MICROBIOLOGY
NATIONAL UNIVERSITY OF SINGAPORE
2010
Acknowledgements
Being able to finally write this acknowledgement is the culmination of years of hard
work bringing into the fruition of this PhD thesis. It represents a big personal
achievement, and allows me to reflect upon the past 5 years of my life.
I would like to give me biggest thanks to Prof Lu Jinhua for giving me the chance to
do immunology research, despite having to start from ground zero on this topic. I
remember vividly he mentioned that some projects are short, like a 100 metres
sprint, while others are like a 42km marathon run. Well, obviously a PhD project’s
akin to the latter, and throughout these years, I’ve ran some physical marathons and
now I am crossing the finishing line of my PhD research. Thanks Prof Lu for all
your guidance and unwavering support.
Throughout my PhD years, I had great friends and colleagues who have been
supporting me one way or another. Thanks to my friends from my A-levels and
undergrad years for all the great company and more to come, Chee Wei, Alvin,
Edmond, Shawn, Ryan, Kaiming and Shruti. From my undergrad research years
I’ve known great friends who have been highly supportive and are great fun,
Damian, Chew Ling, Adrian, Weixin, Eng Lee, Wenwei, Kher Hsin, William, Si
Ying and Romano.
Thanks to Cheryl for your encouragements. Thanks Yan Ting for your angelic
singing and running company. Many thanks to former and current IP colleagues,
Kok Loon, Adrian, Kenneth and Isaac for the football games we had, and Fei Chuin
for her helps in flow cytometry.
I have many friends from my secondary school years who are not doing science, but
nevertheless have enthusiastically enquired about my progress. Thanks to all my
long-time friends from Ipoh - Ivy, Ow, Mah, Eu Min, Terence, Chris, Ee Meng,
Henry, Kenny, Kevin, Kelvin, Ben, Yeng Pooi, Fee Peng and many more.
Uncountable thanks goes to my adventure buddy, Jonie for all the fun company!
From my lab, I would like to thank Bobby, for all the things you’ve taught me and
for helping me in establishing the T cell isolations. Thanks Dennis for your help in
the confocal microscopy. And thanks to all the former and current lab mates for
their company and help in many ways - Jason, Elaine, Stephanie, Jingyao, Joo Guan,
Yen Seah, Esther, Jocelyn, Guobao, Carol, Meixin, Yinan, Edmund, Linda and
Xiaowei.
Very importantly, I would like to thank my parents for their support and love these
years, for having the courage to let me explore my education in Singapore. Thanks
to all my brothers and cousins, Boon Eng, Boon Aun, Boon Sing and Boon Soon.
Many of those mentioned here often asked, “So when are you finshing?” This one’s
for you all! Finishing the PhD is not an end, the experience learnt is going to last a
lifetime. The science may evolve in time, but the fundamental foundations learnt
will help guide me through.
i
Table of contents
Page
Acknowledgements i
Table of contents ii
Summary vi
List of figures viii
List of tables xi
Publications xii
Abbreviations xiii
CHAPTER 1 1 INTRODUCTION
1.1 1 The immune system and its receptors
1.1.1
1 Innate and adaptive immunity
1.1.2
2 Pattern recognition receptors
1.2
6 Dendritic cells
1.2.1
6 Roles of DC in immunity and tolerance
1.2.2
8 Heterogeneity of DCs
1.3
10 Systemic Lupus Erythematosus (SLE)
1.3.1
10 General overview
1.3.2
11 Antinuclear antibodies are characteristic of SLE and are pathogenic
1.3.3
11 Recent identification of type I interferon (IFN) in SLE pathogenesis
1.4
14 C1q
1.4.1
14 Structure of C1q
1.4.2
15 The classical roles of C1q and the complement system
1.4.2.1 The complement pathways 15
1.4.2.2 C1q in complement-mediated inflammation and defense against pathogens 15
1.4.3 18 Other roles of C1q
1.4.4
20 C1q production and localization in vivo
1.4.4.1 C1q production is distinct from other complement components 20
1.4.4.2 C1q is found to deposit around tissue macrophages and DCs 20
1.4.5 23 The protein secretion pathway - how is C1q secreted?
1.4.5.1 The classical protein secretion pathway 23
1.4.5.2 Unconventional protein secretory routes 24
1.4.5.3 How is C1q processed and secreted? 24
1.4.6 25 Association of C1q deficiency with SLE
1.4.6.1 Known mechanisms by which C1q may be connected to autoimmunity 25
1.4.6.2 The selective C1q production by macrophages and DC, especially the latter, may hold
important answers to its protective role against SLE 27
ii
1.4.7
28
How is C1q production by macrophages and DC regulated by microbial and SLE-
relevant stimuli
1.4.7.1 Interferons 28
1.4.7.2 TLR ligands 28
1.4.7.3 Drugs 29
1.4.7.4 Conclusion 30
1.5 31 Aims of this study
CHAPTER 2 33 MATERIALS AND METHODS
2.1 33 Cell Biology Techniques
2.1.1
33 Isolation of monocytes from human buffy coats
2.1.2
34 In vitro culture of monocyte-derived dendritic cells and macrophages
2.1.3
34 Culture of mouse bone marrow-derived DC (BMDC)
2.1.4
35 Isolation and sorting of mouse splenic DC
2.1.5
35 Cell line culture
2.1.6
36 Stimulation of cells with various agents
2.1.7
39 Total, naïve and memory CD4 T cell isolation
+
2.1.8 40 Isolation of plasmacytoid DC and myeloid DC from PBMC
2.1.9
40 Cell adhesion assay
2.1.10
41 DC macropinocytosis
2.1.11
41 Mixed Lymphocyte Reaction (MLR)
2.1.12
42 Generation of anti-CD3 and anti-CD28 antibody latex beads
2.1.13
43 Phagocytosis of apoptotic Jurkat cells
2.1.14
43 Determination of cell viability
2.2
45 Molecular Biology Techniques
2.2.1
45 Total RNA isolation
2.2.2
45 Reverse transcription (RT)
2.2.3
46 Quantitative real-time PCR
2.3
51 Protein Chemistry Techniques
2.3.1
51 Enzyme-linked Immunosorbent Assay (ELISA)
2.3.2
53 Antibodies used in this study
2.3.3
56 Cell lysate preparation
2.3.4
57 Protein concentration determination
2.3.5
57 SDS-PAGE separation of proteins
2.3.6
58 Western blotting
2.3.7
58 Flow cytometry
2.3.8
59 Confocal microscopy
2.3.9
60 Live cell microscopy
2.4
60 Experimental repeats and statistical analysis
2.5
61 Media and buffers
CHAPTER 3
63
REGULATION OF DC PRODUCTION OF C1Q BY
VARIOUS STIMULI
3.1 63 Introduction
3.2
64 In vitro culture of monocyte-derived dendritic cells (moDC) and its phenotyping
3.3
67
Establishing a system to detect DC expression of C1q in the levels of transcription,
translation and secretion
3.4
71 Regulation of C1q production in DC
iii
3.5
73
Expression of C1q in primary human plasmacytoid DC and CD1c myeloid DC from
peripheral blood leukocytes
+
3.6 82 Expression of C1q in mouse BMDC and splenic DCs
CHAPTER 4
86
SUPPRESSION OF C1Q PRODUCTION IN DC BY THE
YEAST-DERIVED STIMULUS ZYMOSAN THROUGH DECTIN-1
4.1 86 Introduction
4.2
87 Zymosan down-regulates C1q production in DC
4.3
91
Neither opsonization of zymosan by serum factors nor its phagocytosis were required
for C1q downregulation
4.4
92
Dectin-1 but not TLR signaling is required for zymosan downregulation of C1q
production
4.5
96 Dectin-1 inhibition of C1q production can suppress the IFN-γ enhancement of C1q
4.6
99 Dectin-1 induced downregulation of C1q production does not signal through Syk
4.7
101
Arachidonic acid release and ROS generation is not coupled to the downregulation of
C1q production on Dectin-1 stimulation
4.8
102
Involvement of both Raf-1 and Ca signaling are excluded from the suppression of
C1q production following Dectin-1 activation
2+
CHAPTER 5
105
REGULATION OF DC PRODUCTION OF C1Q BY IFN-α
AND IFN-γ – LINKAGE TO SLE PATHOGENESIS
5.1 105 Introduction
5.2
106 C1q production by DC is attenuated by prolonged IFN-α treatment
5.3
107 IFN-γ enhances C1q production and also abrogates IFN-α inhibition
5.4
109
Decreased C1q secretion following IFN-α treatment is not associated with increased
DC death
5.5
111
Downregulation of secreted C1q protein by chronic IFN-α stimulation does not occur
at the transcriptional level
5.6
113
The downregulation of C1q after chronic IFN-α stimulation is also not regulated at the
protein translational level
5.7
115
C1q is mainly trapped in the endoplasmic reticulum and not transported to the Golgi
apparatus for secretion after IFN-α stimulation
5.8
123 Fibronectin secretion is not reduced following IFN-α stimulation
CHAPTER 6
125
DEPOSITED C1Q INDUCES DIFFERENTIATION OF DCS
WITH TOLEROGENIC PROPERTIES
6.1 125 Introduction
iv
6.2
126
C1qDCs express the characteristic surface MHC, co-stimulatory, CD83 and CCR7
molecules like normal DCs
6.3
126 C1qDCs are less adhesive to cell culture wells than normal DCs
6.4
127 C1qDCs phagocytose more apoptotic cells than normal DCs
6.5
131
C1qDCs produce less inflammatory cytokines TNF-α, IL-6 and IL-12 and IL-23 but
more anti-inflammatory cytokine IL-10 than normal DCs
6.6
132 C1qDCs induce less Th1 and Th17 cells than normal DCs
6.7
134 C1qDCs induce less IFN-γ and IL-17 secretion from allogeneic CD4 T cells
+
6.8
141
Maturation stimuli attenuate C1qDCs, but enhance normal DCs, in activating naïve T
cell
6.9
143 C1qDCs exhibit greater ERK, p38 and p70 S6 kinase activation than normal DCs
6.10
145
Inhibition of ERK renders C1qDCs similar to normal DCs in its IL-10 and IL-12
production
CHAPTER 7 147 DISCUSSIONS
7.1 147 Assays for analyzing C1q production in human monocyte derived DCs
7.2
149 Regulation of DC production of C1q by microbial and autoimmune disease factors
7.3
152 Production of C1q by primary DCs
7.4
155
Dectin-1 engagement is a novel mechanism that holistically downregulates C1q
production – implications in SLE pathogenesis resulting from fungal infections
7.5
159 IFN-α, an important SLE pathogenic factor, downregulates C1q secretion
7.6
162
C1q conditions the differentiation of DCs with immunosuppressive properties,
possibly raising the threshold of immune activation required for autoimmunity
7.7
167 Final conclusions
7.8
169 Limitations of this study and future work
REFERENCES 172
v
Summary
C1q is an abundant plasma protein and is the first component of the complement
classical pathway. It binds to antibody-opsonized microbial pathogens or certain
pathogenic self antigens and initiates the activation of the complement classical
pathway. It is also known to have diverse functions beyond providing immunity
against pathogens, and is implicated in the pathogenesis of diseases such as
transmissible spongiform encephalopathy, Alzheimer’s disease and familial
dementia. Conversely, hereditary C1q deficiency in human almost always leads to
the autoimmune condition known as systemic lupus erythematosus (SLE), and
lupus-like conditions also developed in C1q
-/-
mice. In addition, SLE itself causes
consumption of C1q in patients who can produce C1q normally, and these patients
also developed anti-C1q antibodies that can deplete bioavailable C1q.
C1q is produced by dendritic cells (DCs) and macrophages, the two main types of
antigen presentation cells, and DCs are particularly important in the maintenance of
tolerance as well as induction of immunity. In view of the strong association of C1q
and DCs with autoimmune SLE conditions, we investigated the regulation of C1q
production in DCs. We have developed assays to quantitate cellular C1q mRNA,
protein expression and also developed an ELISA assay for measuring secreted C1q
in the DC culture. By ELISA, we screened a large number of stimuli for their ability
to modulate C1q production in DCs. Marked downregulation of C1q production was
observed by two stimuli, i.e. zymosan and interferon alpha (IFN-α). On the other
hand, IFN-γ was found to be a potent inducer of C1q production.
vi
In terms of the signaling mechanisms involved, we found that zymosan signals
through the Dectin-1 receptor to mediate the downregulation of C1q production. It
resulted in a thorough reduction in C1q mRNA, cellular protein and secreted protein.
In contrast, IFN-α upregulated C1q mRNA and cellular protein levels, but it
reduced the secretion of C1q by DCs after prolonged treatments. In this case, we
found that C1q was mainly trapped in the endoplasmic reticulum with little being
detected in the Golgi apparatus which explains the retarded secretion.
C1q production by DCs raises the possibility of autocrine DC regulation by C1q.
We then proceeded to study how C1q may influence DC development and found
that C1q primed the development of DCs with tolerogenic properties. These C1q-
conditioned DCs, which are expected in vivo, are better at clearing apoptotic cells,
produce less inflammatory cytokines, and are less able to activate Th1 and Th17
cells. Higher ERK activity seems to contribute to these tolerance-related features of
DCs differentiated with C1q. These properties suggest that the C1qDCs may raise
the threshold of immune reactions or enhance tolerance, thus negating the
development of SLE which inevitably involves the breakdown of self-tolerance.
vii
List of figures
Figure 1.1. Assembly of the 18 polypeptide chains to form the C1q molecule 14
Figure 1.2. Schematic of the 3 pathways of complement activation - the Classical,
Mannose-Binding Lectin (MBL), and Alternative Pathways 17
Figure 1.3. C1q is found inside and around DCs 22
Figure 1.4. C1q is found inside and around macrophages 22
Figure 3.1. Flow cytometry profile of isolated monocytes 64
Figure 3.2. Surface phenotype of immature and mature DC 66
Figure 3.3. Real-time PCR quantitation of m
RNA from monocyte, macrophage and
DC for C1q expression. 69
Figure 3.4. Intracellular C1q detection in m
onocytes, macrophages and DCs via
Western blot and flow cytometry 70
Figure 3.5. Quantitation of secreted C1q in cell supernatant 70
Figure 3.6. Differential regulation of C1q production in DCs by various microbial
stimuli. 74
Figure 3.7. Differential regulation of C1q production in DCs by steroid drugs,
hormones and cytokine/chemokines 75
Figure 3.8. Flow cytometry profile of total PBMC and isolated pDC 78
Figure 3.9. Flow cytometry analysis of PBMC a
nd purified mDC. 79
Figure 3.10. Quantitation of the expression of C1q A, B and C chains mRNA in
mDC, pDC and m
oDC 80
Figure 3.11. ELISA detection of C1q secreted by MoDC, mDC and pDC into
culture supernatant 81
Figure 3.12. mRNA expression of various markers for subtyping mouse DCs. 84
Figure 3.13. Mouse DCs express C1q mRNA 85
Figure 4.1. Dose dependent suppression of C1q secretion by DC following
zym
osan treatment. 88
Figure 4.2. Western blot of total DC
lysate for C1q and β-actin after zymosan
stimulation. 89
viii
Figure 4.3. Quantitation of C1q mRNA in DC following zymosan treatment 89
Figure 4.4 Determination of cell death in DCs after various treatments by
measuring released lactate dehydrogenase (LDH). 90
Figure 4.5. Neither serum factors nor phagocytosis are required for C1q
downregulation by zymosan. 92
Figure 4.6. Zymosan signals through Dectin-1 and not TLRs to mediate
downregulation of C1q production in DCs 94
Figure 4.7. Dectin-1 is expressed on DC surface. 95
Figure 4.8. Reduction in intracellular C1q levels upon curdlan or zymosan
treatment. 95
Figure 4.9. Dectin-1 stimulation overcomes the enhancement of C1q production by
IFN-γ 98
Figure 4.10. Inhibition of Syk does not restore C1q levels downregulated upon
curdlan treatment back to unstimulated levels 100
Figure 4.11. The Syk inhibitor piceatannol attenuates production of IL-6 and IL-10
after Dectin-1 activation. 100
Figure 4.12. Neither arachidonic acid nor ROS release following Dectin-1 ligation
cause the downregulation of C1q in DCs 102
Figure 4.13. The inhibition of Raf-1 or Ca influx inhibition could not abrogate the
inhibitory effects on C1q production after Dectin-1 ligation.
2+
104
Figure 4.14. Raf-1 inhibitor GW5074 and Ca chelator BAPTA-AM partially
attenuates the production of IL-6 and IL-10 after Dectin-1 activation.
2+
104
Figure 5.1. Distinct and antagonistic regulation of C1q production by IFN-α and
IFN-γ 108
Figure 5.2. Reduction in C1q secreted after IFN-α treatment is not due to increased
cell death 110
Figure 5.3. IFN-α surprising increased C1q mRNA production in DCs together
with IFN-γ 112
Figure 5.4. Intracellular C1q detection in IFN-α and IFN-γ stimulated DCs via
Western blot and flow cytometry 114
Figure 5.5 C1q is trapped in the ER following IFN-α stimulation for 2 days. 117
Figure 5.6 C1q is trapped in the ER following IFN-α stimulation for 2 + 2 days. 118
ix
Figure 5.7 Less C1q is transported to the Golgi apparatus for secretion following 2
days of IFN-α stimulation than IFN-γ stimulation. 119
Figure 5.8. Less C1q is transported to the Golgi apparatus for secretion following 2
+ 2 days of IFN-α than IFN-γ stimulation. 120
Figure 5.9 C1q is not localized in the early endosome after 2 days culture. 121
Figure 5.10 C1q is not localized in the early endosome after 2 + 2 days culture 122
Figure 5.11. Analysis of fibronectin secretion following IFN-α/IFN-γ
124
stimulation.
Figure 6.1. Phenotype of C1qDCs and normal DCs 128
Figure 6.2. Adhesion of C1qDCs and normal DCs. 129
Figure 6.3. C1qDCs display enhanced phagocytosis of AC 130
Figure 6.4. Distinctive anti-inflammatory cytokine production profile by C1qDCs.
133
Figure 6.5. Purity of naïve and memory CD4 cells. 136
Figure 6.6. Less Th1 and Th17 T cells are induced by C1qDCs than normal DCs.
137
Figure 6.7. Induction of IFN-γ and IL-17 secretion from CD4 T cells by C1qDCs
and normal DCs. 138
Figure 6.8. The superior induction of CD4 T cell IFN-γ production by norm
al DCs
is coupled to its IL-12 production 139
Figure 6.9. No significant difference in the induction of regulatory T cells (Treg)
was observed between C1qDCs and normal DCs. 140
Figure 6.10. Allogeneic naïve CD4 T cell prolif
eration in response to normal DCs
and C1qDCs 142
Figure 6.11. CD25 induction by C1qDCs and normal DCs on naïve CD4 T cells
143
Figure 6.12. C1qDCs exhibited stronger ERK, p38 and p70S6K activation than
normal DCs 145
Figure 6.13. ERK inhibition partially restored the inferior IL-12 production in
C1qDCs and abrogated its superior IL-10 production 146
x
List of tables
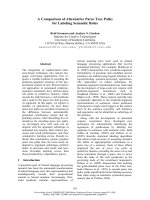
Table 1.1. PRRs and Their Ligands. Adapted from Takeuchi and Akira (2010). 5
Table 2.1. PAMPs used in this study 36
Table 2.2. Cytokines and chemokines used in this study. 37
Table 2.3. Drugs and hormones used in this study. 38
Table 2.4. Pharmacological inhibitors used in this study. 38
Table 2.5. Primers used for SYBR Green real-time PCR quantitation of various
human genes in this study 47
Table 2.6. Primers used for SYBR Green real-tim
e PCR quantitation of various
mouse genes in this study. 50
Table 2.7. Antibodies used in this study 53
xi
Publications
Lu, J., Wu, X. and Teh, B.K. (2007). The regulatory roles of C1q. Immunobiology
212 (4-5), 245-252.
Lu, J.H., Teh, B.K., Wang, L., Wang, Y.N., Tan, Y.S., Lai, M.C. and Reid, K.B.
(2008). The classical and regulatory functions of C1q in immunity and
autoimmunity. Cellular and Molecular Immunology 5 (1), 9-21.
Teh, B.K., Yeo, J.G., Chern, L.M. and Lu, J. (2011). C1q regulation of dendritic cell
development from monocytes with distinct cytokine production and T cell
stimulation. Molecular Immunology 48 (9-10), 1128-38.
Teh, B.K. and Lu, J. (2011). Disparate regulation of C1q production in dendritic
cells by Type I and II interferons. Manuscript in preparation.
Teh, B.K. and Lu, J. (2011). Inhibition of C1q production in dendritic cells by the
fungal zymosan and curdlan through Dectin-1 signaling. Manuscript in preparation.
xii
Abbreviations
7-AAD 7-Amino-actinomycin D
AC apoptotic cell
APC antigen presenting cell
BCS bovine calf serum
BMDC bone marrow-derived dendritic cells
BSA bovine serum albumin
C1q complement component 1, subcomponent q
cDC conventional dendritic cell
cDNA complementary DNA
CLR C-type lectin receptors
DC(s) dendritic cell(s)
DMEM Dulbecco’s modified Eagle’s medium
DMSO dimethylsulfoxide
DNA deoxyribonucleic acid
ECM extracellular matrix
EDTA ethylene diamine tetra acetic acid
ELISA enzyme linked immunosorbent assay
ER endoplasmic reticulum
FCS fetal calf serum
Fig. Figure
FITC fluorescein isothiocyanate
Fn fibronectin
GM-CSF granulocyte macrophage-colony stimulating factor
hi high
hr hour
IC immune complex
IFN interferon
Ig immunoglobulin
IL interleukin
int intermediate
kDa kilodalton
LDH lactate dehydrogenase
lo low
LPS lipopolysaccharide
mAb monoclonal antibody
MACS magnetic activated cell sorting
MAPK mitogen activated protein (MAP) kinase
mDC human blood myeloid DC
MFI mean fluorescent intensity
MHC major histocompatibility class
min minutes
moDC human monocyte-derived dendritic cell
mRNA messenger RNA
MyD88 myeloid differentiation factor 88
NFAT nuclear factor of activated T cells
NF-B nuclear factor kappa B
xiii
xiv
NOS nitric oxide synthase
OD optical density
PAMPs pathogen-associated molecular patterns
PBS phosphate buffered saline
pDC plasmacytoid dendritic cell
PFA paraformaldehyde
PI propidium iodide
PMA phorbol 12-myristate-13-acetate
PRR(s) pattern recognition receptor(s)
ROS reactive oxygen species
RNA ribonucleic acid
RPMI RPMI-1640 culture medium
SDS-PAGE sodium dodecyl sulfate-polyacrylamide gel electrophoresis
sec seconds
SLE systemic lupus erythematosus
Syk spleen tyrosine kinase
TBS Tris-buffered saline
TCR T cell receptor
TLR(s) Toll-like receptor(s)
TNF tumour necrosis factor
Tris tri-hydroxymethyl-aminomethane
Chapter 1 Introduction
1.1 The immune system and its receptors
1.1.1 Innate and adaptive immunity
The immune system confers the ability for an organism to defend against
exogenous microbial infection and also to respond to endogenously derived dangers
such as malignancy and tissue damage. The vertebrate immune system is divided
into two intimately linked arms, the innate and the adaptive immunity. The innate
immune system reacts rapidly to dangers, possibly within hours or minutes, and in a
general manner rather than specific to a particular pathogen or aberrant cell. It
represents the first line of defense against microbial infections, including viruses,
bacteria, fungi and parasites (Medzhitov and Janeway, 2000). In contrast, the
adaptive immunity takes time to develop, about 4 – 7 days. It provides
immunological memory, or lasting protection against re-encounters with a
particular pathogen. Possibly, re-encounters with the specific antigen could result in
an even stronger immune response against it.
The adaptive immune response comprises of T-cell mediated cellular immunity and
B-cell mediated humoral or antibody immunity. T-cell and B-cell receptors are
required for specific antigen recognition. An extremely diverse repertoire of B-cell
and T-cell receptors are generated somatically during lymphocyte development
because of the random nature of VDJ gene segment recombination during the
1
process of receptor gene rearrangement. Consequently, there is a high probability of
the existence of an individual receptor on a single cell specific to a particular
antigen. A lymphocyte with its receptor presented with its specific antigen by APCs
would subsequently be activated and proliferates. The clonal selection and
expansion of the destined cell is the key behind immunological response and
immune memory in adaptive immunity.
The distinctive difference between the innate and adaptive immune systems lies in
the receptors used for danger recognition. Innate immunity is mediated by
germline-encoded receptors that have evolved to recognize a few highly conserved
structures present in different groups of microorganisms, referred to as pathogen
associated molecular patterns (PAMPs) (Medzhitov and Janeway, 2000). The
receptors that recognize PAMPs are known as pattern recognition receptors (PRRs).
1.1.2 Pattern recognition receptors
Immune cells, particularly the antigen-presenting cells (APCs) such as macrophages
and dendritic cells (DCs), express different PRRs that can be cell membrane-
associated, in intracellular compartments or secreted into the blood stream and
tissues, and all receptors facilitate the recognition of PAMPs. More recently, PRRs
were discovered to also recognize endogenous molecules released from damaged
cells, termed damage-associated molecular patterns (DAMPs). Some PRRs capture
pathogens and subsequently mediate their phagocytosis and endocytosis, and these
are the phagocytic/endocytic receptors. Among the membrane-associated receptors
of this category are the mannose receptor (MR), scavenger receptors (SRs) and
2
complement receptors (CRs) (Aderem and Underhill, 1999). There are also secreted
PRRs or pattern recognition molecules (PRM) that could bind their targets and act
as opsonins. These include the pentraxins (PTX) such as C-reactive protein (CRP),
serum amyloid protein (SAP) and PTX3 (Gewurz et al., 1995; Bottazzi et al., 2006);
collectins such as lung surfactant proteins A (SP-A) and D (SP-D) and mannose-
binding lectin (MBL) (Kishore et al., 2006; Takahashi et al., 2006; Gupta and
Surolia, 2007); complement components such as C1q (Lu et al., 2008) and C3
(Sahu and Lambris, 2001); LPS-binding protein (LBP); and CD14 (Fenton and
Golenbock, 1998; Schutt, 1999).
Sensing PRRs include the transmembrane Toll-like receptors (TLRs) and C-type
lectin receptors (CLRs). Cytosolic sensing PRRs include the RIG-I-like receptors
(RLRs) and NOD-like receptors (NLRs). Engagement of these receptors leads to
signaling cascades resulting in transcriptional expression of inflammatory mediators
that coordinate the elimination of pathogens and infected cells. However, aberrant
activation of this system could lead to immunodeficiency, septic shock, or induction
of autoimmunity (Takeuchi and Akira, 2010). Table 1.1 provides a summary of the
ligands recognized by these sensing PRRs.
Currently, 10 TLRs are identified in humans and 12 in mice (Akira et al.,
2006). TLRs have extracellular N-terminal leucine-rich repeats, a transmembrane
region followed by a cytoplasmic Toll/IL-1R homology (TIR) domain. Stimulation
of TLRs result in the recruitment of TIR domain-containing adaptors, such as
MyD88 and TRIF, with downstream signaling cascades activating NF-κB, MAP
3
kinases and IRFs, leading to inflammation, as characterized by the production of
cytokines, chemokines and type I interferon (Akira et al., 2006).
The CLRs have one or more domains that are homologous to carbohydrate
recognition domains and can exist both as soluble and transmembrane proteins
(Geijtenbeek and Gringhuis, 2009). Some CLRs can induce signalling pathways
that directly activate NF-κB, whereas other CLRs affect signaling by TLRs. DC
expressed CLRs that have garnered interest lately include the DEC205, DC-SIGN,
Dectin-1 and Dectin-2. Importantly, Dectin-1 and Dectin-2 are immunoreceptor
tyrosine-based activation motif (ITAM)-coupled and are important for detection of
β-glucans from fungi.DCs activated by Dectin-1 or Dectin-2 are shown to activate
T cells and confer protective immunity against C. albicans (Robinson et al., 2009)
RLRs are composed of two N-terminal caspase recruitment domains (CARDs), a
central DEAD box helicase/ATPase domain, and a C-terminal regulatory domain
(Yoneyama and Fujita, 2008). They are cytoplasmic sensors that recognize the
genomic RNA of dsRNA viruses and dsRNA generated as the replication
intermediate of ssRNA viruses. The CARDs of RLRs are activate the signaling
cascades by interacting with the N-terminal CARD-containing adaptor IFN-β-
promoter stimulator 1 (IPS-1) and the downstream signaling events activate type I
interferon genes. NLRs are cytoplasmic pathogen sensors with a central nucleotide-
binding domain and C-terminal leucine-rich repeats. The N-terminal harbor protein-
binding motifs, such as CARDs, apyrin domain, and a baculovirus inhibitor
of apoptosis protein repeat (BIR) domain (Takeuchi and Akira, 2010). TLRs and
NODs can synergize and activate inflammatory cytokine production.
4
Table 1.1. PRRs and Their Ligands. Adapted from Takeuchi and Akira (2010).
PRRs Localization Ligand Origin of the Ligand
TLR
TLR1
Plasma
membrane
Triacyl lipoprotein Bacteria
TLR2
Plasma
membrane
Lipoprotein
Bacteria, viruses,
parasites, self
TLR3 Endolysosome dsRNA Virus
TLR4
Plasma
membrane
LPS Bacteria, viruses, self
TLR5
Plasma
membrane
Flagellin Bacteria
TLR6
Plasma
membrane
Diacyl lipoprotein Bacteria, viruses
TLR7 (human
TLR8)
Endolysosome ssRNA Virus, bacteria, self
TLR9 Endolysosome CpG-DNA
Virus, bacteria, protozoa,
self
TLR10 Endolysosome Unknown Unknown
TLR11
Plasma
membrane
Profilin-like molecule Protozoa
RLR
RIG-I Cytoplasm
Short dsRNA, 5′triphosphate
dsRNA
RNA viruses, DNA virus
MDA5 Cytoplasm Long dsRNA
RNA viruses
(Picornaviridae)
LGP2 Cytoplasm Unknown RNA viruses
NLR
NOD1 Cytoplasm iE-DAP Bacteria
NOD2 Cytoplasm MDP Bacteria
CLR
Dectin-1
Plasma
membrane
β-Glucan Fungi
Dectin-2
Plasma
membrane
β-Glucan Fungi
MINCLE
Plasma
membrane
SAP130 Self, fungi
5
1.2 Dendritic cells
1.2.1 Roles of DC in immunity and tolerance
DCs play a vital role in the immune system. As the major APC, DCs provide a
bridge between innate and adaptive immunity (Banchereau and Steinman, 1998). In
their immature state, DCs act as sentinels, and through its effective antigen
sampling via macropinocytosis and endocytosis, they sense their macroenvironment
for danger signals (PAMPs) from pathogens and endogenous sources (DAMPs). On
sensing a danger signal, DCs undergo maturation, mount an immune response
leading to inflammation and subsequent priming of the adaptive immunity. This is
coupled to increased antigen processing and presentation by upregulation of both
the MHC I and MHC II components, upregulation of costimulatory molecules such
as CD40, CD80 and CD86 and increased cytokine production (eg. IL-12, IL-10,
TNF-α and IL-6).
DCs that have undergone functional maturation would migrate to the T cell region
of secondary lymphoid organs (Randolph et al., 2005), and are highly efficient at
stimulating T cells via 3 distinct signals, i.e. antigen specific TCR stimulation,
costimulatory surface signals such as CD80/CD86 stimulation of CD28 receptor on
T cells, and also cytokines such as IL-12. Internalized antigens are degraded, loaded
onto MHC II complexes and presented to CD4 T helper cells that express the
antigen-specific TCR. Endogenous antigens are processed and loaded onto MHC I
for the priming of cytotoxic CD8 T cells that bear the specific TCR.
6
DCs can polarize adaptive immunity by inducing specific CD4 T helper cell subsets
(Guermonprez et al., 2002). The 3 main subsets of T helper responses currently
studied are the Th1, Th2 and Th17 responses. Differentiation of naïve CD4 T cells
into Th1 largely requires IL-12p70 production by DCs (Trinchieri, 2003). Th1 cells
produce IFN-γ and TNF-β, and Th1 immunity is generally acknowledged to protect
against intracellular pathogens and tumors. Th2 cells produce IL-4, IL-5 and IL-13
and are responsible for promoting humoral immunity against parasites. IL-4 and
OX40L are some known factors that direct Th2 polarization (Ito et al., 2005). Th17
cells are more recently discovered and characterized. They produce IL-17A, IL-17F,
and IL-22 and its differentiation is promoted by TGF-β, IL-6, IL-21 and IL-23
(Korn et al., 2009). Functionally, Th17 cells are implicated in defense against
extracellular pathogens such as fungi, and development of autoimmune and
inflammatory diseases such as psoriasis and rheumatoid arthritis.
Unabrogated inflammation caused by unabated T cell activation is detrimental to
systemic homeostatis and can lead to autoimmunity. The normal immune system
produces a population of T cells, called regulatory T cells (Tregs) that are
specialized for immune suppression. Tregs are important in the maintenance of
peripheral immunological self-tolerance. They suppress effector T-cell proliferation
and thus can actively downregulate the activation and/or proliferation of self-
reactive T cells (Sakaguchi et al., 2008). Naturally occurring Treg arise in the
thymus, and T cell activation usually induces a population of Tregs, and they are
characterized as CD4
+
CD25
+
FoxP3
+
. In addition to Treg cells, there also exists DCs
with tolerogenic properties that are crucial regulators of immunity (Morelli and
Thomson, 2007). Immature DCs are long been known to be tolerogenic, and mature
7
tolerogenic DCs do not express the full armada of strong stimulatory signals.
Tolerogenic DCs can present antigen to antigen-specific T cells, but provides
inadequate co-stimulatory signals (or deliver net co-inhibitory signals) for effector
T-cell activation and proliferation. This can result in T-cell death, T-cell anergy or
regulatory T-cell expansion or generation. Thymic DCs can negatively select
autoreactive CD4
+
CD8
+
thymocytes and induce tolerance to self antigens (Brocker
et al., 1997). Thus, tolerogenic DCs have been shown to suppress autoimmune
conditions (Menges et al., 2002; Verginis et al., 2005).
1.2.2 Heterogeneity of DCs
There are loosely two categories of DCs. In the periphery, Langerhan cells and
dermal DCs act as sentinels for pathogens or peripheral self-antigen, then undergo
maturation and migrate via the lymphatics toward draining lymphoid organs and
these are categorized as migratory DCs (Wilson et al., 2003). Lymphoid tissue
resident DCs are found in all lymphoid organs of the mouse, including the spleen
and draining lymph nodes. These cells are immature in the steady state, and are
CD11c
hi
CD45RA
lo
MHC II
int
, which can be further broken into two broad subsets;
the CD8
+
conventional DC (cDC) and the CD8
–
cDC (Naik, 2008). On maturation,
these DCs become migratory and are MHC II
hi
.
Plasmacytoid DCs (pDC) are CD11c
int
cells, and are considered as pre-DCs. At
resting state, they resemble plasma B cells (Liu, 2005). In the steady state, pDCs
express low levels of MHC I, MHC II and co-stimulatory molecules, and all are
upregulated upon activation. Following activation, pDCs produce high levels of
8
type I interferon, and concomitantly acquire DC morphology and functions, such as
antigen presentation and T cell activation.
In the human blood, DCs are a heterogeneous cell population originating from bone
marrow precursors and they make up approximately 1% of circulating peripheral
blood mononuclear cells (PBMCs) (Kassianos et al., 2010). CD11c divides
lin
−
HLA-DR
+
blood DC into the CD11c
−
plasmacytoid (pDC) and CD11c
+
myeloid
(mDC) subsets. pDCs represent about 18% of the blood DC population and is
distinguished from mDC by their expression of CD123, CD303 (BDCA-2) and
CD304 (BDCA-4/neuropilin-1). mDC comprises over 70% of blood DCs and can
be subdivided into 3 subsets. The CD1c
+
(BDCA-1) subset makes up around 19%
of blood DCs and is the most extensively studied mDC subset. The CD16
+
subset
constitutes about 50% of blood DCs and has not been studied extensively due to
CD16 depletion in many isolation protocols and their poor viability in vitro. The
CD141
+
(BDCA-3) subset is the rarest, constituting around only 3% of blood DCs
and is the least studied.
Due to the rarity of DCs in peripheral blood, in vitro experiments have mostly
relied on DCs generated from mouse bone marrow cells supplemented with GM-
CSF (Inaba et al., 1992) or from human blood monocytes cultured with GM-CSF
and IL-4 (Sallusto and Lanzavecchia, 1994). A glaring disadvantage of this method
is DCs generated this way are highly inflammatory and are only found in vivo
following an inflammation (Shortman and Naik, 2007). Thus, they do not represent
the steady state DCs that represent the normal population of DCs in healthy
individuals.
9
1.3 Systemic Lupus Erythematosus (SLE)
1.3.1 General overview
Systemic lupus erythematosus (SLE) or lupus is a multi-factorial systemic
autoimmune disease affecting multiple organs, including the heart, joints, skin,
lungs, blood vessels, liver, kidneys, and nervous system. The clinical presentations
of the disease range from rash and arthritis through anemia and thrombocytopenia
to serositis, nephritis, seizures, and psychosis (Rahman and Isenberg, 2008). SLE
patients have genetic susceptibility and it predominantly affects women, especially
those of reproductive age. Females of African American or Hispanic American
origins have a 3–4 times increased risk of developing disease compared to
Caucasians (Reveille et al., 1998).
The underlying pathogenic mechanisms of SLE remain poorly understood and as a
result, treatment options are limited. However, major progresses have been made in
the understanding of this disease (Croker and Kimberly, 2005). The development of
antinuclear antibodies is a hallmark in SLE. These antibodies form immune
complexes (IC) with nuclear antigens (e.g. chromatin and RNP) and cause unabated
type I IFN production from plasmacytoid DCs which is highly pathogenic in SLE
(Banchereau and Pascual, 2006; Pascual et al., 2006). These ICs can form or
deposit in connective tissues to cause C1q-mediated complement activation leading
to tissue inflammation and damages (Flierman and Daha, 2007). Therefore, both
type I IFN and C1q are in theory predicted to have detrimental roles in SLE
development. However, hereditary C1q deficiency is strongly associated with SLE
development which, in contrary, suggests a strongly protective role for C1q (Petry
10