Mathematical and computational analysis of intracelluar dynamics 2
Bạn đang xem bản rút gọn của tài liệu. Xem và tải ngay bản đầy đủ của tài liệu tại đây (243.72 KB, 26 trang )
Part I
The p53-AKT network:
A genetic network regulating cell survival and death
The biological system studied in Part I (Chapters 2 to 5) is a key genetic network
regulating cell survival and death, which constitutes a connected network of cancerrelevant genes.
These genes interact among themselves through the various
regulatory feedback loops inherent in the genetic network that generates rich and nonintuitive systems behaviors. Therefore, a critical study of the interaction dynamics
can lead to the understanding of how cells regulate the switch between cell survival
and death in the presence of DNA damage and growth factor.
7
Chapter 2
AKT versus p53 in a Network of Oncogenes and
Tumor
Suppressor
Genes
Regulating
Cell
Survival and Death
The tumor suppressor protein p53 is often referred to as the ‘guardian of the genome’
because of its key role in inducing cells to die when, for example, their DNA is
irreparably damaged. This role is implemented by promoting the cell death program,
called apoptosis, through mechanisms that can be both dependent and independent of
p53’s transcriptional activity (Fridman and Lowe, 2003). At least half of known
human cancers are associated with p53 gene mutations, and the majority of the
remaining half involves malfunctions of the pathways regulating the protein’s
activities (for reviews, see Lowe et al., 2004; Haupt et al., 2003; Oren, 2003;
Vogelstein et al., 2000). In both mutated and wild type cases, p53 is prevented from
causing apoptosis of cancer cells.
The serine/threonine kinase AKT (Protein Kinase B), on the other hand,
promotes cell survival by inhibiting pro-apoptotic proteins (such as BAD and
CASPASE-9) through phosphorylation (for reviews, see Franke et al., 2003;
Nicholson and Anderson 2002; Datta et al., 1999). Thus, p53 and AKT influence the
process of apoptosis in opposite ways. Recent results summarized in the next section
(Section 2.1) indicate that there are crosstalks between p53 and AKT involving gene
transcription as well as post-translational protein modifications, which is
8
characterized by a positive feedback loop between p53 and AKT. This loop can also
be described as a mutual antagonism between an oncoprotein, AKT, and a tumor
suppressor protein, p53 (Harris and Levine, 2005; Gottlieb et al., 2002).
This chapter summarizes the extensive biological literature pertaining to the
interactions of genes in the p53-AKT network (Section 2.1), the regulation of the p53AKT network by growth factors and cellular stress (Sections 2.2 and 2.3) and finally,
the regulation of caspase-dependent apoptosis (Section 2.4) by the p53-AKT network
(Section 2.5). The regulatory networks reviewed here form the foundation of the
mathematical models that are presented and analyzed in Chapters 3 and 5.
2.1 The p53-AKT network
The complexity of p53 regulation is depicted in a recent review of Harris and Levine
(2005), which focuses on the many positive and negative feedback loops in the
regulatory networks. Two of these loops are shown in a qualitative network of the
p53-AKT network depicted in Figure 2-1. One is the important negative feedback
loop between MDM2 and p53 (edges 5 and 6).
MDM2 binds and blocks the
transactivation domain of p53, thereby inhibiting its transcriptional activity (Wu et al.,
1993; Momand et al., 1992; Oliner et al., 1993). The p53-MDM2 complex then
shuttles from the nucleus to the cytoplasm (Tao et al., 1999; Kubbutat et al., 1999)
where MDM2 serves as an E3 ubiquitin ligase and targets p53 for ubiquitin-mediated
proteosomal degradation (Wu et al., 1993; Haupt et al., 1997; Kubbutat et al., 1997).
On the other hand, expression of the MDM2 gene is induced by p53.
9
PTEN
1
2
PIP3
3
7
6
p53
MDM2
4
AKT
5
Apoptosis
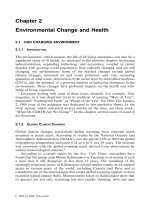
Figure 2-1. Qualitative network showing interactions involving p53 and AKT.
An arrow means a pathway that leads to activation or upregulation; a hammerhead represents
inhibition or downregulation. AKT is antagonized by p53 via edges 1 to 3; and p53 is
antagonized by AKT via edges 4 and 5. A p53-MDM2 negative feedback loop is shown by
edges 5 and 6. A possible mutual activation loop between p53 and PTEN is shown by edges
1 and 7. PTEN: Phosphatase and Tensin homolog deleted on chromosome ten; PIP3:
Phosphatidyl Inositol-3,4,5-trisphosphate; MDM2: Murine Double Minute Clone 2; AKT:
Protein Kinase B.
The link between p53 and AKT (edges 1 to 3) involves PIP3 and PTEN as
shown in Figure 2-1. PIP3 is required for the recruitment of AKT to the plasma
membrane where AKT gets phosphorylated and activated (Franke et al., 2003). One
way by which p53 inhibits production of PIP3 indirectly is by inducing the expression
of the lipid phosphatase PTEN (Stambolic et al., 2001; Harris and Levine, 2005). The
chief biological function of PTEN is the dephosphorylation of PIP3, thereby inhibits
its kinase activity (Gil et al., 2007); other phosphatase substrates of PTEN have
remained rare (Trotman et al., 2003). Another way is by p53 repression of the
catalytic subunit of PI3K, the enzyme that catalyzes the formation of PIP3 (Singh et
al., 2002). Active AKT phosphorylates MDM2 (edge 4 of Figure 2-1) causing the
latter to translocate to the nucleus where it inhibits p53 (Zhou et al., 2001; Mayo and
Donner, 2001).
10
As shown in Figure 2-1, a positive feedback loop (p53-AKT-MDM2-p53;
edges 1 to 5) and a negative loop (p53-MDM2-p53; edges 5 and 6) are coupled via the
MDM2-p53 interaction.
Mayo and Donner (2002) suggested an interesting
interpretation of this coupling based on a report that the p53-induced transcriptional
activation of MDM2 precedes that of PTEN (Stambolic et al., 2001). According to
this interpretation, the p53-MDM2 negative feedback loop autoregulates the increase
in p53 and delays p53-induced apoptosis to allow cells with DNA that are not
irreversibly damaged or mutated to survive. A subsequent p53-induced expression of
PTEN triggers the p53-PTEN “amplification loop” which then suppresses the cell
survival machinery; it is then suggested that this suppression is obligate for p53
apoptotic activity (Mayo and Donner, 2002).
Recent studies showed that PTEN could activate p53 through phosphataseindependent mechanisms. After association with P300, PTEN enhances acetylation of
p53 at Lysine373 and Lysine382, and generates a subsequent PTEN binding site (Li et
al., 2006). p53 that is bounded to PTEN-P300 has enhanced DNA-binding activity
that augments transcription of PTEN and p21 (Li et al., 2006; Freeman et al., 2003;
Luo et al., 2004). Because MDM2 cannot bind to this complex, it cannot mediate
degradation of this specific form of p53 (Freeman et al., 2003; Zhou et al., 2003; Li et
al., 2002). However, several biological questions still remain. For instance, it is
unclear whether PTEN-p53 complex could also enhance MDM2 transcription (an
inherent p53 function) or whether it could still dephosphorylate PIP3 (an inherent
PTEN function). So far, PTEN-p53 binding has been reported in U2OS (Li et al.,
2006), Saos2 (Li et al., 2006; Freeman et al., 2003), ALL (Zhou et al., 2003) and
MEF (Freeman et al., 2003) cells. The relevance of this putative p53-PTEN positive
11
feedback loop (edges 1 and 7 of Figure 2-1) in the control of the cell survival-death
switch will be addressed in Chapter 5 (Section 5-11).
Among the five proteins of the p53-AKT network, four of them are
deregulated recurrently in numerous types of human tumors.
p53 is the most
commonly mutated gene in leukemia, breast, gastric, ovarian and colorectal cancers
(Royds and Iacopetta, 2006), followed by PTEN that is frequently mutated in
glioblastoma, prostate, endometrial, breast and lung tumors (Depowski et al., 2001;
Maier et al., 1998; Li et al., 1997; Steck et al., 1997). MDM2 and AKT, on the
contrary, are often amplified and over-expressed (Altomare et al., 2005; Nicholson et
al., 2002; Alarcon-Vargas et al., 2002). Thus, p53 and PTEN are major tumor
suppressors (Mayo et al., 2002; Mayo and Donner, 2002; Cantley et al., 1999)
whereas MDM2 and AKT are major oncogenes (Alarcon-Vargas et al., 2002;
Momand et al., 2000).
2.1.1
Cell types that activate the p53-AKT genetic
network
As expected from the mutual inhibition between p53 and AKT, inverse correlation
between protein levels of p53 and phosphorylated (active) AKT have been reported
recently in numerous cell lines, such as human breast epithelial cancer (MCF-7 and
HBEC), primary human embryonic kidney (HEK 293), human sarcoma osteogenic
(Saos-2), human colon tumor (EB1), primary human keratinocytes and foreskin
fibroblasts, mouse fibroblasts (MEF and NIH3T3), mouse lymphoid and
hematopoietic (DA-1 and BaF3), mouse epidermal (CI41) and mouse hippocampal
12
neurons (Gottlieb et al., 2002; Su et al., 2003; Wang et al., 2005; Ogawara et al.,
2002; Zhou et al., 2001; Singh et al., 2002; Yamaguchi et al., 2001; Mayo and
Donner, 2001). However, because experimentalists have not attempted a systems
analysis of the p53-AKT genetic network, the specific cell types in which the p53AKT network is active are extracted from separate publications.
Both the p53-MDM2 feedback loop and the PI3K/PIP3/AKT pathway are very
well-studied during the last decade. The p53-MDM2 loop is active in practically all
cell types in response to various cellular stress (Vogelstein et al., 2000; Momand et
al., 2000; Bond et al., 2005; Piette et al., 1997; Momand and Zambetti, 1997; JuvenGershon and Oren, 1999; Moll and Petrenko, 2003; Iwakuma and Lozano, 2003;
Alarcon-Vargas and Ronai, 2002; Horn and Vousden, 2007) while the
PI3K/PIP3/AKT pathway is a general survival pathway that is activated by diverse
survival and growth factors whose activity is essential for cell survival in most cell
types (Nicholson and Anderson, 2002; Kandel and Hay, 1999; Franke et al., 2003;
Coffer and Woodgett, 1991; Jones et al., 1999; Bellacosa et al., 1993; Brazil and
Hemmings, 2001; Datta et al., 1999; Kauffmann-Zeh et al., 1997; Blair et al., 1999;
Chen et al., 1998; Crowder and Freeman, 1998, 1999; Eves et al., 1998; Gerber et al.,
1998; Häusler et al., 1998; Kennedy et al., 1997; Khwaja and Downward, 1997;
Khwaja et al., 1997; Kulik et al., 1997; Kulik and Weber, 1998; Philpott et al., 1997;
Rohn et al., 1998; Songyang et al., 1997; Xiong and Parsons, 1997; Liu et al., 1999;
Gold et al., 1999; del Peso et al., 1997; Ahmed et al., 1997; Parry et al., 1997; BlumeJensen et al., 1998; Gibson et al., 1999; Leverrier et al., 1999; Kontos et al., 1998;
Gautreau et al., 1999). Similarly, PTEN protein expression is constitutive in all
tissues and essential at all times (Salmena et al., 2008; Li et al., 1998; Chung et al.,
13
2005; Perren et al., 1999; Di Cristofano et al., 1998; Podsypanina et al., 1999;
Stambolic et al., 1998, 2000, 2001; Suzuki et al., 1998; Li and Sun, 1998; HaasKogan et al., 1998; Shan et al., 2000; Wu et al., 1998; Sun et al., 1999), whose key
biological function is to inhibit the PI3K/PIP3/AKT-mediated survival pathway by
deactivating PIP3 through dephosphorylation (Weng et al., 1999; Li et al., 1998; Li
and Sun, 1998; Wang et al., 2000; Shan et al., 2000; Haas-Kogan et al., 1998;
Ramaswamy et al., 1999; Zhou et al., 2003; Su et al., 2003; Wu et al., 1998;
Stambolic et al., 1998, 2001; Dahia et al., 1999; Maehama and Dixon, 1998).
On the other hand, the remaining interactions in the p53-AKT network
namely, p53-PTEN and AKT-MDM2, are elucidated recently.
p53-dependent
transcription of PTEN (p53-PTEN) has thus far been detected in human breast cancer
epithelial (MCF-7), human colon carcinoma (HCT116 and EB1), human sarcoma
osteogenic (Saos-2), human adenocarcinoma (H460), human lung fibroblast (WI38),
human osteosarcoma (U2OS), human epithelial carcinoma (HeLa), human
hepatocellular carcinoma (HepG2), human glioblastoma (A172 and U87MG), human
prostate carcinoma (PC3), human acute myeloid leukemia (AML-5), primary human
bronchial epithelial (HBEC), mouse embryonic fibroblasts (MEF), mouse
erythroleukemia (DP16) as well as in mouse skeletal muscle, heart, white fat, liver,
kidney, lung, small intestine, colon, skin and brain cortex (Feng et al., 2007; Wang et
al., 2005; Stambolic et al., 2001; Trotman and Pandolfi, 2003; Singh et al., 2002;
Tang and Eng, 2006a, 2006b). AKT phosphorylation of MDM2 (AKT-MDM2) has
been observed in human breast epithelial and tissues (MCF-7, MDA-468, T47D),
human non-small lung carcinoma (H1299), human osteosarcoma (U2OS), human
sarcoma osteogenic (Saos-2), human fibroblasts (MRC-5), human embryonic kidney
14
(293T and HEK293), human primary keratinocytes cells, mouse fibroblasts (NIH3T3
and MEF) (Gottlieb et al., 2002; Mayo et al., 2002; Mayo and Donner, 2001;
Ashcroft et al., 2002; Ogawara et al., 2002; Zhou et al., 2001).
In summary, cell types in which every interaction in the p53-AKT network is
active are observed at least in human breast cancer epithelial (MCF-7), human
sarcoma osteogenic (Saos-2), human osteosarcoma (U2OS), as well as in human and
mouse fibroblasts. This list of cell types is incomplete because firstly, it is impossible
to review the entire literature pertaining to each part list of the p53-AKT network and
secondly, current active research activities particularly in the p53-PTEN and AKTMDM2 interactions will expand the cell types used in experiments. As such, the list
of cell types described here is clearly an underestimation.
2.2 Regulating the p53-AKT network
The p53-AKT network is regulated by signals emanating from growth factors and
cellular stress (e.g. DNA damage), which results in either cell survival or death, as
described below.
2.2.1
Growth-factor stimulation
Growth factors promote cell survival via the PI3K/AKT network, one of the central
signal transduction pathways that comprises of PI3K, PDK1, PIP3, AKT and PTEN
15
(Lian and Cristofano, 2005), as depicted in Figure 2-2.
PI3K is a heterodimer
composing of two subunits namely, p85 regulatory unit and p110 lipid catalytic unit.
Upon binding of growth factors such as IGF, EGF, FGF, and NGF etc to their
respective cell receptors, p85 subunit of PI3K is recruited to the receptors at the cell
membrane, where the activated p110 catalytic subunit phosphorylates PIP2 to form
PIP3 (Deleris et al., 2006; Viniegra et al., 2005; Datta et al., 1999; Jarpe et al., 1998).
Together with PDK1, PIP3 phosphorylates AKT at Threonine308 (Franke et al.,
2003; Scheid et al., 2002); and Serine473 by a yet to be identified kinase (Deleris et
al., 2006); both resides must be phosphorylated to fully activate AKT kinase activity.
Active AKT thereby promotes cell survival through phosphorylation that activates
pro-survival substrates such as oncoprotein MDM2 while deactivates pro-apoptotic
substrates (Ahmed et al., 1997; Kennedy et al., 1997; Songyang et al., 1997; Khwaja
et al., 1997; Dudek et al., 1997; Kulik et al., 1997).
Growth factor-bound receptors
PI3K
PIP2
PIP3
PDK1
AKT
AKTa
Cell survival
PTEN
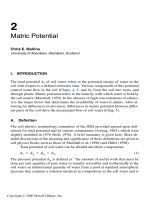
Figure 2-2. The PI3K/AKT network.
Growth factors promote cell survival via the PI3K/AKT network (see main text for details).
AKTa denotes active AKT protein. PI3K: Phosphatidylinositol 3-Kinase; PIP2: Phosphatidyl
16
Inositol-2,4,5–triphosphate; PIP3: Phosphatidyl
Phosphoinositide-Dependent Kinase 1.
Inositol-3,4,5–triphosphate;
PDK1:
As the key negative regulator of the PI3K/Akt survival pathway, PTEN
prevents uncontrolled cell proliferation by quenching AKT-mediated cell survival
through efficient dephosphorylation of PIP3 to PIP2 (Gil et al., 2007). Indeed, loss of
PTEN function in various cell lines results in accumulation of PIP3 and subsequent
activation of AKT (Franke et al., 1997; Stambolic et al., 1998; Sun et al., 1999; Wu et
al., 1998).
2.2.2
Cellular stress from ionizing radiation
The tumor suppressor protein p53 is the main player of the p53-AKT network in the
response to cellular stresses. Short-lived in unperturbed cells, p53 protein level and
activities are upregulated by post-translation modifications (rather than by
transcription) under diverse cellular stresses such as hypoxia, oncogene activation,
nitric oxide, spindle damage, DNA damage, heat or cold shock, etc. (Harris and
Levine, 2005; Vogelstein et al., 2000). In this thesis, regulation of the p53-AKT
network by cellular stress generated from ionizing radiation is studied.
Ionizing radiation (IR) by gamma or X- rays results in double strands breaks
(DSBs) in the DNA (Rothkamm and Lobrich, 2003). DNA damage signals propagate
rapidly to the p53-AKT network at which they result in the simultaneous posttranslational modifications of p53 and MDM2 proteins (see next section for a
17
description of the DNA damage signal transduction pathway). In the case of p53,
these modifications lead to nucleus translocation, tetramerization, diminished binding
affinity to MDM2 and activation of transcriptional activity (Stommel et al., 1999;
Chene, 2001; Shieh et al., 1997). As a result, the level of transcriptionally active p53
is upregulated in the nucleus where it induces expression of PTEN (to inhibit the
PI3K/AKT survival pathway) as well as specific genes that impinges on cell cycle
arrest, DNA repair and/or apoptosis (Levine, 1997). Modified MDM2, on the other
hand, has attenuated binding affinity to p53, which impedes its ability to ubiquitinate
p53. Unexpectedly, under this circumstance, MDM2 ubiquitinates itself, resulting in
a short half-life (Stommel and Wahl, 2004). These post-translational modifications
on the p53-MDM2 negative feedback loop have been cited as a reason for the
observed oscillations in p53 and MDM2 protein levels (Lev Bar-Or et al., 2000;
Lahav et al., 2004) in human breast cancer epithelial MCF-7 cells; IR induced DNA
damage also results in p53-dependent upregulation of PTEN mRNA in MCF-7 cells
(Tang and Eng, 2006a; Tang and Eng, 2006b). The biological implications of p53
oscillations are studied in detail in Chapter 5.
2.3 DNA damage signal transduction pathways
Upon exposure to IR, the major cellular events occurs generally in the following
sequence: formation and detection of DSBs, transmission of DNA damage signal by
transduction pathways and finally, cellular outcomes such as cell cycle arrest, damage
repair and apoptosis executed by downstream effectors (Rouse and Jackson, 2002;
Norbury and Zhivotovsky, 2004; Zhou and Elledge, 2000). The biochemical and
18
biophysical mechanisms of these events are however far from being completely
elucidated (McGowan and Russell, 2004; Durocher and Jackson, 2001; Zhou and
Elledge, 2000). Despite that, existing notion of the DNA damage signal transduction
pathways regulating post-translation modifications of p53 and MDM2, which is of
most relevance in this study, is complex (Figure 2-3). In general, the part lists of the
damage signal transduction pathway can be categorized into primary and secondary
transducers.
MDM2
ATM
PP2A
53BP1
BRCA1
DNA-PK ATR
CHK2
WIP1
p53
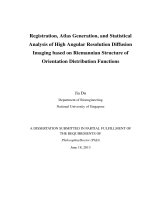
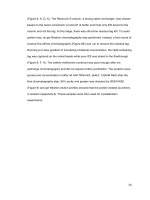
Figure 2-3. DNA damage signal transduction pathways regulating p53 and MDM2.
Signal transduction pathways regulating the activation (arrows) and suppression
(hammerheads) of p53 and MDM2, following IR-induced formation of DSBs. The primary
signal transducers are ATM, ATR and DNA-PK. However, crosstalking among the
secondary signal transducers are prevalent, as indicated by the numerous network edges.
ATM, ATR and DNA-PK kinases are primary transducers, which belong to
the phosphatidylinositol kinase-related kinase family. ATM is present as inactive
dimers in undamaged cells but is rapidly phosphorylated and thereby dissociates into
active monomers in the presence of DSBs (Bakkenist and Kastan, 2003). Active
ATM phosphorylates p53 (Saito et al., 2002; Kapoor et al., 2000), MDM2 (Khosravi
et al., 1999; Stommel and Wahl, 2004), CHK2 (Matsuoka et al., 1998; Ahn et al.,
19
2000), BRCA1 (Cortez et al., 1999), 53BP1 (Fernandez-Capetillo et al., 2000) and
maybe AKT (Fayard et al., 2006; Viniegra et al., 2005).
p53 is stabilized and
activated after being phosphorylated at multiple serine residues (Saito et al., 2002) at
namely, 9, 15 (inhibits binding to MDM2), 20 and 46 (important for apoptotic
activity). On the other hand, ATM-mediated phosphorylation of MDM2 augments
MDM2 auto-ubiquitination (Stommel and Wahl, 2004; Khosravi et al., 1999).
Although ATM is a key signal transducer in DNA damage response, alternate
pathways exist as ATM-null cells still show phosphorylations of p53, MDM2,
BRCA1 and CHK2 albeit with delayed kinetics after IR (Zhou and Elledge, 2000).
For instance, ATR has been implicated in the late phosphorylation of p53 at Serine15
after IR (Tibbetts et al., 1999; Lakin et al., 1999; Hall-Jackson et al., 1999).
Moreover, DNA-PK could bind to DSBs (Zhou and Elledge, 2000; Durocher and
Jackson, 2001) after which it phosphorylates MDM2 at Serine17 (negates binding to
p53) (Stommel and Wahl, 2004; Mayo et al., 1997) and p53 at serine residues at 15,
37, 46 and 392 (Kapoor et al., 2000; Komiyama et al., 2004; Jack et al., 2004; Shieh
et al., 1997). Indeed, DNA-PK deficient cells display delayed and attenuated p53dependent activation of p21 and MDM2 proteins (Kachnic et al., 1999).
Secondary signal transducers are direct downstream substrates of primary
transducers that include CHK2, 53BP1 and BRCA1 (Figure 2-3).
In particular,
CHK2 is a common target of ATM and DNA-PK (Li and Stern, 2005). CHK2 exists
as inactive monomers in unperturbed cells (Ahn et al., 2004) but undergoes multiple
intermolecular phosphorylations especially at Threonine68 following DSBs formation
(Lee and Chung, 2001; Schwarz et al., 2003), after which it dimerizes and becomes
fully activated (Schwarz et al., 2003; Wu and Chen, 2003).
Active CHK2
20
phosphorylates p53 at Serine20 and thereby blocks p53-MDM2 interaction (Caspari,
2000; Hirao et al., 2000; Chehab et al., 2000; Shieh et al., 2000; Takai et al., 2002);
moreover, by cooperating with DNA-PK, CHK2 could also phosphorylates p53 at
Serine15 (Kapoor et al., 2000; Jack et al., 2004). Similarly, BRCA1 phosphorylates
p53 efficiently at Serine15 after activation by ATM (Foray et al., 2003; Fabbro et al.,
2004). 53BP1, on the other hand, is required for p53 accumulation in response to IR
(Wang et al., 2002). Remarkably, crosstalks among the secondary signal transducers
exist. BRCA1 is phosphorylated by CHK2 (Lee et al., 2000) while 53BP1 played a
partially redundant role in phosphorylating BRCA1 and CHK2 (Wang et al., 2002).
Opposing the effects of kinases are de-phosphorylating enzymes called
phosphatases such as PP2A and WIP1 that extinguish the DNA damage signals by
deactivating CHK2 and p53 (Figure 2-3).
PP2A dephosphorylates CHK2 at
Threonine68 (Liang et al., 2006), which prevents currently inactive CHK2 from being
activated, but has no effect on currently active CHK2. In addition, active CHK2 is
dephosphorylated by WIP1 at Threonine68, Serine516 and Serine33 (Oliva-Trastoy et
al., 2007). Interestingly, WIP1 is involved in a negative feedback loop with p53, i.e.,
p53 activates WIP1 transcription (Fiscella et al., 1997) whereas WIP1
dephosphorylates p53 at Serine15 (Lu et al., 2005).
Clearly, there are redundancies in the DNA damage signal transduction
pathways that underscore the importance of rapid and appropriate response to DNA
damage; accurate transmission of genetic information to daughter cells is a basic
requirement for the survival of multi-cellular organisms (Zhou and Elledge, 2000).
Nevertheless, not all of the pathways may be simultaneously active and their relative
21
contributions in the post-translational modifications of p53 and MDM2 proteins could
depend on cell lines and extent of DNA damage.
2.4 Programmed cell death
There are broadly two types of cell deaths – programmed cell death (PCD) and
necrosis (Fiers et al., 1999). Unlike necrosis, PCD is mediated by specialized and
complex biochemical pathways that degrade remnants of a death cell cleanly, and
thereby prevents unnecessary immune response. PCD or apoptosis is thus the default
mode of removing unwanted cells. PCD is further classified into caspase-dependent
and caspase-independent apoptosis (Lawen, 2003; Hengartner, 2000). In the former,
a family of proteases termed executioner caspases (cysteine-containing aspartatespecific proteases) executes apoptosis by cleaving numerous specific cellular
substrates at aspartate residue sites (Kumar, 2007; Timmer and Salvesen, 2007;
Nicholson, 1999).
Dormant in surviving cells, caspases must be processed (by
irreversible removal of a peptide sequence from the protein) to activate their apoptotic
activities. However, once intracellular threshold quantities of caspases are activated,
a point of no return is reached whereby a cell commits irrevocable to death. Caspaseindependent apoptosis (Borner and Monney, 1999; Kitanaka and Kuchino, 1999), on
the other hand, is comparatively less well studied and prevalent partly because it is
induced in circumstances under which there is insufficient cellular resource (such as
ATP) to activate the default caspase-mediated apoptotic pathways. This section gives
an overview of the caspase-dependent pathways since they are impinged extensively
by both p53 and AKT.
22
2.4.1
Caspase-dependent apoptotic pathways
As depicted in Figure 2-4, caspases are activated via the extrinsic and intrinsic
apoptotic pathways. These pathways are activated by myriad stimulations such as UV
or gamma radiation, chemotherapeutic drugs, growth factor withdrawal, and upregulation of oncogenes (Jin and El-Deiry, 2005).
The extrinsic pathway (see reviews: Jin and El-Deiry, 2005; Lawen, 2003) is
initiated through death receptors such as FAS (APO-1/CD95), TNF, DR3 (TRAMP),
DR4 (TRAIL-R1), and DR5 (TRAIL-R2). Among them, part lists of FAS-mediated
pathway are well characterized. Upon binding of its native ligand (FASL), FAS selfoligomerizes which then recruits FADD adaptor proteins to its cytoplasmic domains,
forming DISC (Death Inducing Signaling Complex). The main function of DISC is to
recruit multiple PROCASPASE-8 molecules to close proximity so as to induce
mutual cleaving of their protein peptides (Muzio et al., 1998). This processing step
produces one of the initiator caspases, CASPASE-8. DISC could activate another
initiator caspase, CASPASE-10, by this similar mechanism. Remarkably, a positive
feedback loop exists between these two initiator caspases in which they undergo
mutual activation, thus amplifying the death signal (Sprick et al., 2002; Wang et al.,
2001). Subsequently, CASPASE-8 cleaves PROCASPASE-3 and PROCASPASE-7
to form two of the respective executioner caspases, CASPASE-3 and CASPASE-7
while CASPASE-10 cleaves PROCASPASE-3 only.
23
INTRINSIC
EXTRINSIC
ligands
mitochondria
receptors
cell membrane
DISC
CYTOCHROME C
tBID
FADD
APAF-1
APOPTOSOME
BID
PROCASPASE-9
PROCASPASE-8, -10
CASPASE-8, -10
CASPASE-9
PROCASPASE-3, -6, -7
CASPASE-3, -6, -7
Cell Death
Figure 2-4. Major steps of the intrinsic and extrinsic caspase-dependent apoptotic
pathways.
The main function of the intrinsic (left panel) and extrinsic (right panel) pathways is to
activate the executioner caspases, CASPASE-3, -6 and -7, the key proteins to carry out the
cell death processes (the figure is adapted from Zheng and Flavell, 2000 with permission from
Nature Publishing Group). Interestingly, both pathways share similar network structure,
which involves the formation of a complex for recruiting and activating initiator caspases
(CASPASE-8, -9 and -10). Subsequently, initiator caspases of the two pathways activate the
executioner caspases. Interestingly, the extrinsic pathway impinges on the intrinsic pathway
through BID (see text for details).
The intrinsic pathway (see reviews: Jin and El-Deiry, 2005; Lawen, 2003),
also called the mitochondria pathway, requires the release of CYTOCHROME C from
the mitochondria to the cytoplasm (Garrido et al., 2006) where it forms a high
molecular weight complex called the APOPTOSOME with APAF-1 and ATP.
APOPTOSOME mainly recruits and activates PROCASPASE-9 to produce another
24
initiator caspase, CASPASE-9 (Bao and Shi, 2007). Similarly, CASPASE-9 activates
several executioner caspases, including CASPASE-3 and CASPASE-7, which
converges with the extrinsic pathway. Interestingly, the extrinsic pathway activates
the intrinsic pathway via the apoptotic BID protein (Wang et al., 1996; Gross et al.,
1999b). CASPASE-8 of the extrinsic pathway cleaves BID to form tBID, which then
translocates
to
the
mitochondria
membrane
to
promote
the
release
of
CYTOCHROME C (Li et al., 1998; Grinberg et al., 2002).
Because apoptosis leads to death, its tight regulation is critical. Indeed, to
prevent untimely cell death, two general mechanisms to quench the apoptotic signals
are inherent in the pathways, as described in the following paragraphs.
The first mechanism inhibits the activation of caspases.
In the extrinsic
pathway, c-FLIP competes with PROCASPASE-8 to bind to DISC and prevents the
processing of PROCASPASE-8 (edges 1 and 2 of Figure 2-5) (Irmler et al., 1997). In
the intrinsic pathway, the BCL2 protein family is the chief regulator of the release of
CYTOCHROME C from the mitochondria (Cory and Adams, 2002; Gross et al.,
1999a). The anti-apoptotic members, BCL-2 and BCL-XL, protect the mitochondria
membrane potential and thus inhibit the release of CYTOCHROME C (edge 3)
(Schwartz and Hockenbery, 2006). They are however antagonized through direct
binding of their pro-apoptotic counterparts (edges 4 and 5; BAD, BAX, BID, BIM,
BAK, NOXA and PUMA) (Fletcher and Huang, 2006). The relative abundance of the
anti-apoptotic and pro-apoptotic members has been proposed as the tipping point
between cell survival and death (Walensky, 2006).
25
FASL
DISC
1
2
c-FLIPS
BAD
BAX
BIM
BAK
NOXA
PUMA
c-FLIPL
13
C10
C8
14
19
24
16
23
15
tBID
18
6
C3
IAPs
8
4
C7
BCL-2
7
17
5
25
BCL-XL
C6
20
21
CYTOCHROME C
IAPs
C9
3
C2 22
DIABLO
OMI
12
SURVIVIN
9
10
APOPTOSOME
11
IAPs
Figure 2-5. Regulatory points of the caspase-dependent apoptotic pathways.
Proteins that are involved in the quenching of the apoptotic signal are indicated in gray.
Arrowheads denote activation whereas hammerheads denote inhibition. The extrinsic
pathway is shown in yellow background the intrinsic pathway is shown in blue background.
Additionally, the regulatory points of p53 and AKT proteins are indicated respectively in red
and blue edges (see Section 2.4.2). Note: the caspases are abbreviated as “C”, e.g., C3
denotes CASPASE-3.
The second quenching mechanism degrades activated caspases. Activated
caspases are antagonized by various members of the anti-apoptotic IAP family such as
XIAP, c-IAP, IAP-1 and IAP-2, in which they bind to caspases such as CASPASE-3
(edges 6 and 7), CASPASE-7 (edge 8) and CASPASE-9 (edge 9) and target them for
ubiquitin-mediated degradation (Deveraux and Reed, 1999; Salvesen and Duckett,
2002).
The anti-apoptotic activities of IAPs are in turned antagonized by pro26
apoptotic DIABLO (SMAC) and OMI (HTRA2) proteins that are released from the
mitochondria (Verhagen et al., 2000; Liu et al., 2000; Wu et al., 2000; Hu et al.,
2003; Suzuki et al., 2001; Yang et al., 2003; van Loo et al., 2002). Notably, binding
of IAPs to DIABLO/OMI inhibits both of their biochemical activities, thus forming a
mutual antagonism feedback loop (edges 10 and 11).
In addition, pro-apoptotic
DIABLO and OMI proteins are in turned antagonized by anti-apoptotic SURVIVIN
protein (edge 12) (Ambrosini et al., 1997; Li et al., 1998).
Therefore, these
antagonistic feedback loops negate erroneous activation of caspase cascades caused
by random spike in the apoptotic signal.
Conversely, to commit irrevocably to cell death, several mechanisms for
amplifying the apoptotic signals exist.
Of utmost significance is the caspase
activation cascade, which is characterized by mutual activations among executioner
and initiator caspases (Budihardjo et al., 1999; Earnshaw et al., 1999; Shi, 2002).
These positive feedback loops result in rapid upregulation of executioner caspases; at
least five such loops are elucidated (edges 13 and 14; edges 15 and 16; edges 15, 17
and 18; edges 19, 16 and 14; edges 20 and 21). Moreover, active caspases further
upregulate the activation of more caspases by inducing the release of
CYTOCHROME C through the formation of tBID and inhibition of anti-apoptotic
BCL-2 protein (edges 22 to 25).
In summary, the perplexing interactions among disparate anti-apoptotic and
pro-apoptotic proteins underscore the importance of timely regulation of cell survival
and death in the response to myriad survival and/or death signals.
27
2.5 Regulation of apoptosis by the p53-AKT network
Remarkably, as depicted in Figure 2-5, p53 (red edges) and AKT (blue edges)
impinge extensively on the extrinsic and intrinsic apoptotic pathways; the regulatory
targets of p53 and AKT are summarized in Figure 2-6.
p53 induces apoptosis
primarily by expressing pro-apoptotic gene targets such as CASPASE-6 (MacLachlan
and El-Deiry, 2002), FAS (Owen-Schaub et al., 1995; Sheard et al., 1997; Lin et al.,
2002), APAF-1 (Fortin et al., 2001; Rozenfeld-Granot et al., 2002; Ho et al., 2003),
DR5 (Takimoto and El-Deiry, 2000) and pro-apoptotic members of the BCL2 family
encompassing BAX (Miyashita and Reed, 1995), BID (Sax et al., 2002), BAD (Jiang
et al., 2006), BAK (Pohl et al., 1999), NOXA (Oda et al., 2000; Seo et al., 2003) and
PUMA (Nakano and Vousden, 2001); PUMA could stabilize p53, which completes a
positive p53-PUMA feedback loop (Chipuk et al., 2005). In addition, p53 could also
promote apoptosis through transcription-independent mechanisms.
For instance,
expression of pro-survival BCL-2 gene is repressed by p53 (Hemann and Lowe, 2006;
Miyashita et al., 1994). When localized in the cytoplasm or mitochondria membrane,
p53 binds and inhibits pro-survival BCL-2 and BCL-XL proteins (Mihara et al.,
2003), while on the other hand, binds and activates pro-apoptotic BAK (Leu et al.,
2004) and BAX (Chipuk et al., 2004) proteins.
28
PUMA
p53
A1
BCL-XL
IAPs
XIAP
c-FLIP
NF-κB
CREB
AKT
BCL-2
BCL-2
BCL-XL
APAF-1
BAK
BAX
BID
CASPASE-6
DR5
FAS
NOXA
BAD
CASPASE-9
FOXO
OMI
BCL-6
BIM
FASL
Figure 2-6. Regulatory targets of p53 and AKT.
p53 and AKT targets of the caspase-dependent apoptotic pathway are shown. Pro-apoptotic
targets are shown in red while pro-survival targets are shown in blue. Arrowheads denote
activation or upregulation whereas hammerheads denote inhibition or downregulation.
AKT promotes cell survival primarily by phosphorylating pro-apoptotic and
pro-survival substrates. For the former, AKT-mediated phosphorylation inhibits proapoptotic proteins such as CASPASE-9 (Cardone et al., 1998; Fujita et al., 1999),
OMI (Yang et al., 2007), BAD (del Peso et al., 1997; Datta et al., 1997) and FOXO
(Brunet et al., 1999; Kops et al., 1999). Phosphorylated CASPASE-9 and OMI
cannot bind to their substrates for cleaving whereas phosphorylated BAD cannot bind
and antagonizes pro-survival BCL-XL protein, and is subsequently sequestered by 143-3 chaperone protein (Datta et al., 2000).
Phosphorylated FOXO is unable to
express pro-apoptotic genes such as FASL, BIM and BCL-6 after DNA damage (van
der Horst and Burgering, 2007), and is exported out of the nucleus for degradation
(Biggs et al., 1999). In contrast, AKT-mediated phosphorylation activates prosurvival proteins such as XIAP (Dan et al., 2004), NF-κB (Ozes et al., 1999;
Romashkova and Makarov, 1999) and CREB (Du et al., 1998). Phosphorylated XIAP
has reduced susceptibility to ubiquitin-mediated degradation while phosphorylated
NF-κB and CREB can express pro-survival genes – NF-κB expresses BCL-XL (Chen
29
et al., 2000), A1 (BFL-1, a pro-survival member of the BCL2 family) (Zong et al.,
1999) and several IAPs (Chu et al., 1997) and CREB expresses BCL-2 (Riccio et al.,
1999). Lastly, through unknown mechanisms, AKT upregulates c-FLIP (Uriarte et
al., 2005; Skurk et al., 2004; Plate, 2004; Suhara et al., 2001), which inhibits the
activation of initiator caspase of the extrinsic pathway.
2.6 Review of apoptotic mathematical models
Various aspects of the caspase-dependent apoptotic pathways have been described in
mathematical models. A common goal in these models is to identify and study the
origin of the apoptotic thresholds.
Elucidating the biochemical or biophysical
mechanisms governing the apoptotic threshold is an important biological problem as
experimental observations suggest the presence of apoptotic thresholds. In particular,
induction of cell death does not follow a graded response, in other words, a minimum
threshold amount of apoptotic stimulus is required to induce apoptosis. Generally, the
models analyze specific sub-networks of the entire apoptosis pathway and they can be
grouped into two distinct classes based on their key predictions.
The first class of models predicts the existence of bistability (two steady
states) between cell-survival and cell-death steady states as the origin of a cellular
apoptotic threshold.
Possible causes of bistability have been proposed: positive
feedback loops between CASPASE-3 and CASPASE-9 (edges 20 and 21 in Figure 25) (Legewie et al., 2006), CASPASE-3 and CASPASE-8 (edges 15 and 16 in Figure
2-5) (Eissing et al., 2004, 2005), and a hypothesized kinetic cooperativity in the
30
formation of the APOPTOSOME complex (see Figure 2-4) (Bagci et al., 2006). On
the other hand, in the second class of models, the initial amount of pro-survival
proteins is predicted to set the apoptotic threshold (Stucki and Simon, 2005; Bentele
et al., 2004; Hua et al., 2005, Aldridge et al., 2006; Fussenegger et al., 2000). For
instance, quenching of IAPs is a minimum threshold to overcome to induce cell death
(Stucki and Simon, 2005). In addition, modeling and experimental studies show that
the quantity of c-FLIP, an inhibitor of DISC, sets the main apoptotic threshold in
Type I cells (apoptosis occurs predominantly via the extrinsic or DISC pathway,
Figure 2-4) (Bentele et al., 2004) whereas the balance of BCL2 protein family among
its pro-survival and pro-apoptotic members sets the apoptotic threshold in Type II
cells (apoptosis occurs predominantly via the intrinsic or APOPTOSOME pathway,
Figure 2-4) (Hua et al., 2005).
Nevertheless, these models do not study known regulatory pathways upstream
of the apoptotic pathways that could impinge on the apoptotic thresholds. Despite the
many regulatory points at which p53 and AKT act upon the apoptotic pathway
(Figures 2-5 and 2-6), it is somewhat surprising that no modeling study has been
performed to analyze the p53-AKT network. Therefore, Part I of this thesis aims to
analyze this particular network in detail. Interestingly, the p53-AKT models also
predict the existence of bistability.
This thesis however, does not focus on the
detailed analysis of the apoptotic pathways.
31