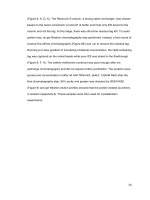
Mathematical and computational analysis of intracelluar dynamics 7
Bạn đang xem bản rút gọn của tài liệu. Xem và tải ngay bản đầy đủ của tài liệu tại đây (223.72 KB, 26 trang )
Chapter 7
Analysis of the Dynamics of Co-transcriptional
Binding Accessibility of AON Target Sites
In this chapter, dynamics of the co-transcriptional binding accessibility of previously
published AON target sites are analyzed, and correlated with the degree of reported
efficiency in the induction of exon skipping.
7.1 Overview of the analysis methodology
The analysis carried out in this chapter involves the following sequential steps:
1. Data collection (Section 7.2). Previously published AONs whose efficiency in the
induction of selective exon skipping in the dystrophin pre-mRNA has been tested
in wet experiments are gathered; only AONs that target ESE sites are included.
They are then graded according to their reported efficiencies.
2. Prediction of the co-transcriptional secondary structures of exons (Section 7.3).
A model to approximate transcription is used to predict the co-transcriptional
secondary structures of exons, which are targeted by the AONs gathered in step 1.
3. Analysis of the dynamics of the co-transcriptional binding accessibility (Sections
7.4 and 7.5). The co-transcriptional binding accessibility of each nucleotide
within an AON target site is determined based on whether it is paired in the
predicted co-transcriptional secondary structures obtained in step 2.
Several
131
novel scoring systems are formulated to quantify the dynamics of the cotranscriptional binding accessibility.
4. Test for correlation between reported AON efficiencies in inducing exon skipping
with their co-transcriptional binding accessibility (Sections 7.4 and 7.5). The
scores (formulated in step 3) in each grade of AONs are tested for statistical
differences and significances against other grades using two-sample KolmogorovSmirnov (K-S) test; each grade of AONs has distinct reported efficiencies. All
statistical tests are performed using the statistical software, R Version 2.0.0
().
Note: throughout the thesis, “efficacy” is used to describe qualitatively the ability of
an AON to induce selective exon skipping whereas “efficiency” is used to quantify
the percentage of total mRNA molecules whose selected exon is skipped by an AON.
7.2 Data set for analysis
A total of 176 AONs, reported by two independent sources Aartsma-Rus et al. (2005)
and Wilton et al. (2007), that target ESEs to induce the skipping of 67 exons in
dystrophin pre-mRNA was analyzed.
Although the cell lines and experimental
protocols used in these two studies were similar, the AONs from each study were
analyzed separately because of the following reasons. The range of AON lengths,
which may influence AON performance (Harding et al., 2007), differed significantly
between the studies. The AONs from the two sources Aartsma-Rus et al. (2005) and
Wilton et al. (2007) showed median lengths of 19 and 26 nucleotides respectively,
and for the purpose of this study, are henceforth denoted as Set A and Set B
132
respectively. Note that only 62 out of the 82 AONs reported by Wilton et al. (2007)
are included in Set B, as the remaining ones either target non-ESE sites or result in
unspecific exon skipping.
Secondly, as breakdown in Table 7-1, the respective
sources graded their AONs differently according to their efficiencies in inducing exon
skipping; AON efficiency was calculated based on densitograph semi-quantification
in the two publications.
Table 7-1. Classification of published AON (antisense oligonucleotides) sequences.
Published AONs from two independent sources are denoted as Set A and B respectively. In
each set, AONs are classified into different grades according to their efficiencies (E) in the
induction of exon skipping.
Set A
Number of AONs
Set B
Number of AONs
Grade (++)
E ≥ 25%
41
Grade (++)
E ≥ 30%
35
7.3 Prediction
of
Grade (+)
0% < E < 25%
35
Grade (+ 1)
10% ≤ E < 30%
11
Grade (–)
E = 0%
38
Grade (+ 2)
0% < E < 10%
9
co-transcriptional
Total
114
Grade (–)
E = 0%
7
Total
62
secondary
structures of exons
The co-transcriptional secondary structures of exons are requisite to determine the
co-transcriptional binding accessibility of each AON target site. Computational tools
are used to predict these secondary structures, as current experimental means to
determine them is unavailable. While computer algorithms that consider the mRNA
secondary structure folding paths during transcription are available (Isambert and
Siggia, 2000; Gultyaev et al., 1995), computational time is tractable only for
sequences up to 400 nucleotides, which is too short for the use in this study.
133
Alternatively, algorithms that could efficiently predict a long fully synthesized mRNA
are considered (Zuker, 2003; Knudsen and Hein, 2003; Ding and Lawrence, 2003;
Flamm et al., 2000). Among them is mfold (Zuker, 2003), which is chosen in this
study because firstly it has a relatively high average prediction accuracy of 70%
(Mathews et al., 1999) and secondly, it has the advantage of being used in most
published experimental work on AONs that target the dystrophin gene (Aartsma-Rus
et al., 2002, 2005; Errington et al., 2003) and, therefore, results of this study can be
compared with them on a common basis.
AON target site
intron
intron
Direction of
pre-mRNA elongation
exon
1500 nt
1st
step of transcriptional analysis
5’
3’
2nd step of transcriptional analysis
3rd step of transcriptional analysis
1 nt
Last step of transcriptional analysis
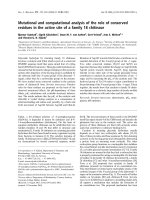
Figure 7-1. A model to approximate transcription elongation.
To approximate the transcription elongation process, a “window of analysis” is shifted one
nucleotide at a time along the pre-mRNA sequence towards the 3” end. At the first window,
its 3’ end coincides with the 3’ end of the target exon. Correspondingly, at the last window,
its 5’ end coincides with the 5’ end of the target exon. Each window of analysis corresponds
to a step of transcriptional analysis at which the possible secondary structures of its sequence
were predicted.
134
As mfold does not consider folding paths, they are approximated using the
model depicted in Figure 7-1. A “window of analysis” of pre-determined sequence
length of 1500 nucleotides that includes the full length of the targeted exon
corresponds to a “step of transcriptional analysis”. To approximate the transcription
elongation process, the window of analysis is shifted one nucleotide at a time along
the pre-mRNA sequence towards the 3’ end. At each step of transcriptional analysis,
the possible secondary structures for the window sequence are predicted using mfold
version 3.1 (Zuker, 2003; Mathews et al., 1999). Since it is highly probable that the
nascent pre-mRNA may not have the chance to assume optimal secondary structures,
sub-optimal secondary structures whose energies lie within 5% of the optimum are
considered. On average, 44,582 secondary structures are predicted per exon of which
24 to 47 secondary structures are predicted in each step of transcriptional analysis;
number of secondary structures predicted in the 79 exons is given in Appendix A-17.
Note that the model considers only the local secondary structures around the
target exon.
As abundant hnRNPs (heterogeneous nuclear ribonuclear proteins)
package long introns into compact secondary structures that deterred long-distance or
global intra-molecular complementary base pairings (Alberts et al., 2002), this
assumption is justified given that long introns are typical in dystrophin gene (Figure
6-1 of Chapter 6). On the other hand, the 1500 nucleotides length of the window of
analysis is estimated from experimental measurements. It has been reported that the
3’ splice site is recognized 48 seconds after it is transcribed (Beyer and Osheim,
1988). Based on the measured elongation rate of dystrophin pre-mRNA at 1700 to
2500 nucleotides per minute (Tennyson et al., 1995), about 1360 to 2000 nucleotides
would be appended to the nascent transcript during this period. Nevertheless, co-
135
transcriptional secondary structures of exons 2 (62 bp), 29 (150 bp) and 59 (269 bp)
were also predicted with lengths of window of analysis of 1200 and 2000 nucleotides,
but however, no statistical differences in their co-transcriptional secondary structures
are detected (data not shown).
7.4 Analysis of the dynamics of co-transcriptional
binding accessibility of AON target sites
Four levels of analysis using scoring methodologies of increasing complexity are used
to score the binding accessibility of AON target sites in the 2 sets of published AONs.
Scores at each level of analysis were then correlated with the degree of reported AON
efficiency and efficacy for each set of AONs. Note that these scoring methodologies
are applicable for any secondary structure prediction tools, as long as cotranscriptional secondary structures of AON target sites can be generated.
7.4.1
First level analysis
At this simplest level of analysis, the binding accessibility score of an AON target site
(L1) is computed.
To do so however, the binding accessibility score of each
nucleotide within the AON target site is needed, and is determined by this ratio:
Number of predicted secondary structures in which the nucleotide is unpaired
Total number of secondary structures predicted
136
Note: all secondary structures predicted at every step of transcriptional analysis
(Figure 7-1) are included in the calculation; a nucleotide is “unpaired” when it does
not form complementary base pairing with another nucleotide within the pre-mRNA.
Thus, the accessibility score for the AON target site, L1 is:
Sum of nucleotide accessibility scores for all nucleotides within the AON target site
Total number of nucleotides in AON target site
The L1 scores for each AON target site analyzed are tabulated in Appendix A18.
Two-sample Kolmogorov-Smirnov (K-S) test is used to test for statistical
differences and significances of the L1 scores for target sites between any two AON
grades of the same set. Table 7-2 tabulates the p-values for the statistical tests. To
ensure consistent test outcomes, two exclusive one-tailed tests, i.e., Ho: 1st < 2nd and
Ho: 1st > 2nd (columns 2 and 3) are performed for each test case (as described in
column one).
For instance, for the test case (++ versus –) of Set A, the null
hypothesis, Ho: 1st < 2nd tests for whether L1 scores for target sites in (++) AONs are
smaller than those in (–) AONs. The null hypothesis is true and accepted if p-value <
0.05, or is rejected if otherwise. Thus, the test outcomes in a particular test case are
inconsistent if the null hypotheses of the two tests are both true.
137
Table 7-2. p-values for K-S tests using the first level score (L1).
p-values (columns 2 and 3) of the K-S tests for the target sites of AONs in (A) Set A and (B)
Set B. Statistically significant p-values are indicated in bold and underlined. Column 1
describes the test case. The last column indicates whether the particular test case tests for
AON efficacy and/or efficiency. In (B), (+ 1,2) denotes AONs merged from (+ 1) and (+ 2)
AONs. Note: Wilcoxon rank-sum test cannot be used as one of its key assumptions is
violated, i.e., distributions of each AON grade’s L1 scores are distinct (box plots not shown).
A
Test case:
1st vs. 2nd
Ho :
H o:
1st < 2nd 1st > 2nd
0.21
0.97
(++) vs. (–)
0.41
0.94
(+) vs. (–)
0.99
(++, +) vs. (–) 0.42
0.44
0.57
(++) vs. (+)
0.85
(++) vs. (+, –) 0.21
Test
for
Efficacy
Efficacy
Efficacy
Efficiency
Both
B
Test case:
1st vs. 2nd
Ho :
Ho :
1st < 2nd 1st > 2nd
1
0.032
(++) vs. (–)
0.93
0.037
(+1, 2) vs. (–)
0.023
(++, +1, 2) vs. (–) 0.99
0.92
0.036
(+1) vs. (–)
0.97
0.076
(+2) vs. (–)
0.90
0.44
(++) vs. (+1, 2)
0.90
0.55
(++) vs. (+1)
0.68
0.45
(++) vs. (+2)
0.61
0.82
(+1) vs. (+2)
0.38
(++) vs. (+1, 2, –) 0.96
Test
for
Efficacy
Efficacy
Efficacy
Efficacy
Efficacy
Efficiency
Efficiency
Efficiency
Efficiency
Both
For AONs in Set A, L1 scores for target sites in each grade of AONs do not
show any statistical difference (Table 7-2A), which agrees with the results reported by
Aartsma-Rus et al. (2005) and Harding et al. (2007). For AONs in Set B, L1 scores
for target sites of (++) and (+ 1) AONs are statistically higher that those of (–) AONs;
their p-values are highlighted in Table 7-2B. This result indicates that (++) and (+ 1)
AON target sites are more accessible than (–) AON target sites, and therefore, the L1
score could correlate with AON efficacy for Set B AONs.
7.4.2
Second level analysis
At this level of analysis, the nucleotide accessibility scores of every nucleotide in an
AON target site were screened to determine the presence of two or more scores with
values below 0.1 occurring consecutively in the nucleotide sequence of the target site
138
(Figure 7-2). Such grouping of below 0.1 nucleotide accessibility scores is termed a
“low accessibility cluster”; refer to Table S3 of Wee et al. (2008a) (attached in
Appendix A-1) for the list of low accessibility clusters manifested in all the analyzed
AONs. In Set A, 71% of target sites of (–) AONs had one or more low accessibility
clusters. While only 17% of target sites of (+) AONs had one or more clusters, they
were manifested in 52% of target sites of (++) AONs. Set B also exhibited similar
trends: 71%, 70% and 80% of target sites of (–) AONs, (+) AONs and (++) AONs
respectively had one or more clusters. Therefore, the presence of these clusters in the
AON target sites cannot correlate with AON efficacy and efficiency.
h43AON5 (++)
h46AON4 (+)
h48AON1 (–)
1
1
1
0.9
0.9
0.9
0.8
0.8
0.8
0.7
0.7
0.7
0.6
0.6
0.6
0.5
0.5
0.5
0.4
0.4
0.4
0.3
0.3
0.3
0.2
0.2
0.2
0.1
0.1
0
0
90
92
94
96
98
100
102
104
106
108
0.1
0
63
64
65
66
67
68
69
70
71
72
73
74
75
76
77
19
20
21
22
23
24
25
26
27
28
29
30
31
32
33
34
Figure 7-2. Nucleotide accessibility scores of all the nucleotide in three representative
AON target sites are depicted.
In each plot, the horizontal axis represents the nucleotide position in the respective target
exon and the nucleotide accessibility score is plotted on the vertical axis. The low
accessibility clusters are indicated in red.
7.4.3
Third level analysis
The nucleotide accessibility scores at the first and second levels of analysis are mean
scores. As a result, two nucleotides with identical accessibility scores may have
markedly different numbers of unpaired predicted secondary structures at each step of
transcriptional analysis.
In analyzing accessibility for AON binding, it may be
139
important to take into account steps of transcriptional analysis in which a nucleotide is
predicted to have total absence of unpaired secondary structures, i.e. the nucleotide is
predicted to be completely inaccessible or “engaged” at the particular step of
transcriptional analysis, as illustrated in Figure 7-3B. For the purpose of analysis, at
every step of transcriptional analysis, each nucleotide in the AON target site that is
engaged may then be depicted in a plot as illustrated in Figure 7-4. Table S4 of Wee
et al. (2008a) (attached in Appendix A-1) tabulates these plots for all the AON target
sites analyzed.
140
Figure 7-3. Schematic illustration of an engaged nucleotide.
(A) – (C). Schematic multiple secondary structures of the targeted exon (drawn in black) are
predicted in each step of transcriptional analysis, with some of the possible structural motifs
shown here. For illustration purpose, a particular nucleotide (marked in red) within an AON
target site (green line) is tracked. When this nucleotide is paired (denoted with *), it is not
accessible for AON binding. If this nucleotide is paired in all predicted secondary structures,
this nucleotide is defined as an engaged nucleotide at this particular step of transcriptional
analysis (B).
3’ end of
AON target
site
Aw ay from
ends of
AON target
site
L4_OR
L4_AND
5’ end of
AON target
site
Sequential steps of transcriptional analysis
Figure 7-4. Schematic plot depicting the incidences of engaged nucleotides.
In the above illustration, the horizontal axis denotes sequential steps of transcriptional
analysis while the vertical axis denotes numbered nucleotides within the AON target site. At
each step of transcriptional analysis, nucleotides in the target site that are engaged are
depicted as a black dot in the plot. The calculations of the fourth level scores, L4_OR and
L4_AND, are illustrated (refer to Section 7.5 for details).
For each nucleotide in an AON target site, a nucleotide engaged score is defined as:
Total number of steps of transcriptional analysis at which the nucleotide is engaged
Total number of steps of transcriptional analysis
Following this, an AON target site engaged score (L3) is defined as:
Sum of nucleotide engaged scores for all nucleotides within the AON target site
Total number of nucleotides in AON target site
141
In contrast to L1 score, the higher the L3 score, the less accessible a target site is for
AON binding. Appendix A-18 tabulates the L3 scores for all the AONs analyzed.
For Set A AONs, target sites of (++) AONs have statistically lower engaged
scores than target sites of both (–) and (+) AONs (Table 7-3A). Therefore, L3 score
can statistically differentiate both AON efficacy and efficiency. However, seven
outlier AONs (6% of total AONs) are identified. In this context, these are AONs in
which the target site L3 scores contradict their AON grades. For instance, target sites
of h52AON2 and h60AON2 graded as (─) could not induce exon skipping although
their L3 scores are below the 5th-percentile of L3 scores of (++) AON target sites
(Appendix A-18). On the other hand, target sites of h45AON5 and h46AON4 graded
as (+) and target sites of h51AON29, h55AON5 and h77AON2 graded as (++) all
have L3 scores higher than the 95th-percentile of L3 scores of (─) AON target sites
(Appendix A-18) but could still induce exon skipping. The omission of these outlier
AONs strengthen the correlation of L3 scores with AON efficacy and efficiency
(Table 7-3A).
For Set B AONs, target sites of (++) AONs have statistically lower engaged
scores than target sites of (–) AONs (Table 7-3B). Upon omission of four outlier
AONs (6% of total AONs, i.e., H30A, H58A, H64A and H34A2), L3 scores can
statistically differentiate efficacy between (+ 1) and (–) AONs, and efficiency between
(++) and (+ 2) AONs. Overall, L3 scores correlate efficacies and efficiencies of (++),
(+) and (+ 1) AONs better than L1 scores (Table 7-2B versus Table 7-3B): L3 scores
can differentiate between more AON grades than L1 scores; and for K-S tests in
142
which L1 scores show statistical significance, the corresponding K-S tests of L3 score
achieve even lower p-values
Table 7-3. p-values for K-S tests using the third level score (L3).
p-values (with outliers: columns 2 and 3; without outliers: columns 4 and 5) of the K-S tests
for the target sites of AONs in (A) Set A and (B) Set B. Statistically significant p-values are
indicated in bold and underlined. Column 1 describes the test case. The last column indicates
whether the particular test case tests for AON efficacy and/or efficiency. In (B), (+ 1,2)
denotes AONs merged from (+ 1) and (+ 2) AONs. Note: Wilcoxon rank-sum test cannot be
used as one of its key assumptions is violated, i.e., distributions of each AON grade’s L3
scores are distinct (box plots not shown).
A
B
With outliers
Without outliers
Ho :
H o:
Ho :
Ho :
1st < 2nd 1st > 2nd 1st < 2nd 1st > 2nd
0.81
1
0.030
0.0044
(++) vs. (–)
0.92
0.28
0.67
0.51
(+) vs. (–)
0.49
0.10
0.85
(++, +) vs. (–) 0.35
0.82
0.98
0.0014
(++) vs. (+) 0.0025
0.76
1
0.00063
(++) vs. (+, –) 0.0035
Test case:
1st vs. 2nd
With outliers
Without outliers
Ho :
Ho :
Ho :
Ho :
1st < 2nd 1st > 2nd 1st < 2nd 1st > 2nd
0.92
1
0.032
0.011
(++) vs. (–)
0.060
0.81
0.97
0.035
(+1, 2) vs. (–)
0.87
1
0.011
(++, +1, 2) vs. (–) 0.029
1
0.061
0.84
1
0.032
(+ ) vs. (–)
2
0.19
0.72
0.17
0.49
(+ ) vs. (–)
0.31
0.95
0.14
1
(++) vs. (+1, 2)
1
0.32
0.96
0.27
0.99
(++) vs. (+ )
0.23
0.77
1
0.027
(++) vs. (+2)
0.59
0.61
0.17
0.99
(+1) vs. (+2)
0.98
0.057
1
(++) vs. (+1, 2, –) 0.18
Test case:
1st vs. 2nd
Test
For
Efficacy
Efficacy
Efficacy
Efficacy
Efficacy
Test
for
Efficacy
Efficacy
Efficacy
Efficacy
Efficacy
Efficiency
Efficiency
Efficiency
Efficiency
Both
To explain the contrast between K-S test results of the first and third level
scores, quartiles of the normalized L1 (L1) and L3 (L3) scores of AON target sites for
AONs in each grade of Sets A and B are plotted for comparison; for example, the L1
score of an AON target site is the relative percentage difference between its L1 score
and the average L1 score of all AON target sites. As shown in Figure 7-5, L3 quartile
143
scores of target sites in (++) AONs are 34% to 124% lower than (–) AONs in Set A
while L3 quartile scores of target sites in (++) AONs are 127% to 229% lower than (–
) AONs in Set B. In contrast, L1 quartile scores of target sites in (++) and (–) AONs
are similar in Set A whereas L1 quartile scores of target sites in (++) AONs are only
20% to 32% higher than (–) AONs in Set B. Thus, L3 scores differ more extensively
than L1 scores between target sites of efficient and inefficient AONs in Sets A and B.
Nevertheless, L3 scores cannot differentiate between (+) and (─) AON target
sites. Intriguingly, p-value for (++) versus (+) AONs is even smaller than for (++)
versus (─) AONs, which suggests that although (+) AON target sites have more
engaged nucleotides than (─) AON target sites, they can still induce exon skipping
albeit not efficiently.
Hence, a more detail analysis is needed to explain this
phenomenon, as described in the next section.
A
L1
6
++
+
–
Q1
++
+
–
++
+
–
Q3
Median
0
-6
80
L3
10
-60
B
L1
10
++
+1
+2
–
++
+1
+2
–
++
+1
+2
–
-10
Q1
Median
Q3
-30
230
L3
160
90
20
-50
144
Figure 7-5. Normalized L1 and L3 quartile scores compared among AON grades.
The quartiles (Q1, median and Q3) of the normalized first level scores (L1), and normalized
third level scores (L3) for target sites of AONs in each AON grade of (A) Set A and (B) Set B
are plotted. Refer to main text for the determination of these normalized scores. The units for
all the vertical axes are in percentages.
7.5 Fourth level analysis: Localization of engaged
nucleotides
While third level analysis primarily involves a mean measure of frequency of engaged
nucleotides, fourth level analysis includes consideration of localization of consecutive
engaged nucleotides in the sequence of steps of transcriptional analysis of an AON
target site. Three fourth level scores are developed for this analysis:
(1) L4_AVG =
(7-1)
Sum of nucleotide engaged scores for the group of consecutive nucleotides
Number of nucleotides in the group
(2) L4_AND =
(7-2)
Sum of steps of transcriptional analysis in which all the nucleotides in the group of
consecutive nucleotides are engaged simultaneously (see Figure 7-4)
.
Total number of steps of transcriptional analysis
(3) L4_OR =
(7-3)
Sum of steps of transcriptional analysis in which at least one nucleotide in the group
of consecutive nucleotides is engaged (see Figure 7-4)
.
Total number of steps of transcription analysis
For each AON target site analyzed, all possible groups of 2 to 5 consecutive
nucleotides are obtained; each target site could have more than one such groups. For
instance, groups of two consecutive nucleotides are extracted by walking one
nucleotide at a time from one end of an AON target site to the other end. Likewise,
145
groups of three to five consecutive nucleotides are obtained similarly; inadequate
sample size constrained the analysis to a maximum of five consecutive nucleotides.
Subsequently, the three fourth level scores are applied on every group of consecutive
nucleotides and correlated with AON efficacy and efficiency by K-S tests among
various AON grades in Sets A and B. The analyses reveal that the localization of
consecutive engaged nucleotides at the ends of an AON target site attenuates AON
efficacy and efficiency more than at other sites, as discussed below.
7.5.1
Engaged nucleotides away from the ends of an
AON target site
For the purpose of this analysis, “away from the ends of an AON target site” refers to
nucleotides in the target site that are at least four nucleotides away from both 3’ and
5’ ends, as illustrated in Figure 7-4. The three fourth level scores are computed only
for those groups of consecutive nucleotides in which every nucleotide in the group
has an engaged score of at least 0.1. The analyses were stratified according to the
number of consecutive nucleotides in the groups.
Groups of two consecutive nucleotides. For both Sets A and B AONs, the K-S tests
find no statistical differences in all three scores of AON target sites at the different
AON grades (data not shown). Note: inadequate AON sample size in Set B restricts
the tests to scores of target sites of (++) versus (+ 1) AONs and (++) versus (+
1,2
, –)
AONs.
146
Groups of three consecutive nucleotides. K-S tests cannot be performed for both sets,
as AON sample sizes of many AON grades are inadequate (<6) to confer statistical
confidence. Nevertheless, for Set A AONs, box-plots for each score are constructed
in Figure 7-6A. The L4_AND score can differentiate (++) AONs from the other two
AON grades comparatively well. While the L4_AVG score displays some ability to
differentiate (++) AONs, the L4_OR score fails to do so. For Set B AONs, only (++)
AONs have adequate sample size to construct the box-plot (denoted as *** in Figure
7-6A). Consistent with the results for Set A AONs, the L4_AND score of (++) Set B
AON target sites have the smallest median and inter-quartile range compared to the
other two scores.
Groups of four consecutive nucleotides. For Set A AONs, only (+) and (–) AONs
have adequate sample sizes to construct the box-plots (Figure 7-6B). Again, the
L4_AND score demonstrates the best ability to differentiate (+) AONs from (–) AONs
while the L4_OR score fails to do so. The sample sizes of Set B AONs however are
insufficient for any analysis.
Groups of five consecutive nucleotides. For Set A AONs, while such groups are
found in three target sites of (─) AONs, they are not found in all target sites of both
(+) and (++) AONs. For Set B AONs, such a group is found in 33%, 11% and 6% of
target sites of (─) AONs, (+) AONs and (++) AONs respectively.
Overall, the L4_AND scores show the best ability to differentiate (++) AONs
while the L4_OR scores fail to do so. This indicates that the presence of at least three
consecutive nucleotides that are engaged simultaneously at considerable steps of
147
transcriptional analysis (as measured by the L4_AND score) but not the individual
nucleotide engaged incidences (as measured by the L4_OR score) attenuated AON
efficacy and efficiency.
0.0
0.2
0.4
0.6
0.8
1.0
A
(++)
AVG
(+)
AVG
(-)
AVG
(++)
AVG***
(++)
AND
(+)
AND
(-)
AND
(++)
AND**
(++)
OR
(+)
OR
(-)
OR
(++)
OR***
3-nt 3 nucleotides
Groups of clusters
0
.0
0
.2
0
.4
0.6
0
.8
1
.0
B
(+)
AVG
(-)
AVG
(+)
AND
(-)
AND
(+)
OR
(-)
OR
Groups 4-nt4 nucleotides
of clusters
Figure 7-6. Box-plots for the fourth level scores.
(A) Box-plots for L4_AVG (AVG), L4_AND (AND) and L4_OR (OR) scores of groups of 3
consecutive nucleotides meeting criterion of analysis (see main text) in target sites of (++),
(+) and (–) AONs of Set A, and of (++) AONs of Set B (***). (B) Box-plots for scores of
groups of 4 consecutive nucleotides meeting criterion of analysis in target sites of both (+)
and (–) AONs of Set A.
148
7.5.2
Engaged nucleotides at the ends of an AON target
site
“At the ends of an AON target site” refers to nucleotides in the target site that are
within three bases at 3’ or 5’ ends (Figure 7-4). Similarly, the three fourth level
scores are calculated for every group of three consecutive nucleotides at 3’ and 5’
ends of each target site analyzed; each AON target site will thus contributes two
groups. Groups with zero L4_AVG score, i.e., all the nucleotides are not engaged at
any step of transcriptional analysis, are excluded from the statistical tests.
Table 7-4A tabulates the significant p-values of the K-S tests for target site
scores of Sets A and B AONs. For Set A AONs, the L4_OR scores demonstrated the
best ability to correlate AON efficacy and efficiency, followed by the L4_AVG and
L4_AND scores.
However, the L4_AVG score demonstrated the best ability to
correlate (++) AONs in Set B AONs, followed by the L4_AND score but not the
L4_OR score. To investigate whether engaged nucleotides at either 3’ or 5’ end of
target sites affect AON efficacy and efficiency differently, the groups are stratified
into 3’ and 5’, and repeated the same K-S tests, as discussed below.
Engaged nucleotides at 3’ end. (Table 7-4B) For Set A AONs, the K-S test results are
consistent with those obtained from both ends of AON target sites (Table 7-4A)
except that, the L4_AND scores now fail to correlate any AON grade. For Set B
AONs, small sample sizes only permit testing between target sites of (++) versus (+ 1)
AONs and no statistical difference is obtained for all three scores (data not shown).
149
Engaged nucleotides at 5’ end. (Table 7-4C) For Set A AONs, only the L4_OR
scores can correlate AON efficacy. For Set B AONs, small sample sizes only permit
testing between target sites of (++) versus (+ 1), (+) and (+
1,2
, –) AONs. Both the
L4_AVG and L4_OR scores can differentiate (++) from (+ 1,2, –) AONs.
Engaged nucleotides at 3’ end versus at 5’ end.
(Table 7-4D) Here, statistical
difference in the fourth level scores between 3’ and 5’ ends of target sites of AONs of
the same grade is tested. For instance, in the case of (++) AONs, each of the fourth
level scores at the target site 3’ end is compared with the 5’ end using K-S tests. For
Set A AONs, 3’ end of (++) AON target sites have statistically smaller L4_AVG
scores than at the 5’ end. For Set B AONs, small sample sizes only permit testing of
target sites of (++) and (+ 1,2) AONs but no statistical difference is obtained (data not
shown).
Table 7-4. p-values for K-S tests using the fourth level scores.
(A) Test data includes both 3’ and 5’ ends of AON target sites. (B) Test data consists of only
3’ end of AON target sites. (C) Test data consists of only 5’ end of AON target sites. (D) 3’
versus 5’ end of AON target sites. The particular set of AONs tested in each test case
(column 3) is indicated in column 2. Only test cases with significant p-values are shown here.
Statistically significant p-values are indicated in bold and underlined. Note: Wilcoxon ranksum test cannot be used as one of its key assumptions is violated, i.e., distributions of each
AON grade’s L3 scores are distinct (box plots not shown).
Test case:
1st vs. 2nd
A
B
C
Set
A
(++) vs. (–)
A (++, +) vs. (–)
A (++) vs. (+, –)
B
(++) vs. (+1)
B (++) vs. (+1,2, –)
A
(++) vs. (–)
A (++) vs. (+, –)
A
(++) vs. (–)
A (++, +) vs. (–)
L4_AVG
Ho :
H o:
1st < 2nd 1st > 2nd
0.0089 0.97
0.055
0.96
0.96
0.013
0.17
0.98
0.95
0.025
0.91
0.017
0.94
0.012
0.11
0.96
0.16
0.96
L4_AND
Ho :
H o:
1st < 2nd 1st > 2nd
0.97
0.028
0.97
0.039
0.093
0.96
0.98
0.036
0.11
0.97
0.055
0.91
0.17
0.66
0.088
0.96
0.11
0.99
L4_OR
Ho :
H o:
1st < 2nd 1st > 2nd
0.0019 0.96
0.96
0.014
0.0035 0.96
0.31
0.93
0.082
1
0.82
0.017
0.86
0.020
0.96
0.026
0.94
0.047
Test
for
Efficacy
Efficacy
Both
Efficiency
Both
Efficacy
Both
Efficacy
Efficacy
150
D
B (++) vs. (+1,2, –) 0.018
A
3' vs. 5' (++) 0.028
0.96
0.79
0.25
0.24
1
0.44
0.040
0.060
0.96
0.89
Both
Efficiency
Overall, target sites of efficient AONs have lowest L4_OR scores in Set A
while they have lowest L4_AVG scores in Set B, which indicates that only one
nucleotide at the ends of an AON target site that is engaged at considerable steps of
transcriptional analysis is sufficient to attenuate AON efficacy and efficiency. This is
in stark contrast to the case where engaged nucleotides are localized away from the
ends of AON target sites in which at least three consecutive nucleotides that are
engaged simultaneously at considerable steps of transcriptional analysis would
attenuate AON efficacy and efficiency. Taken together, AON efficacy and efficiency
is more attenuated by presence of engaged nucleotides at the ends of target sites than
at other sites.
7.6 Efficiency of short AONs is attenuated more by
engaged nucleotides
Results in Section 7.5.2 suggest that the efficacy and efficiency of short AONs (Set
A) are more attenuated by engaged nucleotides at 3’ or 5’ ends of the target site as
compared to longer AONs (Set B). Particularly, the L4_OR and L4_AVG scores
demonstrate the best correlative power in Set A and Set B (Tables 7-4A to 7-4C),
respectively. As L4_AVG is the mean nucleotide engaged score of the nucleotides at
3’ or 5’ ends of the target site, its magnitude increases when the nucleotides are
engaged at more steps of transcriptional analysis.
In contrast, because L4_OR
151
measures the steps of transcriptional analysis at which at least one nucleotide at 3’ or
5’ ends of the target site is engaged, it can have a high value albeit the individual
nucleotide engaged scores are low. Therefore, efficacy and efficiency of Set A AONs
(short) are attenuated under fewer incidences of nucleotides being engaged at steps of
transcriptional analysis than Set B AONs (long). To eliminate the possibility that this
deduction is due to differences in the frequency and localization of engaged
nucleotides between Sets A and B AON target sites, their third and fourth level scores
are compared using K-S tests, and no statistical difference is detected (Appendix A19). Notably, augmentation of AON efficiency by targeting longer target sites in
dystrophin pre-mRNA has been reported (Harding et al., 2007).
Moreover, engaged nucleotides at 3’ end of shorter target sites (Set A)
attenuated AON efficiency more than at 5’ end (Table 7-4D). This might explain why
AON efficiency is reported to be more sensitive to nucleotide changes at the 3’ end
than 5’ end of its target site (Sczakiel, 2000).
7.7 Correlative power of the fourth level scores
To demonstrate the correlative power of the fourth level scores, three representative
examples in which only the fourth level scores can differentiate (++) AONs in Set A
are discussed. Figure 7-7A illustrated an example wherein AON target sites with
identical accessibility scores (L1) can have strikingly different engaged scores (L3).
Whereas the (–) AON target site’s high L3 score was expected, the higher L3 score of
the (++) AON target site compared to the (+) AON target site was confounding.
152
However, analysis at the fourth level reveals that more engaged nucleotides are
localized at the ends of (+) AON target site than at (++) AON target site.
Figure 7-7B illustrated an example in which L3 scores of the target site
correlate inversely with AON efficacy and efficiency, i.e., target sites of AONs with
higher engaged scores have higher efficiency to induce exon skipping. Again, the
fourth level analysis resolved this conundrum. Although the (++) AON target has the
most engaged nucleotides among them, they are mostly localized away from the ends
of the sites where at least three consecutive nucleotides that are engaged
simultaneously at considerable steps of transcriptional analysis is needed to attenuate
AON efficiency. Conversely, although the (–) AON target site has the least engaged
nucleotides among them, they are mostly localized at the 3’ end of the site where they
are especially detrimental to AON efficiency.
The final example (Figure 7-7C) illustrated a widespread phenomenon in the
data set in which (+) AON target sites have higher L3 scores than (─) AON target
sites but yet could still induce exon skipping. In fact, this phenomenon caused the pvalues of K-S tests of (++) versus (+) AON target site L3 scores to be smaller than for
(++) versus (─) target site L3 scores (Table 7-3A of Section 7.4). In most instances,
most of the engaged nucleotides manifested in (+) AON target sites are localized
away from the ends of the sites. Altogether, these examples show that localization is
as important as the frequency of engaged nucleotides.
As a further illustration, a novel AON target sequence was selected to skip
exon 57, which has been deemed to be “unskippable” (Aartsma-Rus et al., 2005).
153
Interestingly, exon 57 manifests an overwhelming occurrence of engaged nucleotides
(Appendix A-20); hence, it is relatively difficult to locate a suitably long sequence
that has ESE activity as well as high co-transcriptional binding accessibility. In fact,
published AONs targeting this exon have target sites that manifest high L3 and L4
scores. Based on the insights obtained in the analyses, the novel AON target site is
determined by these rules: negligible occurrence of engaged nucleotides (low L3 and
L4 scores), presence of ESE motifs predicted by ESE-Finder (Cartegni et al., 2003)
and RESCUE-ESE (Fairbrother et al., 2002), and location at the first half of the exon.
Experimental validation shows that it is indeed able to induce the skipping exon 57
(Figure 7 of Wee et al., 2008a as attached in Appendix A-1); more validations to
target exon 51 are published at Wee et al. (2007).
154
h78AON2 (++)
h56AON3 (+)
h43AON1 (–)
A
L1
L3
L4_OR
0.44
0.024
0.0082
0.13
5’: 0.031
3’: 0.003
5’: 0.066
3’: 0.35
5’: 0.86
h50AON1 (++)
h41AON2 (+)
h58AON1 (–)
B
L3
L4_OR
0.013
0.096
0.058
3’: 0.004
3’: 0.058
5’: 0.011
3’: 0.83
h40AON1 (++)
h42AON2 (+)
h43AON4 (–)
C
L3
L4_OR
< 0.001
0.14
0.099
5’: 0.004
3’: 0.059
5’: 0.031
3’: 0.91
5’: 0.38
Figure 7-7. Demonstration of the correlative power of the fourth level scores.
Three examples where only the fourth level scores can correlate AON efficacy and efficiency
compared to the third level score (see text for details). (A) to (C) In each example, the
incidences of engaged nucleotides at each step of transcriptional analysis for all nucleotide in
the AON target sites were depicted.
7.8 Summary
Previous studies have supported the general principle that mRNA secondary
structures influence AON efficacy and efficiency (Vickers et al., 2000; Lehmann et
155