Structural, magnetic and transport study of DBPLD fabricated magnetic semiconductors 2
Bạn đang xem bản rút gọn của tài liệu. Xem và tải ngay bản đầy đủ của tài liệu tại đây (2.5 MB, 31 trang )
CHAPTER 5: STUDIES ON STRUCTURES IN Zn
1-x
Co
x
O THIN FILMS
CHAPTER 5
STUDIES ON STRUCTURES IN Zn
1-x
Co
x
O THIN FILMS
5.1 Introduction
For materials research, structure study is also the basis. Motivated by the desire for
illuminating the physical mechanisms underlying DMS ferromagnetism [1], we studied
the structures of the materials, as it has a very high potential for elucidating the physics
behind the magnetic behaviors in Zn
1-x
Co
x
O thin films.
In this chapter, we will study the crystal structures, chemical state and electronic
structures of the Zn
1-x
Co
x
O thin films. To study the crystal structures, we will employ
HRTEM to determine whether Co clusters exist in the lattice on the nanometer scale.
Investigations of chemical states and electronic structures including valence band PES
were used to provide indirect and direct information on the electronic structures.
According to our experimental results, the Zn
1-x
Co
x
O thin films are single crystals
without apparent precipitates at relative low Co concentrations. With increasing Co
concentration, part of the host lattice changes from wurtzite structure to rock-salt
structure. Co 3d high spin states were observed.
National University of Singapore
66
CHAPTER 5: STUDIES ON STRUCTURES IN Zn
1-x
Co
x
O THIN FILMS
5.2 Surface Morphology
(a) 0.015
(b) 0.02
(c) 0.16
(d) 0.27
Fig. 5-1 AFM micrographs of Zn
1-x
Co
x
O with different Co concentrations [(a) x =
0.015, (b) x = 0.02, (c) x = 0.16 and (d) x = 0.27] obtained at the growth temperature of
650 for the films. ℃
Figures 5-1(a-d) exhibit the AFM images of Zn
1-x
Co
x
O thin films of different Co
concentrations obtained at the optimum growth condition mentioned in Chapter 4. The
thin films were granular at low Co concentration. For example, for Co concentration of
x = 0.015 in Fig.5-1(a), the grain size seemed to be uniform. The surface roughness
was about 0.8 nm, and the grain size was about 150 nm. This might be due to the
formation of a solid solution with a crystal structure. In contrast, irregular features may
be observed at a higher Co concentration (x = 0.27), as shown in Fig. 5-1(d).
National University of Singapore
67
CHAPTER 5: STUDIES ON STRUCTURES IN Zn
1-x
Co
x
O THIN FILMS
5.3 Crystal Structures of Zn
1-x
Co
x
O Thin Films
5.3.1 Crystal structures of Zn
1-x
Co
x
O thin film with x = 0.015
We have given the typical XRD pattern of Zn
1-x
Co
x
O film with x = 0.015, also as
shown in Fig. 5-2. Besides the peaks of substrate, diffraction peaks corresponding to
the (0002) and (0004) planes of the film with a hexagonal structure can be clearly
observed. No peak of other phases was detected. Consequently, it is a wurtzite
structure with the c-axis of the film aligned with that of the substrate. The (0002) and
(0004) peaks of the film are located at 34.46◦ and 72.64◦, respectively, very close to
those of ZnO. From the position of the reflection peaks, the lattice parameter of the
film was determined to be c = 0.520 nm, which is similar to the reported values for
ZnO.
The inset of Fig. 5-2 shows an enlarged plot of the (0002) peak of the film. It can be
seen that two peaks due to Cu Kα1 and Cu Kα2 radiation with wavelength 1.5406 and
1.5444 Å, respectively, were revealed clearly. This shows that the film is of good
crystallinity. As the peak is sharp, it is reasonable to consider that the dispersion of the
lattice parameters of the film is small.
National University of Singapore
68
CHAPTER 5: STUDIES ON STRUCTURES IN Zn
1-x
Co
x
O THIN FILMS
10 20 30 40 50 60 70 80 90
34.0 34.2 34.4 34.6 34.8 35.0
(0002) K
β
Co-doped ZnO
(0002) K
α
Intensity (a.u.)
2θ (Degree)
Co-
do
ped Z
n
O
(0
004
)
c-Al
2
O
3
(0006)
Co-doped ZnO (0002)
Intensity (a.u.)
2θ (Degree)
Co 0.015
Fig. 5-2 XRD pattern of the Zn
0.985
Co
0.015
O film grown on c-plane sapphire substrate.
A typical high-resolution XRD ω-rocking curve around the (0002) peak of the
Zn
1-x
Co
x
O films obtained using the XDD beam line at the SSLS is shown in Fig. 5-3.
A sharp peak with a FWHM of only 0.03° (central upper part) is observed, indicating
that the film orientation is very close to the direction perpendicular to the plane of
substrate, and the dispersion of the orientation is small. However, we can see a tail at
the base of the sharp peak. Its FWHM is about 0.2°. This tail is probably due to the
small population of texture distribution or lattice distortion. In general, FWHM of the
(0002) ω-rocking curve of the sample is small, showing a relatively good crystallinity
of the film.
National University of Singapore
69
CHAPTER 5: STUDIES ON STRUCTURES IN Zn
1-x
Co
x
O THIN FILMS
14.2 14.4 14.6 14.8 15.0 15.2 15.4 15.6 15.8 16.0
-1000
0
1000
2000
3000
4000
5000
6000
7000
8000
9000
10000
Intensity (a.u.)
θ (Degree)
Co 0.015
Fig. 5-3 A typical X-ray rocking curve of the Zn
0.985
Co
0.015
O film grown on c-plane
sapphire substrate at the growth temperature of 650 °C.
HRTEM cross-section images of Zn
1-x
Co
x
O (x = 0.015) near the surface and at the
interface is shown in Figures 5-4(a) and 5-4(b). The interfaces between Zn
1-x
Co
x
O
films and substrates were found to be smooth and clear. The images reveal high quality
lattice structures with few defects. No precipitates were observed. The sample was
observed with the <
0110
> axis of the film normal to the specimen surface. From the
TEM diffractions and imaging studies, the epitaxial relationship between the film (f)
and substrate (s), was established as follows:
sf
)0001//()0001(
and
sf
)0110//()0211(
. (5-1)
National University of Singapore
70
CHAPTER 5: STUDIES ON STRUCTURES IN Zn
1-x
Co
x
O THIN FILMS
In addition, both the films at the interface and near the surface reveal clear lattice
with the same orientation, suggesting that the film was formed to be a single crystal.
Fil
m
Surface
(a)
Fil
m
Sa
pp
hire
)0220(
)0006(
(b)
)0211(
)0002(
Fig. 5-4 HRTEM images of the Zn
0.985
Co
0.015
O films, the substrates and the interfaces
(a) near surface and (b) at interface, showing the epitaxial relationship of
and
sf
)0001//()0001(
sf
)0110//()0211(
.
National University of Singapore
71
CHAPTER 5: STUDIES ON STRUCTURES IN Zn
1-x
Co
x
O THIN FILMS
In summary, the Zn
1-x
Co
x
O (x = 0.015) film has the wurtzite structure, showing
good crystallinity without obvious clusters. The film grows along a preferred direction,
following the epitaxial relationship of
and
sf
)0001//()0001(
sf
)0211//()0110(
.
5.3.2 Dependence of crystal structures of Zn
1-x
Co
x
O thin film on Co concentration
0.00 0.05 0.10 0.15 0.20 0.25 0.30
0.5198
0.5200
0.5202
0.5204
0.5206
0.5208
0.5210
0.5212
Lattice constant (nm)
Co concentration x
(a)
0.00 0.05 0.10 0.15 0.20 0.25
0.05
0.10
0.15
0.20
0.25
0.30
FWHM (Degree)
Co concentration x
(b)
Fig. 5-5(a) Variation of c-axis lattice constant c(0002) with Co concentration x; (b)
FWHM of the (0002)
f
rocking curves dependence on Co concentration x.
National University of Singapore
72
CHAPTER 5: STUDIES ON STRUCTURES IN Zn
1-x
Co
x
O THIN FILMS
The Co concentration x dependence of the c-axis lattice constant is given in Fig.
5-5(a). The lattice constant c value does not increase linearly with Co concentration x.
This behavior is due to the different ionic radii (r) of the tetrahedral coordinated Zn
2+
r
= 0.60 Å and r = 0.58 Å for Co
2+
[2]. In addition, with increasing x, the Co ions are not
always homogeneously distributed in ZnO. With increasing Co concentration x, apart
from Co atoms substituting the Zn-site in ZnO, some Co atoms locate at the center of
the octahedral site rather than at tetrahedral sites. Namely, part of the host lattice
gradually varies from wurtzite structure to rock-salt structure. As we know CoO has a
rock-salt type structure with lattice parameter of 0.426 nm [3] which is smaller than
that of wurtzite structure of ZnO.
The dependence of the FWHM of the (0002)
f
rocking curves on Co concentration is
shown in Fig. 5-5(b), where (0002)
f
is the (0002) plane of Zn
1-x
Co
x
O thin film, f
assigns the film. With increasing Co concentration, the top sharp peak mentioned
above reduces gradually, and the FWHM tends to increase. The rocking curves tend to
broaden, indicating dispersion of the orientation. The broadening in the rocking curves
of the films may be due to the distortion of the host lattice, which could be due to
strain induced by the occupation of Zn ion sites by Co ions, or the presence of Co
precipitates or clusters. In the case of the occupation of Co ions at Zn ion sites, because
there exists some differences between Co ions and Zn ions radii [2], strains will be
induced in the lattice. This probably results in the distortion of the host lattice. Some
Co ions locating at the center of octahedron also causes the distortion of the host lattice.
However, generally speaking, our experimental results of XRD and the values of the
National University of Singapore
73
CHAPTER 5: STUDIES ON STRUCTURES IN Zn
1-x
Co
x
O THIN FILMS
FWHM of the rocking curves indicate that the film obtained by this DBPLD method
grow along a preferred direction well.
To present a whole picture of the trend of crystal structures on Co concentration,
the HRTEM results of the Zn
1-x
Co
x
O thin films with x ranging from 0.015 to 0.046
were given in Fig. 5-6.
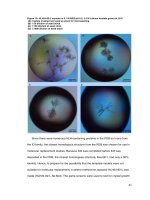
Figures 5-6(a) and 5-6(b) show HRTEM cross section images and diffraction
pattern of Zn
1-x
Co
x
O (x = 0.015) film. Figure 5-6(a) show the image of the film with
the lattice clear and straight. The corresponding selected area electron diffraction
shows a very clear dot pattern, as shown in Fig. 5-6(b). No smeared or circle patterns
were observed. Hence, based on our experimental results, the Zn
1-x
Co
x
O (x = 0.015)
film reveal a high quality lattice structure with few defects.
Figures 5-6(c) and 5-6(d) show HRTEM cross section imagies and diffraction
pattern of Zn
1-x
Co
x
O (x = 0.16) film, the substrates and interface. The interfaces
between Zn
1-x
Co
x
O films and substrates were found to be smooth and clear. The
imagies show high-quality lattice structure. The specimen was observed with the
<
0211
> axis of the film normal to the sample surface. From the TEM diffractions and
imaging studies, the epitaxial relationship between the film (f) and substrate (s), was
found to be
and
sf
)0001//()0001(
sf
)0211//()0110(
(5-2)
HRTEM cross section images of Zn
1-x
Co
x
O (x = 0.015) near the interface and its
diffraction pattern are also shown in Fig. 5-6(a) and 5-6(b). From it, the epitaxial
relationship between the film (f) and substrate (s) is the same as Exp. (5-2) above.
National University of Singapore
74
CHAPTER 5: STUDIES ON STRUCTURES IN Zn
1-x
Co
x
O THIN FILMS
Hence, based on our experimental results, the epitaxial relationship between the film
and the substrate is concluded that the lattice of the film rotates 30° to that of the
substrate.
Figures 5-6(e) and 5-6(f) show high-resolution cross-section images and diffraction
pattern of Zn
1-x
Co
x
O thin film with x = 0.46. A lattice could still be observed at this
high Co concentration, however, defects were also observed in this film [the circle area
in Fig. 5-6(e)]. The diffraction pattern became less regular. The diffraction pattern
revealed well that most defects are polycrystal structure instead of single crystal, as
shown in Fig. 5-6(f). The light circles on the diffraction pattern indicate that the film
contains precipitates.
Based on our experimental results, we conclude that high quality wurtzite crystal
structure films have been fabricated, particularly for the films with relative low Co
concentrations. In all of the specimens with Co concentration x < 0.1, TEM images
display good lattice without obvious clusters. But for some samples with relatively
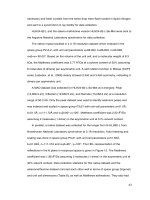
high Co concentrations, sometimes, we observe secondary phase precipitates. Figure
5-7 shows the Co-metal clusters (about 10nm) in the Zn
1-x
Co
x
O thin films with Co
concentration about 0.16. We need to note that clusters may not be observed for some
samples with the Co concentration x > 0.1. This is due to the non-uniformity of the
DBPLD method.
National University of Singapore
75
CHAPTER 5: STUDIES ON STRUCTURES IN Zn
1-x
Co
x
O THIN FILMS
Sapphire
Film
Co 1.5 %
Film
Sapphire
>< 0001
>< 0001
>< 0110
>< 0211
nm5
Co 46 %
(c)
(a) (b)
(e)
(f)
(d)
SapphireSapphire
(d)
Co 16%
Fig. 5-6 HRTEM images of the Zn
1-x
Co
x
O films, the substrates and the interfaces (a, c,
e) and selected area electron diffraction pattern of the film (b, d, f) and substrates
(insets) with different Co concentrations: (a, b) for x = 0.015, (c, d) for x = 0.16 and
(e, f) for x = 0.46. The circle in Fig. 6(e) shows a defect.
National University of Singapore
76
CHAPTER 5: STUDIES ON STRUCTURES IN Zn
1-x
Co
x
O THIN FILMS
With increasing Co concentration, the host lattice tends to change. For a higher Co
concentration, the diffraction pattern revealed that the regular diffraction pattern is
changed to a less regular pattern, that is, most defects are polycrystal structure instead
of single crystal. These results could be explained by the deposition theory [4]. It is
known that ZnO has a higher surface energy of {0001} facet on c-plane sapphire. And
CoO has the rock salt structure, the crystal structure and anisotropy of Co – O are
different with that of Zn – O. The change of deposition anisotropy makes the
“developing ZnO facets” more difficult. In addition, the energy released due to the
different radius of Co ions and Zn ions will lead to the distortion of the lattice [5]. The
change of surface energy leads to the change of deposition anisotropy. Therefore, the
preferred growth orientation is dispersed and wurtzite crystal structures are destroyed.
Another reason is that at relatively low Co concentration x, Co ions substitute the
Zn-site in ZnO and locate at the tetrahedron centers, the structures are single crystals.
With increasing x, the strain in the lattice increases and more O - Co - O bonds are
established in the films which are different with that of O – Zn – O, schematically as
shown in Fig. 5-8. The bond angle tend to change and the host lattice is distorted. As a
result, some Co ions are located at the octahedral centers. As more Co ions are located
at the octahedron centers, the host lattice is distorted further and the preferred
orientation of (0002) of the film is changed. Consequently, the lattice constant did not
follow a linear dependence on x which is usually a optical probe whether the dopants
change the host lattice. In our studies, no perceptible precipitates were observed at low
Co concentration (x < 0.1). At higher Co concentration, precipitates may be observed.
National University of Singapore
77
CHAPTER 5: STUDIES ON STRUCTURES IN Zn
1-x
Co
x
O THIN FILMS
These results of structure studies coincide with those of property studies which will be
discussed in next chapter.
(a)
(b)
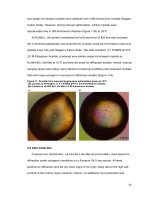
Fig. 5-7(a) HRTEM image and (b) corresponding selected area electron diffraction of
the film with x = 0.16 showing dispersed Co clusters with the diameter about 10 nm.
The patterns were designated to be Co clusters.
National University of Singapore
78
CHAPTER 5: STUDIES ON STRUCTURES IN Zn
1-x
Co
x
O THIN FILMS
Zn
Co
O
O
ZnO CoO
Center of
tetrahedron
Center of
octahedron
133
o
90
o
Fig. 5-8 Schematic graphs of Zn-O bond in ZnO and Co-O bond in CoO (not to scale).
5.4 Chemical States of Co in Zn
1-x
Co
x
O Thin Films
XPS spectra of the Zn
1−x
Co
x
O film with x = 0.015 is given in Figure 5-9. The
composition of the film can be obtained by calculating of the relative areas for specific
binding energies. The composition of the film is Zn
0.985
Co
0.015
O
0.67
. The binding
energies of Zn 2p3/2 as shown in Fig. 5-9(a), and Co 2p3/2 in Fig. 5-9(b), and O 1s in
Fig. 5-9(c), provide a complete picture of the elements’ chemical states. The Zn 2p3/2
XPS peak appeared at 1020.8 eV, which coincides with Zn in ZnO [6]. There is no
National University of Singapore
79
CHAPTER 5: STUDIES ON STRUCTURES IN Zn
1-x
Co
x
O THIN FILMS
peak at 1021.9 eV, indicating that no trace of pure Zn was detected in the film [6]. It is
well known that the Co – O bonding and Co – Co bonding peaks occur at 780 eV and
778 eV, respectively. From Fig. 6-9(b), the Co 2p3/2 peak appears at 780 eV,
indicating that only Co – O bonding exists in the film and no Co – Co bonding exists
in the film. The O (1s) peak centered at 529.4 eV is in agreement with the binding
energy for O 1s of 528.1–531.05 eV for a metal oxide [6], which may be attributed to
oxide ions in ZnO or CoO. These results show that Co has replaced Zn, resulting in Co
– O bonding in the host lattice. Moreover, the film is a single crystal metal oxide
compound with more oxygen vacancies but less Zn interstitials. Under our
experimental conditions, the high vacuum pressure leads to more oxygen vacancies in
the film. The oxygen vacancies act as donors, and contribute to the semiconductor
properties of the film [7].
National University of Singapore
80
CHAPTER 5: STUDIES ON STRUCTURES IN Zn
1-x
Co
x
O THIN FILMS
1015 1020 1025 1030 1035 1040
0
20000
40000
60000
80000
100000
120000
c/s
Binding energy (eV)
Zn2p3
(a)
760 770 780 790 800 810 820
11800
12000
12200
12400
12600
12800
13000
13200
13400
13600
13800
c/s
Binding energy (eV)
Co2p3
(b)
520 525 530 535 540 545
5000
10000
15000
20000
25000
30000
c/s
Binding energy (eV)
O1s
(c)
Fig. 5-9 XPS spectra for Zn
0.985
Co
0.015
O
0.67
film: (a) Zn 2p3/2 XPS spectrum, (b) Co
2p3/2 XPS spectrum, (c) O 1s XPS spectrum.
National University of Singapore
81
CHAPTER 5: STUDIES ON STRUCTURES IN Zn
1-x
Co
x
O THIN FILMS
The XPS spectra of the films with different Co concentrations is shown in Fig. 5-10.
A typical O1s peak of Zn
1-x
Co
x
O thin film is given in Fig. 5-10(a). The O1s peak is
observed to reveal a shoulder at higher binding energy. By fitting the peak with
gaussians, the O1s can be separated into two peaks. The lower energy peak (labeled
O1) located at 529.3 eV, corresponds to O - Zn bonds, while the higher energy peak,
located at 531.6 eV (O2), can be attributed to O - H bonds resulting from exposure to
air. In our study, we focus on the lower energy peak O1 rather than the higher energy
peak O2. For our synthesized materials, the shift of the peak O1 toward higher binding
energy is observed with increasing Co concentration, especially when Co
concentration x exceeds 0.03 [see Fig. 5-10(b)]. In the case of the occupation of Co
ions at Zn sites, it is reasonable that the substitution atoms affect the surrounding O -
Zn binding energies through the effect of electron charges. The position of peak O1
increases from 529.3 to 529.7 eV as the Co concentration x of Zn
1−x
Co
x
O increases
from 0.03 to 0.25. With higher Co concentration, the O1s peak attributed to O - Zn
bonds (peak O1) shifts toward higher binding energy. However, there is no obvious
change in the position of Zn 2p3/2 peaks, as shown in Fig. 5-10(c). In Fig. 5-10(d), the
Co 2p3/2 peaks correspond to the Co - O bonding [6]. Under our experimental
conditions, the intensity of Co 2p3/2 peaks increases with increasing Co concentration.
In order to show the effect of Co precipitates, a Co 2p3/2 spectrum of the Zn
1−x
Co
x
O
film with x = 0.41 is also plotted. The excessive Co content results in the occurrence of
a peak at 778 eV, indicating the presence of Co precipitates.
National University of Singapore
82
CHAPTER 5: STUDIES ON STRUCTURES IN Zn
1-x
Co
x
O THIN FILMS
524 526 528 530 532 534 536 538 540 542
8000
10000
12000
14000
16000
18000
20000
22000
24000
26000
28000
O2
Intensity (c/s)
Binding energy (eV)
Experimental data
Fitting data
Backing ground
O1
O2
O1
(a)
Co 0.03
O1s
526 527 528 529 530 531 532 533 534
6000
8000
10000
12000
14000
16000
18000
20000
22000
24000
26000
28000
Co 0.015
Co 0.03
Co 0.05
Co 0.09
Co 0.25
Intensity(a.u.)
Binding Energy (eV)
(b)
O1
1017 1018 1019 1020 1021 1022 1023 1024 1025
0
20000
40000
60000
80000
100000
120000
Co 0.015
Co 0.03
Co 0.05
Co 0.09
Co 0.25
Intensity (c/s)
Binding Energy (eV)
(c)
Zn 2p3/2
776 778 780 782 784 786 788 790
12000
14000
16000
18000
20000
22000
24000
CoO
Co 2p3/2
Co 0.015
Co 0.03
Co 0.05
Co 0.09
Co 0.25
Co 0.41
Intensity (c/s)
Binding Energy (eV)
(d)
Co
Fig. 5-10 XPS spectra for Zn
1-x
Co
x
O films: (a) O 1s XPS spectrum of Zn
1-x
Co
x
O (x =
0.03) film with Gauss fitting results (thinner lines), (b) Step scanned data of the
deconvoluted O1 peaks, (c) Zn 2p3/2 XPS spectra, (d) Co 2p3/2 XPS spectra. Note
that in (b) the peaks have been shifted by constant offset for clarity.
5.5 Electronic Structure Study
5.5.1 Absorption Spectra of Zn
1−x
Co
x
O Thin Films
The optical absorption spectrum of the film for x = 0.015 is shown in Fig. 5-11. The
film is observed to be transparent in the visible region from 400 nm and it has a narrow
absorption band around 380 nm, from which the bandgap energy of 3.31 eV can be
obtained. It is very close to that of pure ZnO. When electrons transit from initial state
to final state, photons of a certain frequency will be absorbed. The absorption
coefficient is proportional to the density of the electrons in the initial and final states
[8]. Therefore, the clear absorption edge also demonstrates that the electrical structure
National University of Singapore
83
CHAPTER 5: STUDIES ON STRUCTURES IN Zn
1-x
Co
x
O THIN FILMS
of the host semiconductor is well preserved. The optical band gap energy of the films
was obtained by plotting
α
2
versus wavelength λ (hν), where
α
and λ ( hν) are
absorption coefficient and wavelength, respectively. The intercept on the hν-axis at
α
2
= 0 gives Eg = 3.31 eV, which represents the optical bandgap of the film.
250 300 350 400 450 500 550 600 650 700 750 800 850
0.0
0.5
1.0
1.5
2.0
2.5
Abs. (a.u.)
Wavelength (nm)
Fig. 5-11 Optical absorption spectra of Zn
0.985
Co
0.015
O film.
The optical absorption spectra of Zn
1−x
Co
x
O thin films with different Co
concentrations are shown in Fig. 5-12(a). The values of optical bandgap can be
obtained from these spectra. The absorption spectrum of the film with x = 0.05 is given
by the curve 3 in Fig. 5-12(a). It is transparent to light when the wavelength is larger
than 413 nm (band tail), and there is a very rapidly rising absorption edge (absorption
onset) at round 373 nm. The sharp absorption edge of the sample indicates high crystal
quality. As for the sample with higher Co concentration [for example, 0.09, as shown
as curve 4 in Fig. 5-12(a)], band tail is shifted to a larger wavelength (red shift). The
National University of Singapore
84
CHAPTER 5: STUDIES ON STRUCTURES IN Zn
1-x
Co
x
O THIN FILMS
relatively larger band tail may be attributed to the energy levels near the band edge.
From it, the absorption edge is not well defined, which is expected for some
component of indirect-bandgap semiconductor transmission. This is agreement with
the previous result that the host lattice gradually changes from wurtzite structure of
ZnO to rock-salt type structure of CoO [9].
On the other hand, there is a blue shift for the absorption onset. In short, broadening
behavior near the absorption onset can be observed with higher Co concentration. A
blue shift of the absorption edge with increasing dopant concentration indicates an
increase in the optical bandgap of the system. This is due to the addition of Co ions
into the Zn sites in ZnO which affects the electronic band structure of the material:
more Co-O bondings and indirect transition. The optical bandgap energy dependence
on Co concentration is shown in Figure 5-12(b).
National University of Singapore
85
CHAPTER 5: STUDIES ON STRUCTURES IN Zn
1-x
Co
x
O THIN FILMS
300 400 500 600 700
0
1
2
3
4
5
550 600 650 700 750
5
4
2
1
3
4
A
2
(F)
2
E
1
(G)
4
A
2
(F)
4
T
1
(P)
4
A
2
(F)
2
A
1
(G)
Intensity (a.u.)
Wavelength (nm)
5
2
3
4
Absorption (a.u.)
Wavelength (nm)
1 Black Co 0.015
2 Green Co 0.02
3 Red Co 0.05
4 Blue Co 0.09
5 Navy Co 0.25
(a)
1
0.00 0.05 0.10 0.15 0.20 0.25
3.30
3.35
3.40
3.45
3.50
3.55
3.60
3.65
3.70
Bandgap (eV)
Co concentration x
(b)
Fig. 5-12(a) Optical absorption spectra of Zn
1-x
Co
x
O films grown on c-plane sapphire
substrates at different Co concentrations. Inset shows an enlarged plot of the
absorption spectra around 650 nm. A, E and T are designations of the intermediate
energy bands. (b) Variation in the optical band-gap of Zn
1-x
Co
x
O films with Co
concentration.
National University of Singapore
86
CHAPTER 5: STUDIES ON STRUCTURES IN Zn
1-x
Co
x
O THIN FILMS
The absorption coefficient
α
is closely related to the density of electrons in the
initial and final states [10]. In our samples, the absorption edge becomes less defined
with increasing Co concentration. The broadening of the absorption spectra near the
absorption onset suggested that probably there are some components of indirect
transmission. Some peaks corresponding to midgap-like absorption were also observed.
This phenomenon, together with the results of XRD and XPS, is consistent with Zn
ions being replaced by Co ions. Inset of Fig. 5-12(a) is an enlarged plot of the
absorption spectra near 650 nm. We observed that for higher Co concentration, the
dominant midgap-like absorption peaks were around 569 nm (2.18 eV), 616 (2.01 eV)
and 662 nm (1.87 eV). Using the high spin d
7
electron configuration of the
tetrahedrally coordinated Co
2+
ions, these absorption are expressed by
)()(
1
2
2
4
GAFA → , and . )()(
1
4
2
4
PTFA → )()(
1
2
2
4
GEFA →
Here, A, E and T are generally designations of intermediate energy bands [11,12].
The midgap absorption around these energy develops as Co concentration increases.
The absorption spectra of Co
2+
in ZnO can be explained by static crystal-field theory
[12] as follows. Clearly, the energy level of Co
2+
(3d
7
) in ZnO are determined by
Coulomb, crystal field, and spin-orbit interactions. In this inset, the observation of the
spin-allowed transition to
indicates the trigonal splitting of with
)(
1
4
PT )(
1
4
PT
∧
E
below
(
2
∧
A
∧
E
and are defined as energy bands in Fig. 1 of Ref. [12] shown in
Appendix 1) caused by the dependence of the trigonal field splitting of the
states
(energy
2
∧
A
1
4
T
∧
E
- energy ) on
∧
A
υ
and
υ
′
, where
υ
and
υ
′
are trigonal crystal-field
parameters. In our case,
υυ
4
3
2 >
′
is expected. From our absorption results, the
National University of Singapore
87
CHAPTER 5: STUDIES ON STRUCTURES IN Zn
1-x
Co
x
O THIN FILMS
many electron ground states are singlet A
2
. We observed the absorption band to the d-d
transition of the Co
2+
impurity in Zn
1−x
Co
x
O, indicating the band splitting, i.e., the
trigonal splitting of
. Moreover, the absorption takes place over a relatively
wide energy range rather than at a sharp peak. Therefore, it is reasonable to assign this
absorption to the charge-transfer transition between donor and/or acceptor ionization
levels of Co ions in Zn
1−x
Co
x
O crystal field with trigonal and tetrahedral symmetry
[13]. We know the host lattice changes from wurtzite structure to rock-salt structure
with increasing Co concentration.
)(
1
4
PT
5.5.2 Photoluminescence of Zn
1-x
Co
x
O Thin Films
Under our experimental conditions, near-band emission can be found at low Co
concentration. Figure 5-13(a) shows a typical near band PL emission spectrum. In this
figure, the emission band centered around 379 nm (near bandgap) with a FWHM of
about 30 eV. It is in agreement with the results of absorption spectra. The green band
near 520 nm, reported to be associated with the point defects and impurities in the
films [14], are generally quenched in our studies. Here, we concentrate on the free
exciton peaks around 380 nm.
The near band PL emission spectra at different doping concentration are also shown
in Fig. 5-13 (b) and 5-13(c). With increasing Co concentration [Fig. 5-13(b)], the
intensity of PL decreases. Further increase in Co concentration may even quench the
near-band emission at room temperature, as shown in Fig. 5-13(c). The decrease in the
intensity of PL spectra indicates that defects may probably increase with increasing Co
National University of Singapore
88
CHAPTER 5: STUDIES ON STRUCTURES IN Zn
1-x
Co
x
O THIN FILMS
concentration. This is consistent with the XRD data mentioned earlier. We claim that
defects may suppress the excitonic emission of the films. The blue shift of the PL peak
position with increasing Co concentration coincides with the absorption spectra results.
360 380 400 420 440 460 480
0
10
20
30
(c)
Intensity (a.u.)
Wavelength (nm)
0
20
40
(b)
0
50
100
150
(a)
Fig. 5-13 Emission spectra for Zn
1-x
Co
x
O films with different Co concentration x. (a) x
= 0.015, (b) x = 0.02, (c) x = 0.12.
5.5.3 Valence Band PES of Zn
1-x
Co
x
O Thin Films
The valence band PES spectrum of Zn
1-x
Co
x
O (x = 0.02) is shown in Fig. 5-14(b).
From the figure, the valence band PES spectra of Zn
1-x
Co
x
O (x = 0.02) can be fitted
with four Gauss lines with the peak position of binding energy around 11 eV (P1), 5
eV (P2), 7.5 eV (P3) and 1 eV (P4), respectively. The peaks are labeled as P1, P2, P3
and P4, represent the four fitting peaks in Fig. 5-14(b) in turn.
National University of Singapore
89
CHAPTER 5: STUDIES ON STRUCTURES IN Zn
1-x
Co
x
O THIN FILMS
The theoretical calculated density of states of ZnO near E
F
by FEFF801 is shown in
Fig. 5-14(a). The dotted curves present the contribution of s band, p band and d band
to the DOS. They have been calculated on the basis of the results from one-panel
calculations with s, p and d muffin-tin orbitals placed on TM and oxygen sites. The
inset shows an enlarged part of 3d, p and s partial density of states. From this, we can
observe the components of calculated Zn 3d, mixed s and p (O 2p) density of states.
The features of Fig. 5-14(a) are basically similar to the experimental result shown in
Fig. 5-14(b) except that there is some shift of the peaks. Though the agreement
between theory and experiment is imperfect, in the present analyses, comparing the
spectra in Fig. 5-14(a) and 5-14(b), P1 corresponds to Zn 3d, P2 represents O 2p, P3
represents the mixture of O 2p and Zn 4s. P4 is on the top of O 2p, a feature of the
spectra of the Zn
1-x
Co
x
O thin films that is different from that of ZnO, reflecting the
effect of the Co. Ref [15] pointed out that in CoO, the center of 3d band is on the top
of the O 2p band. Hence, it is reasonable to consider that this peak is related to Co 3d
band with the feature of non-bonding O 2p in Zn
1-x
Co
x
O.
From our experimental results, Zn
1-x
Co
x
O thin films have similar band structures to
that of ZnO, in particular when x is small (such as x = 0.02 in Fig. 5-14). It is also
known Zn
1-x
Co
x
O has a wurtzite-type lattice, for which both the lowest conduction
band and uppermost valence bands have extremal points at the canter of the Brillouin
zone. The
valence states involve mostly anion (O
8
Γ
2-
) p orbitals. In the Zn
1-x
Co
x
O
thin films, Co ions occupy Zn-sites with the tetrahedral symmetry. For this symmetry,
the hybridization related to
is important. Later we will discuss that, in a tetrahedral
8
Γ
National University of Singapore
90