Structural, magnetic and transport study of DBPLD fabricated magnetic semiconductors 3
Bạn đang xem bản rút gọn của tài liệu. Xem và tải ngay bản đầy đủ của tài liệu tại đây (360.5 KB, 24 trang )
CHAPTER 6: DEPENDENCE OF Zn
1-x
Co
x
O PROPERTIES ON Co CONCENTRATION
CHAPTER 6
DEPENDENCE OF PROPERTIES OF Zn
1-x
Co
x
O THIN
FILMS GROWN ON (0001) SAPPHIRE SUBSTRATES ON
Co CONCENTRATION
6.1 Introduction
Today, the fabrication of room temperature DMSs is still a great challenge. For the
purpose of fabrication of room temperature DMSs, Zn
1-x
Co
x
O materials have widely
studied, and many experimental results have been reported. However it is hard to see
these results show consistency, especially discrepancies were reported by different
groups for the magnetic properties. Beside ferromagnetic behaviours, paramagnetic or
spin glass behaviours were all reported [1-6]. For example, Zn
1-x
Co
x
O thin films were
reported to be paramagnetic for x < 0.12 in Ref. [5]; in contrast, M-H hysteresis loops
were observed for Zn
1-x
Co
x
O thin films with similar Co concentrations [7].
In our view, the differences are probably due to different experimental conditions
and the sensitivities of the properties for Zn
1-x
Co
x
O thin films. Hence it is necessary to
prepare the films under the identical experimental conditions with a large range of Co
concentrations and study the properties dependence on Co concentration x.
In our study, the DBPLD was used to synthesize Zn
1-x
Co
x
O thin films, hence the
films could be prepared under the identical experimental conditions with a large range
of Co concentrations. Magnetic behaviors and semiconductive properties are the most
National University of Singapore 97
CHAPTER 6: DEPENDENCE OF Zn
1-x
Co
x
O PROPERTIES ON Co CONCENTRATION
important properties for DMSs. In this chapter, the magnetic and transport behaviors
of the films were characterized. From our experimental results, we conclude that
Zn
1-x
Co
x
O with x < 0.1 is a candidate material exhibiting both magnetic and
semiconductive properties at room temperature. That is, the magnetism can be realized
with Co doped into ZnO. However, the improvement was limited. The transport
behaviors of the Zn
1-x
Co
x
O thin films can be explained by a hopping mechanism,
whose electrical states of Co ions is suggested to be localized.
In this chapter, we are only concerned with magnetic behaviors. The magnetic
mechanisms will be discussed in a specific chapter (see Chapter 7).
6.2 Magnetic Properties of Zn
1-x
Co
x
O Thin Films
6.2.1 M-H Loops of Zn
1-x
Co
x
O Thin Films at Room Temperature
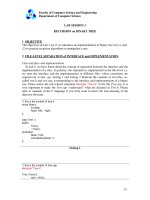
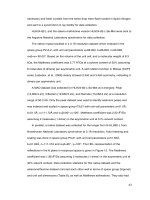
Figure 6-1(a) illustrates the M-H curves of Zn
1-x
Co
x
O films at room temperature
with Co concentration x ranging from 0.015 to 0.27 by VSM. Even in the presence of
some noise due to weak signals, hysteresis loops were observed. The coercivity
measured was around 100 Oe, including the curve 1 of Fig. 6-1. Our experimental
results showed that magnetism could be realized by even a very low Co concentration.
From curve 1-3 of Fig. 6-1, there are not apparent differences between them. It seems
that with increasing Co concentration, the improvement of magnetism was limited.
Further increase in Co concentration, magnetism may increase, as shown in curve 5 of
Fig. 6-1(a), and magnetic anisotropy may even be observed [Fig. 6-1(b)]. However, the
XPS Co (2p) spectrum indicates presence of Co–Co binding, as shown in the inset of
National University of Singapore 98
CHAPTER 6: DEPENDENCE OF Zn
1-x
Co
x
O PROPERTIES ON Co CONCENTRATION
Fig. 6-1(b). A peak centered at 778.9 eV was observed outside the binding energy
range of Co–O (779.4– 780.2 eV) [8]. Hence, the magnetic anisotropy may be due to
the Co precipitates in the film.
-6000 -4000 -2000 0 2000 4000 6000
-40
-20
0
20
40
Excimer Laser
10 Hz, 3J/cm
2
5x10
-5
Torr
650
o
C
1.Co 0.015
2.Co 0.02
3.Co 0.05
4.Co 0.16
5.Co 0.27
5
4
3
2
Magnetization (emu/cm
3
)
Magnetic Field (Oe)
(a)
1
-4000 0 4000 8000
-40
-20
0
20
40
Co 0.27
775780785790
14000
16000
18000
20000
22000
c/s
BE (eV)
778.9 eV
(b)
Magnetization (emu/cm
3
)
Magnetic Field (Oe)
0
o
30
o
60
0
90
0
Fig. 6-1(a) Magnetic loops of thin films with different Co concentrations measured at
room temperature by VSM; (b) Magnetic loops of thin films with Co concentration of
x = 0.27 at different angles by VSM. Inset shows the XPS Co 2p3/2 spectrum.
National University of Singapore 99
CHAPTER 6: DEPENDENCE OF Zn
1-x
Co
x
O PROPERTIES ON Co CONCENTRATION
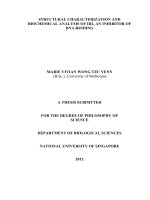
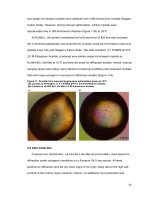
Figure 6-2 depicts the saturation magnetization per Co atom dependence on Co
concentration. When the Co concentration is very low (x ~ 0.01), the film reveals a
relatively high effective number of Bohr magnetons, around 3
Co
B
/
µ
, agreeing with
the value in reference [9]. It is consistent with the calculated value for the effective
number of Bohr magnetons under the condition of quenched orbital moments for Co
2+
with the configuration of 3d
7
[10]. It is worth noting that the expected value of
magnetic moment per Co atom in [9] is obtained under the condition of p-type ZnO
situation. It was also found that the magnetic moment per Co atom decreased with
increasing Co concentration for x < 0.1. The decrease of magnetic moment per Co
atom with x suggests the presence of antiferromagnetic interactions in the Zn
1-x
Co
x
O
system. The details of antiferromagnetic coupling mechanism between magnetic ions
will be discussed in the section 7.4.2. Here only a brief description is given as follows.
It is reasonable to ascribe the antiferromagnetic coupling between magnetic ions to
superexchange interaction [11]. With increase in Co concentration, the mean distance
between Co atoms is reduced, and thus the antiferromagnetic interaction is reinforced.
When the Co concentration is over 0.1, magnetic moment per Co stops decreasing. The
reason maybe related to the Co cluster induced which is the results of Co concentration
over the percolation limit. This result corresponds to those of structure studies in
section 5.6, in which Zn
1-x
Co
x
O films showed good crystallinity, good lattice without
obvious clusters with x < 0.1. Similar results will be discussed in the section 6.2.3,
where the magnetic moment obtained at 1000 Oe was observed to decrease when the
Co concentration increases from 0.02 to 0.09, as shown in Fig. 6-5(b).
National University of Singapore 100
CHAPTER 6: DEPENDENCE OF Zn
1-x
Co
x
O PROPERTIES ON Co CONCENTRATION
0.00 0.05 0.10 0.15 0.20 0.25 0.30
0.0
0.5
1.0
1.5
2.0
2.5
3.0
3.5
Excimer Laser
10 Hz, 3J/cm
2
5x10
-5
Torr
Growth temperature 650
o
C
M
s
/Co atom (µ
B
/Co)
Co concentration x
Fig. 6-2 Ms per Co atom dependence on Co concentration at room temperature.
6.2.2 Magnetic Properties of a Zn
0.98
Co
0.02
O Film
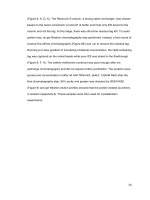
A SQUID magnetometer was used to precisely characterize the magnetic properties
of the Zn
1-x
Co
x
O thin films with the applied field parallel to the film plane. The M-H
curve of Zn
1-x
Co
x
O film at 300 K with the Co concentration of x = 0.02 is shown in Fig.
6-3(a). A clear hysteresis loop was observed. It is obvious that the Zn
1-x
Co
x
O thin film
is magnetic up to 300 K. At room temperature, the coercivity (H
c
) is about 90 Oe and
the saturation magnetization is about 12.5 emu/cm
3
, in agreement with VSM results
obtained at room temperature. The coercivity of the film increased with decreasing
temperature, as shown in the inset of Fig. 6-3(a). According to our experimental results,
magnetic hysteresis loops were observed at least up to room temperature, and
National University of Singapore 101
CHAPTER 6: DEPENDENCE OF Zn
1-x
Co
x
O PROPERTIES ON Co CONCENTRATION
magnetism could be realized with Co doped into ZnO. However, the improvement was
limited. It is experimentally shown that most of the specimens revealed small
coercivity, and the maximum H
c
obtained without perceptible precipitates was less
than 300 Oe.
Figure 6-3(b) shows a typical H
c
dependence on temperature for Zn
1-x
Co
x
O thin
films with Co concentration x = 0.02. We observed that H
c
remains at about 100 Oe
near room temperature, and it increases with decreasing temperature. When
temperature goes below 100 K, it reaches about 200 Oe.
National University of Singapore 102
CHAPTER 6: DEPENDENCE OF Zn
1-x
Co
x
O PROPERTIES ON Co CONCENTRATION
-4000 -3000 -2000 -1000 0 1000 2000 3000 4000
-15
-10
-5
0
5
10
15
-200 0 200
-2
0
2
300 K
100 K
30 K
M (emu/cm
3
)
Magnetic Field (Oe)
Co 0.02
300 K
Magnetization (emu/cm
3
)
Magnetic Field (Oe)
(a)
0 50 100 150 200 250 300
80
100
120
140
160
180
200
220
Hc (Oe)
T (K)
(b)
Fig. 6-3(a) Magnetic loop of the thin film with Co concentration of x = 0.02 measured
at 300 K by SQUID. Inset: Enlarged view of the low field region to show the presence
of hysteresis and remanence for the samples measured at 300, 100 and 30 K; (b) Hc
dependence on temperature of the film with Co concentration of x = 0.02.
National University of Singapore 103
CHAPTER 6: DEPENDENCE OF Zn
1-x
Co
x
O PROPERTIES ON Co CONCENTRATION
6.2.3 Magnetic Properties of Zn
1-x
Co
x
O Thin Films Dependence on
Temperature
In order to obtain more details of the magnetic behaviors of Zn
1-x
Co
x
O thin films,
magnetization (M) dependence on temperature was measured via a SQUID. The
specimen was placed in an applied field parallel to the specimen plane at a temperature
ranging from 5 to 400 K. To obtain the temperature dependence of the magnetization,
zero-field-cooled (ZFC) and field-cooled methods were applied. For ZFC
magnetization measurement, the sample was first cooled down to 5 K in the absence of
an applied magnetic field, and the magnetization of the sample was measured in the
temperature range up to 400 K. On the other hand, for FC magnetization measurement,
the sample was cooled down to 5 K in an applied magnetic field, and measurements of
magnetic moment at each intermediate temperature were carried out at constant
applied fields.
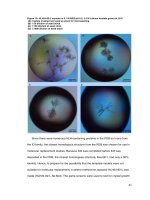
By Figure 6-4(a) we describe the temperature dependence of magnetization of the
Zn
1-x
Co
x
O film with Co concentration x = 0.05. The film was measured by the applied
field parallel to the specimen planes by means of ZFC and FC methods with the
magnetic field of 100, 1000 and 2000 Oe. Curie temperature for this film could not be
reached due to the operation limit of the SQUID equipment used. We estimate that the
T
c
is higher than 400 K. The curve obtained in a magnetic field of 100 Oe shows a
nonzero magnetization up to room temperature, which is in accordance with the M-H
curves. Discrepancy
between the ZFC and the FC curves at a lower magnetic field was
observed. The magnetization decreases slowly with decreasing temperature for
National University of Singapore 104
CHAPTER 6: DEPENDENCE OF Zn
1-x
Co
x
O PROPERTIES ON Co CONCENTRATION
temperatures up to 50 K. This is not concluded a rule in most DMS materials [12] but
rather an exception. References [13-15] attributed it to the effect of randomness and
disorder on the percolating FM clusters. In our view, it can be explained by spin glass
behaviors. Antiferromagnetic coupling leads to the decrease in magnetism under the
condition of ZFC. Comparing the curves under different magnetic fields, the point at
which ZFC and FC starts to deviate tends to shift toward low temperatures for large
magnetic fields. This is one of the features for spin glass [16,17]
. The magnetization
abruptly increases when the temperature is lower than 40K, exhibiting a low
temperature tail.
Using Figure 6-4(b) we can make out the difference, denoted by D, in
magnetization of FC and ZFC for Zn
1-x
Co
x
O thin films with Co concentration x = 0.05
measured in 100, 1000 and 2000 Oe. It is clear that, under the three different magnetic
fields, the difference D decreases with increasing temperature, and D is not zero at
temperatures close to 300 K. We can observe a ferromagnetic contribution in the film
up to 300 K, which is agreement with our M-H results. It is interesting to note that D
increases when the field is increased from the smallest value at 100 Oe to 1000 Oe, but
decreases again when the magnetic field increases beyond 2000 Oe. This is the result
of competition of positive magnetic moment from the film and negative magnetic
moment from the diamagnetic sapphire substrate.
National University of Singapore 105
CHAPTER 6: DEPENDENCE OF Zn
1-x
Co
x
O PROPERTIES ON Co CONCENTRATION
0 50 100 150 200 250 300 350 400 450
0
1
2
3
4
5
Excimer Laser
10 Hz, 3J/cm
2
5x10
-5
Torr
650
o
C
Co 0.05
0 100 200 300 400
0.15
0.20
0.25
0.30
Magnetization (emu/cm
3
)
Temperature (K)
100 Oe
2000 Oe
1000 Oe
Magnetization (emu/cm
3
)
Temperature (K)
(a)
100 Oe
0 50 100 150 200 250 300 350
0.0
0.1
0.2
0.3
0.4
0.5
100 Oe
1000 Oe
2000 Oe
D. M (emu/cm
3
)
Temperature (K)
(b)
Fig. 6-4(a) ZFC (open) and FC (solid) curves and (b) temperature dependence of the
difference magnetization between FC and ZFC magnetizations for Zn
1-x
Co
x
O thin
films with Co concentration 0.05 measured in 100 Oe, 1000 Oe and 2000 Oe.
National University of Singapore 106
CHAPTER 6: DEPENDENCE OF Zn
1-x
Co
x
O PROPERTIES ON Co CONCENTRATION
-50 0 50 100 150 200 250 300 350 400 450
0.0
0.1
0.2
0.3
0.4
0.5
0.6
0.7
0.8
Magnetization (emu/cm
3
)
Temperature (K)
(a)
100 Oe
0 50 100 150 200 250 300 350
0.0
0.1
0.2
0.3
Co 0.02
Co 0.05
Co 0.09
D. M (emu/cm
3
)
Temperature (K)
100 Oe
(d)
-50 0 50 100 150 200 250 300 350 400 450
0
1
2
3
4
5
6
Magnetization (emu/cm
3
)
Temperature (K)
(b)
1000 Oe
0 50 100 150 200 250 300 350
0.0
0.1
0.2
0.3
0.4
0.5
0.6
0.7
0.8
Co 0.02
Co 0.05
Co 0.09
D. M (emu/cm
3
)
Temperature (K)
1000 Oe
(e)
-50 0 50 100 150 200 250 300 350 400 450
1
2
3
4
5
6
7
8
Magnetization (emu/cm
3
)
Temperature (K)
(c)
2000 Oe
0 50 100 150 200 250 300 350
0.0
0.1
0.2
c3 0.05
c4 0.09
D. M (emu/cm
3
)
Temperature (K)
2000 Oe
(f)
Fig. 6-5 ZFC/FC curves measured at (a) 100 Oe, (b) 1000 Oe and (c) 2000 Oe,
respectively; and temperature dependence of the difference magnetization between FC
and ZFC magnetizations measured at (e) 100 Oe, (f) 1000 Oe and (g) 2000 Oe,
respectively, for Zn
1-x
Co
x
O thin films with Co concentration x = 0.02, 0.05 and 0.09,
denoted by squares, circles and triangles, respectively. Here, solid symbols denote FC
and open ones denote ZFC for (a-c).
National University of Singapore 107
CHAPTER 6: DEPENDENCE OF Zn
1-x
Co
x
O PROPERTIES ON Co CONCENTRATION
Figure 6-5(a-c) shows the ZFC and FC curves of Zn
1-x
Co
x
O films with different Co
concentrations at respective magnetic fields of 100, 1000 and 2000 Oe. All show
positive curvatures. The discrepant point at which ZFC and FC start to deviate can be
observed for all the curves, and these points decreases with increasing magnetic field.
From them, the discrepant points between the ZFC and the FC curves were estimated
and listed in Table 5-1. It revealed the behaviour of the discrepant point shifting. The
above properties are typical features for a fine particle system, such as
superparamagnetic or spin glass system.
To estimate the size of the clusters in a supermagnetic system, we proceed as
follows. The highest blocking temperature is reached when the magnetic field is much
smaller than the so-called anisotropy field [17]. Hence, when a very small magnetic
field is applied, the discrepancy is caused by a large anisotropy of the system which is
due to the structure formed by widely separated chains of Co atoms. The blocking
temperature (
) obtained at low magnetic field was used to estimate the mean size of
clusters [17] using the formula
B
T
u
BB
K
Tk
V
25
=
,
where V is the mean volume of the cluster and k
B
is the Boltzmann constant.
From the Table 6-1, the blocking temperature for the film with Co concentration x =
0.09 is estimated to be about 380 K. The anisotropy constant (
) of fine Co particle
is 7×10
u
K
5
J/m
3
[17]. Hence the cluster size is deduced to be about 4 nm. We should
observe such size of cluster under a HRTEM observation. However we did not observe
clusters in the Zn
1-x
Co
x
O with x < 0.1, suggesting that it should be explained using
National University of Singapore 108
CHAPTER 6: DEPENDENCE OF Zn
1-x
Co
x
O PROPERTIES ON Co CONCENTRATION
another system, such as spin glass system.
Table 6-1 The discrepant points (K) estimated from Fig. 5-5 (a-c)
x H 100 Oe 1000 Oe 2000 Oe
0.02 >400 >400
0.05 >400 400 360
0.09 380 360 350
From Fig. 6-5(b), we can see that when Co concentration increases from 0.02 to
0.09, the magnetization obtained at 1000 Oe was observed to decrease, which
coincides with the previous results in Fig. 6-2.
Figure 6-5(d-f) show the difference between FC and ZFC of the Zn
1-x
Co
x
O films for
different Co concentrations at a magnetic field of 100, 1000 and 2000 Oe, respectively.
For all of the curves, D decreases with increasing temperature, and films with lower
Co concentrations exhibit larger magnetization difference between FC and ZFC.
National University of Singapore 109
CHAPTER 6: DEPENDENCE OF Zn
1-x
Co
x
O PROPERTIES ON Co CONCENTRATION
0 100 200 300 400
0.0
0.2
0.4
0.6
0.8
1.0
Co 0.02
Co 0.05
Co 0.09
Magnetic moment (u
B
/Co)
Temperature (K)
1000 Oe
(a)
0 100 200 300 400
0.010
0.015
0.020
0.025
0.08
0.09
0.10
0.11
0.12
100 Oe
Co 0.02
Co 0.05
Co 0.27
Magnetic moment (u
B
/Co)
Temperature (K)
(b)
Fig. 6-6 Magnetic moment per Co atom dependence on temperature of the Zn
1-x
Co
x
O
thin films with different Co concentrations obtained at the magnetic field of (a) 1000
Oe and (b) 100 Oe.
National University of Singapore 110
CHAPTER 6: DEPENDENCE OF Zn
1-x
Co
x
O PROPERTIES ON Co CONCENTRATION
Figure 6-6 displays magnetic moment per Co atom, denoted by m, dependence on
temperature T for the films with different Co concentrations at a magnetic field of
1000 Oe and 100 Oe, respectively. The shapes of m-T curves are similar to those of
M-T curves, as shown in Fig. 6-6(a). To show the features of m-T curves for the
Zn
1-x
Co
x
O films with small Co concentrations, here we also present a m-T curve of the
Zn
1-x
Co
x
O film with x = 0.27. The m-T curve exhibits a typical ferromagnetic
behaviour [10], as shown in Fig. 6-6(b). For the film with a relatively lower Co
concentration, the value of magnetic moment per Co is higher. It agrees with our
previous result in Fig. 6-2.
6.2.4 Overview Studies of Magnetic Properties of Zn
1-x
Co
x
O Thin Films
In this section, we will show some results of samples which were obtained under
different experimental conditions and different Co concentrations. All these data were
obtained from M-H loops from AGM.
Figure 6-7(a-c) present an overview of the coercivity H
c
, magnetization M and
magnetic moment per Co atom (m) as a function of the Co concentration x. The data
scattered in the Fig. 6-7(a) figures indicates that there is no apparent dependence of
coercivity H
c
on Co concentration x. From Fig. 6-7 (b), the contribution of Co to
magnetization trends to decrease with increasing Co concentration, which coincides
with our previous results in Fig. 6-2. The inset of Fig. 6-7(c) shows a linear
relationship between the inverse of magnetic moment per Co atom and Co
concentration. Using the effective concentration (
s
x ), we can explain it by the formula
National University of Singapore 111
CHAPTER 6: DEPENDENCE OF Zn
1-x
Co
x
O PROPERTIES ON Co CONCENTRATION
0
/ MxMx
ss
= , where x stands for the Co concentration, which would have led to a
saturation moment
if the Co spins were fully aligned [18]. Hence, the linear
dependence of
on x indicates that
s
M
1−
m
s
x decreases with increasing x, which is
similar to that observed in the magnetic semiconductor (Cd, Mn)Se. This indicates that
the antiferromagnetic interactions counteract some part exchange interactions in the
Zn
1-x
Co
x
O system. In the inset of Fig. 5-7(c), the fitting line for the dependence of
on x is . Hence we have
1−
m xm 9.412.0
1
+−=
−
005.0
≈
x for . This
implied that basically at x around 0.005, all the Co ions have the contribution to the
total magnetic moment.
0
1
=
−
m
National University of Singapore 112
CHAPTER 6: DEPENDENCE OF Zn
1-x
Co
x
O PROPERTIES ON Co CONCENTRATION
0.00 0.05 0.10 0.15 0.20 0.25 0.30
20
40
60
80
100
120
140
Hc (Oe)
Co concentration (%)
0.00 0.05 0.10 0.15 0.20 0.25 0.30
0
5
10
15
20
Magnetization (emu/cm
3
)
Co concentration (%))
0.00 0.05 0.10 0.15 0.20 0.25 0.30
0
1
2
3
4
5
6
7
0.0 0.1 0.2 0.3
0
5
10
15
20
Linear Fit
m
-1
[µ
B
/Co]
-1
Co concentration x
m
-1
=-0.2+41.9x
m(µ
Β
/Co))
Co concentration x
(c)
Fig. 6-7 Coercivity, magnetization and magnetic moment per Co (m) versus Co
concentration x of series of Zn
1-x
Co
x
O thin films deposited at different DBPLD
processing parameters (different growth temperatures and vacuum pressures). The
inset shows m
-1
dependence on x.
National University of Singapore 113
CHAPTER 6: DEPENDENCE OF Zn
1-x
Co
x
O PROPERTIES ON Co CONCENTRATION
Based on our experimental results, though experimental results are a little scattered,
the trends are similar. Under the optimum experimental conditions mentioned before,
usually the M-H loop with coecivity around 100 Oe could be obtained.
6.3 Transport Properties of Zn
1-x
Co
x
O Thin Films
The resistivity and carrier density of the Zn
1-x
Co
x
O thin film with Co concentration
of x =0.015 were measured at room temperature by Hall effect measurement using a
Van der Pauw configuration. The transport properties were taken using the software of
the Hall effect system (Lakeshore 7500). By proper settings, such as field profile as
linear sweep with field reversal, maximum field as 8000G, removing the result values
near 0 field and taking the average values, the results from the Hall effect measurement
could be obtained, as shown in Table 6-2. The resistivity is between 101.9 mohm-cm
to 120 mohm-cm with the average resistivity around 102 mohm-cm, and the carrier
density is between -1.71×10
18
cm
-3
to -2.98×10
18
cm
-3
with the average carrier density
about -2.2×10
18
cm
-3
. It can been seen that the film is n-type semiconductor. To
confirm its semiconductor behaviour, we tested its electrical properties at 77 K. It was
found that the film resistivity increases while its carrier density decreases slightly as
the temperature decreases to 77 K (refer to Table 6-2). This implied that the film
shows n-type semiconductor properties.
National University of Singapore 114
CHAPTER 6: DEPENDENCE OF Zn
1-x
Co
x
O PROPERTIES ON Co CONCENTRATION
Table 6-2 Electrical properties obtained from the Hall measurement of the film
Zn
0.985
Co
0.015
O
Testing temperature
(K)
Type Resistivity
(mΩ-cm)
Carrier density
(cm
-3
)
Room temperature n 102 2.2x10
18
77 n 167 1.9x10
18
Figure 6-8 displays the variation in the Hall resistivity and carrier density of the thin
films as a function of Co concentration. The Hall resistivity tended to increase, while
carrier density tended to decrease with Co concentration until a certain Co
concentration is achieved. However the Hall resistivity decreased with the further
increase of the Co concentration; namely the Hall resistivity tended to decrease with
carrier density especially at low Co concentration, which correspond to the general
relationship of resistivity and carrier density in semiconductors [19]. With increasing
Co concentration, the compensation of oxygen deficiency is enhanced, thus the carrier
density decreased. Hence, the Hall resistivity increased with Co concentration.
However, further increasing Co concentration did not result in the further increase of
the resistivity; instead, the resistivity decreased with Co concentration. From our
previous HRTEM data (refer to section 5.3 for details), it follows that when more Co
are incorporated, the lattice crystal structure tends to change and more defects are
induced. The presence of defects may result in the formation of precipitates. The
transport behaviors related to these metal precipitates may be understood by a hopping
conduction mechanism over a percolation threshold [20]. The term “percolation” was
used, conceptually. The simplest problem in that theory are lattice problems, one great
National University of Singapore 115
CHAPTER 6: DEPENDENCE OF Zn
1-x
Co
x
O PROPERTIES ON Co CONCENTRATION
importance of which is the notion of a “percolation threshold”, which is defined as the
upper limit of the values, which varies with concentration [20]. According to the
theory, the connectivity of a pair of impurities depends on their separation.
Dependence of the logarithm of the conductivity on the “mean” separation between
impurities, showing that resistance between any two sites depends on their separation.
With gradually increases concentration until the condition of percolation over
conducting resistances reaches. This obviously occurs at percolation threshold. Thus,
the resistivity of the films peak at Co concentration of x = 0.1 and decreases with
increasing Co concentration beyond this concentration. At this point, the strongest
localization of electrons occurred due to the highest degree of disorder of the lattice.
In Fig. 6-8, except for the point at x = 0.015, Hall mobility decreases with increasing
Co concentration until x = 0.1. For x > 0.1, Hall mobility increases with Co
concentration, indicating more dopant ions scattering in this range.
0.00 0.05 0.10 0.15 0.20 0.25
10
20
30
40
mobility
µ
H
(cm
2
/VS)
Co concentration x
0.0
2.0x10
18
4.0x10
18
6.0x10
18
Excimer Laser
10 Hz, 3J/cm
2
5x10
-5
Torr
650
o
C
density
0.2
0.4
0.6
N (1/cm
3
)
resistivity
ρ
H
(Ω cm)
Fig. 6-8 Variation in Hall resistivity, carrier density and Hall mobility with Co
concentration x of Zn
1-x
Co
x
O thin films.
National University of Singapore 116
CHAPTER 6: DEPENDENCE OF Zn
1-x
Co
x
O PROPERTIES ON Co CONCENTRATION
In the following, more evidences will be given. Figure 6-9 shows the variation in
the Hall resistivity with Co concentration of Zn
1-x
Co
x
O thin films grown at 650 and ℃
750 . ℃ Both the films grown at 650 and 750 ℃℃ have the similar variety in
resistivity. It can be seen that the films obtained at 650 have higher resistivitities.
℃
When grown at 750 , the film trends to have larger grain size and less crystal defec℃ ts,
thus less electron traps. Larger carrier concentration leads to lower resistivity.
0.00 0.05 0.10 0.15 0.20 0.25
0.0
0.1
0.2
0.3
0.4
0.5
0.6
Excimer Laser
10 Hz, 3J/cm
2
5x10
-5
Torr
650
o
C
Hall Resistivity (Ω cm)
Co concentration x
650
o
C
750
o
C
Fig. 6-9 Variation in Hall resistivity with Co concentration of Zn
1-x
Co
x
O thin films
grown at 650
℃ and 750 ℃.
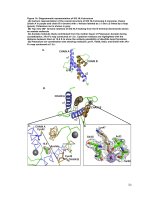
Using Figure 6-10, we analyze the resistance dependence on temperature (T) and
found that for temperature above 80 K, the resistance decreases with increasing
temperature. The inset of Fig. 6-10 shows a plot of the logarithm of the resistance
National University of Singapore 117
CHAPTER 6: DEPENDENCE OF Zn
1-x
Co
x
O PROPERTIES ON Co CONCENTRATION
versus 1/T. When the temperature is above 80 K, the graph of the logarithm of the
resistance versus 1/T shows a non-linear dependence. This indicates that more than
one mechanism is involved in this temperature range. The kink near 160 K divide the
curve into two parts which are quasi-linear. From these quasi-linear parts, we can
establish the activation energy in the range of 80 K -160 K and 160 K - 300 K of the
Zn
1-x
Co
x
O thin film. Refer to Table 6-3 for details. The conductance can be expressed
by the simple form [21]:
]exp[
0
k
T
EE
GG
dc
−
−=
,
where
stands for the activation energy and G
dca
EEE −=
0
is a temperature
independent factor. Therefore, the thermal activation energies of conductance can be
estimated from the nearly linear segments near 300 K, as listed in Table 6-3. From
Table 6-3 one can see that activation energy in the range of 80 - 160 K is smaller than
that obtained in the range near 300 K. From the physical point of view, when the Fermi
level falls in the localized region, charge transport occurs either via thermal activation
of carriers into the delocalized state region or by activated hopping between localized
states [20, pp. 36]. The conductivity of an extrinsic semiconductor doped with donors
depends on the electron concentration and the drift mobility. In our case, activated
hopping dominates the charge transport in the range of 80 - 160 K compared with that
in the range of 160 – 300 K. Transport via thermal activation is easier when
temperature increases. The activation energy corresponding to hopping conduction is
smaller compared to that corresponding to band conduction (thermal activation).
Hence, when temperature decreased, the activation energy decreased. From Table 6-3,
National University of Singapore 118
CHAPTER 6: DEPENDENCE OF Zn
1-x
Co
x
O PROPERTIES ON Co CONCENTRATION
we can also observe that the thermal activation energy decreases with increasing Co
concentration in the range of 160 – 300 K. The activation energy for hopping
conduction is due to the dispersion of impurity levels. The dependence on Co
concentration can be explained by the mechanism of activated hopping between
localized states using the variation in the probability of a jump between two impurities
[20, pp. 36].
50 100 150 200 250 300
1.0
1.5
2.0
0.003 0.006 0.009 0.012
7.8
8.0
8.2
8.4
8.6
ln(ρ)
T
-1
(1/K)
R(T)/R(300k)
Temperature (K)
Co 0.09
Fig. 6-10 A typical resistance dependence on temperature for Zn
1-x
Co
x
O thin film at x
= 0.09. Inset shows the plot of the logarithm of the resistance versus 1/T. The straight
lines are fitting lines.
Table 6-3 Evaluated activation energy values (eV) of Zn
1-x
Co
x
O at different
temperatures T
Temperature (K) x = 0.02 x = 0.09 x = 0.2
80-160 5.52 4.31 5.04
160-300 24.4 16.6 14.71
National University of Singapore 119
CHAPTER 6: DEPENDENCE OF Zn
1-x
Co
x
O PROPERTIES ON Co CONCENTRATION
6.4 Summary
In this chapter, we studied the magnetic and electrical properties of Zn
1-x
Co
x
O thin
films and obtained the following conclusions:
z Magnetism could be realized by even a very low Co concentration for Zn
1-x
Co
x
O
thin films. However, the improvement of magnetism was limited. The Curie
temperature is higher than 400 K.
z The magnetic moment per Co atom decreases with increasing Co concentration.
When the Co concentration is over 0.1, magnetic moment per Co atom stops
decreasing. The magnetization decreases with decreasing temperature. Deviation
between the ZFC and the FC curves at a lower magnetic field was observed and the
point at which ZFC and FC start to deviate tends to shift toward low temperatures
for large magnetic fields. Some spin glass behaviors can be observed.
z There is no evidence to show the apparent dependence of H
c
on Co concentration
z The films have doped-semiconductor properties. The Hall resistivity tended to
increase, while carrier density tended to decrease with Co concentration until a
certain Co concentration is achieved. However the Hall resistivity decreased with
the further increase of the Co concentration; namely the Hall resistivity tended to
decrease with carrier density especially at low Co concentration. The transport
behaviors of the films can be understood by hopping mechanisms. Activation
energy in the range of 80 - 160 K is smaller than that obtained in the range near
300 K. The thermal activation energy of Zn
1-x
Co
x
O decreases with increasing Co
concentration in the range of 160 – 300 K.
National University of Singapore 120