Study on advanced gate stack using high k dielectric and metal electrode
Bạn đang xem bản rút gọn của tài liệu. Xem và tải ngay bản đầy đủ của tài liệu tại đây (7.11 MB, 139 trang )
STUDY OF ADVANCED GATE STACK USING
HIGH-K DIELECTRIC AND METAL ELECTRODE
HWANG WAN SIK
NATIONAL UNIVERSITY OF SINGAPORE
2008
Founded 1905
STUDY OF ADVANCED GATE STACK USING
HIGH-K DIELECTRIC AND METAL ELECTRODE
HWANG WAN SIK
A THESIS SUBMITTED FOR
THE DEGREE OF DOCTOR OF PHILOSOPHY
NATIONAL UNIVERSITY OF SINGAPORE
2008
Acknowledgments i
ACKNOWLEDGMENTS
First of all, I would like to express my heartfelt thanks to my two supervisors,
Professor Yoo Won Jong and Professor Cho Byung Jin. I have been truly blessed to
purchase Ph. D. under their supervision. Their guidance, support, and generosity have
made me where I am today. I thank them for developing my potential and personality
as well. I would like to take this opportunity to express my gratitude to my co-
supervisor, Professor Chan Siu Hung. This thesis would not have been completed
without his support and advice.
I would also like to sincerely thank other advisors and teaching staffs in Silicon
Nano Device Lab (SNDL): Professor Li Ming Fu, Associate Professor Ganesh
Samudar, Dr. Zhu Chunxiang, Dr. Lee Sungjoo, and Dr. Yeo Yee-Chia for their
valuable comment and suggestions on my research work during internal meetings and
seminars. The technical staffs in SNDL are also gratefully acknowledged: Mr. Yong
Yu Fu, Patrick Tang, Mr. O Yan Wai Linn, and Lau Boon Teck.
Many thanks to my fellows and vital friends: Wang Xinpeng, Lim Eu-Jin, Pu
Jing, Zhang Lu, He Wei, Shen Chen, Gao Fei, Li Rui, Song Yan, Chen Jingde, Tan
Kian Ming, Yang Weifeng, Eric Teo Yeow Hwee, Dr. Zhu Ming, and Rinus Lee Tek
Po for their useful discussion and everlasting friendships. Last but not least, my special
gratitude to Mr. Whang Sung Jin, Ms. Oh Hoon Jung, and Mr. Choi Kyu Jin for their
help in many ways; their care and mature experience in semiconductor technology.
My deepest thanks to my wife, Jin Hye Hyun, whose encouragement have
made this work possible. Special recognition to my parents for their sacrifice and
unconditional love.
Summary ii
SUMMARY
High-K dielectric and metal electrode are intensively studied to replace current
SiO
2
dielectric and poly-Si electrode for continuous success of CMOS technology. The
study on the formation of advanced gate stacks using high-K dielectric and metal
electrode is included within the scope of this thesis. Several challenges regarding
formation of metal electrode (chapter 2), high-K removal (chapter 3), hard mask effect
on formation of metal electrode (chapter 4), and selection of metal electrode (chapter
5) are identified and addressed in this work.
For the integration of metal electrode in the gate stacks, plasma etching
properties of metal electrode such as TaN, TiN, and HfN are discussed on anisotropic
profile and high selective etching over underlying HfO
2
dielectric in chapter 2. High
selective etching of metal electrode is achieved by the addition of O
2
in Cl
2
. The etch
rates of metal electrode slightly increase while etch rates of Hf-based high-K dielectric
decrease by adding small amount of O
2
in Cl
2
. Besides the high selective etching of
metal electrode over Hf-based high-K dielectric, anisotropic profile is obtained by the
appropriate passivation film on the sidewall of the gate stacks. The quality of this
sidewall passivation film is analyzed by XPS analysis. Anisotropic profile and high
selectivity over underlying HfO
2
could be achieved based on these results.
In addition to etching of metal electrode, removal of high-K dielectric is
another big issue for a successful gate stack formation. In this work, alternative to wet
etching or plasma etching for high-K dielectric removal, mixed process consisting of
plasma treatments followed by wet removal will be proposed for removal of high-K
dielectric on S/D regions in chapter 3. The feasibility of the low ion energy assisted
wet removal process for short channel high-K MOS device fabrication is demonstrated
by the smaller shift of threshold voltage and the higher driving current, compared to
Summary iii
the high ion energy assisted wet removal process as well as the wet-etching-only
process.
Introducing new materials in the gate stacks as well as continuous scaling down
faces challenges to meet the requirements of various device performance and low
production cost. This also requires various attempts to develop small gate patterning
technology. From these studies, SiO
2
or Si
3
N
4
, so-called hard mask, was proposed to
replace conventional PR mask. In chapter 4, the effect of SiO
2
or Si
3
N
4
on etching
properties of metal gates is discussed. Reduced etching rates of advanced metal gate
(TaN, TiN, and HfN) due to the SiO
2
/ Si
3
N
4
hard masks are observed in Cl
2
plasma. Si
and O released from hard masks react with metal surfaces newly exposed to the plasma
during etching, and the metal oxides formed on the etched surface retard the etch rates.
At last, selection of appropriate gate materials is still a big task to handle for
advanced gate stack formation. The selection of materials in the gate stack is an
ongoing research work, and has not been known for future gate stacks. So far,
transition metal nitrides have been studied intensively for NMOS application whereas
high work function materials have been proposed for PMOS. In this work, new gate
metal electrode in the form of transition metal carbide is proposed and demonstrated
for NMOS in chapter 5. Various metal carbides such as HfC, TaC, WC, and VC have
been evaluated to implement metal carbides in the gate stacks. Based on the intensive
study regarding basic material and electrical properties, HfC
was proposed and
demonstrated for NMOS application. HfC
on HfO
2
showed a very low work function
value, excellent thermal stability and diffusion barrier properties, and negligible Fermi
level pinning. Therefore, the hafnium carbide is a promising candidate for NMOS gate
electrode material for gate-first metal gate CMOS process.
Contents
iv
CONTENTS
ACKNOWLEDGEMENTS i
SUMMARY ii
CONTENTS iv
LIST OF FIGURES viii
LIST OF TABLES xv
LIST OF SYMBOLS xvi
LIST OF ACRONYMS xvii
CHAPTER 1. INTRODUCTION
1.1 Overview 1
1.2 MOSFET Scaling: Opportunities and Challenges 2
1.2.1 Limitation of SiO
2
as the Gate Dielectrics 3
1.2.2 Post SiO
2
Dielectrics: High-K Dielectrics 4
1.2.3 Limitation of Poly-Si as Gate Electrode 6
1.2.4 Post Poly-Si Electrode: Metal Electrode 9
1.3 Challenges in Formation of Metal / High-K Gate Stack 10
1.3.1 Plasma Etching of Metal Electrode in Halogen Gases 11
1.3.2 Selective Removal of High-K Dielectric 12
1.3.3 Photoresist Mask in Advanced Gate Stack 13
1.3.4 Challenges of Metal Electrode Selectioin 14
1.4 Research Scope and Major Adhievement in this Thesis 17
References 20
Contents
v
CHAPTER 2. INVESTIGATION OF ETCHING PROPERTIES OF
METAL NITRIDES / HIGH-K GATE STACKS USING
INDUCTIVELY COUPLED PLASMA
2.1 Introducntion 28
2.2 Experimental Details 29
2.3 Results and Discussion 32
2.3.1 Etch Rate versus Bias Voltage 32
2.3.2 O
2
Effects on Etch Rates for High Selectivity 34
2.3.3 Optical Emission Spectroscopy 38
2.3.4 Residue Analysis by XPS 41
2.3.5 Etching Metal Nitrides / HfO
2
Gate Stack 44
2.3.6 Residue Analysis in the Gate Stacks after Metal Etching 45
2.4 Summary 50
References 52
CHAPTER 3. LOW ENERGY N
2
ION BOMBARDMENT FOR
REMOVAL OF (HFO
2
)
X
(SION)
1-X
IN DILUTE HF
3.1 Introduction 56
3.2 Experimental Details 58
3.3 Results and Discussion 59
3.3.1 Properties of (HfO
2
)
x
(SiON)
1-x
59
3.3.2 Ion Assisted Wet Removal of (HfO
2
)
x
(SiON)
1-x
using N
2
Plasma 61
3.3.3 XPS on (HfO
2
)
0.6
(SiON)
0.4
after N
2
Plasma Treatments 65
3.3.4 Electrical Properties of TaN / (HfO
2
)
0.6
(SiON)
0.4
/ Si Gate Stack 68
3.4 Summary 70
References 71
Contents
vi
CHAPTER 4. EFFECTS OF SIO
2
/ SI
3
N
4
HARD MASK ON
ETCHING PROPERTIES OF METAL GATES
4.1 Introduction 75
4.2 Experimental Details 77
4.3 Results and Discussion 78
4.3.1 Etch Rate with Hard Masks 78
4.3.2 XPS Analysis for Various Mask Processes 81
4.3.3 Degradatioin of Surface Properties with SiO
2
Mask 88
4.4 Summary 90
References 91
CHAPTER 5. A NOVEL HAFNIUM CARBIDE METAL GATE
ELECTRODE FOR NMOS DEVICE APPLICATION
5.1 Introduction 93
5.2 Experimental Details 94
5.3 Results and Discussion 95
5.3.1 Material and Electrical Properteis of Several Metal Carbides 95
5.3.2 HfC Metal Carbides for NMOS Applications 100
5.4 Summary 106
References 107
CHAPTER 6. CONCLUSIONS AND RECOMMENDATIONS
6.1 Summary 108
6.1.1 Study of of Etching Properties of Metal Electrode Gate Stacks 108
6.1.1 Study of Wet Removal of Hihg-K Dielectrics 109
6.1.2 Study of Effects of SiO
2
/ Si
3
N
4
Hard Mask on Metal Etching 110
6.1.4 Study of Metal Carbide Electrodes for Gate Stacks 110
6.2 Suggestions for Future Work 111
References 113
Contents
vii
Appendix
List of Publications 114
List of Figures viii
LIST OF FIGURES
Fig. 1.1 Number of CPU transistor from 1970s to present, showing the
device scaling according to Moore’s Law; © Intel Corporation.
2
Fig. 1.2 Gate leakage current density of some high-K dielectrics as a
function of EOT, compared with the gate leakage specifications for
high-performance (HP), low-operating-power (LOP), and low-
standby-power (LSTP) applications according to ITRS 2006 update.
6
Fig. 1.3
Fig. 1.4
Fig. 1.5
The energy band diagram of an NMOS device showing the poly-Si
gate depletion effect.
Additional increase of electrical thickness caused by gate electrode
depletion and quantum effects vs. projection years.
Work function of various metals for CMOS application
7
8
16
Fig. 2.1 Schematic illustration of the XPS experiment: The substrate is tilted
to adjust the electron energy analyzer: (a) 45 º and (b) 30 º. H:
150±20nm, L: 100±10nm, W: 250±50nm.
31
Fig. 2.2 Etch rates of metal nitrides and dielectrics as a function of square
root bias voltage in (a) Cl
2
and (b) HBr. The experiments are
performed at a pressure of 10mTorr and a source power of 400W.
32
Fig. 2.3 Etch rates of metal nitrides as a function of O
2
concentration in (a)
Cl
2
and (b) HBr. In the range of O
2
concentration less than 2 %,
dilute gas of He (80 %) / O
2
(20 %) is used. That is, additional He is
incorporated in this range. The experiments are performed at a
pressure of 10mTorr, a source power of 400W, and a bias voltage of
-200V
dc
.
35
List of Figures ix
Fig. 2.4 (a) Optical emission intensity of chlorine as a function of O
2
concentration in Cl
2
plasma. 777nm is for O, and 726nm and 741nm
are for Cl (b) Ion current density as a function of O
2
concentration in
Cl
2
and HBr respectively. The ion current density is determined by J
i
= P
b
/ (V
dc
× S). In the range of O
2
concentration less than 2 %,
dilute gas of He (80 %) / O
2
(20 %) is used.
36
Fig. 2.5
RMS roughness of films before etching and after etching in Cl
2
and
HBr. The experiments are performed for 20s, at a pressure of
10mTorr, a source power of 400W, and a bias voltage of -200V
dc
.
37
Fig. 2.6
Fig. 2.7
Fig. 2.8
Fig. 2.9
Temporal change of optical emission intensity during TaN / HfO
2
gate etching in Cl
2
. 256 nm and 305 nm are for Cl
2
, 357 nm is for N,
and 520 nm is for Ta-Cl containing byproducts. The experiments are
performed at a pressure of 10mTorr, a source power of 400W, and a
bias voltage of -200V
dc
.
Emission intensities detected during etching of Ta and TaN in Cl
2
at
various N concentrations. 295.3 nm, 315.9 nm, 353.7 nm, and 357.7
nm are for N
2
, and 336.0 nm is for NH. The experiments are
performed at a pressure of 10mTorr, at a source power of 400W, and
a bias voltage of -200V
dc
.
Schematic diagrams showing the residue formation during TaN
etching in Cl
2
with various collection sites. Site I: TaN substrate,
Site II: Pt substrate (2 cm away from TaN), Site III: Pt substrate (6
cm away from TaN): (a) side view, (b) top view. Experiments for
the residue formation during TiN and HfN etching in Cl
2
were
performed by the same method.
XPS spectra from the residues on the gate stack after Cl
2
etching
(refer to Fig. 2.1 (a)): (a) Ta 4f, (b) Hf 4f, and (c) O 1s.
38
39
40
43
List of Figures x
Fig. 2.10
Fig. 2.11
Fig. 2.12
Fig. 2.13
Fig. 2.14
Fig. 2.15
Fig. 2.16
SEM of (a) PR / BARC / TaN / HfO
2
/ Si gate stack and (b) SiO
2
mask / TaN / HfO
2
/ Si gate stack etched in Cl
2
. The experiments are
performed at a pressure of 10mTorr, a source power of 400W, and a
bias voltage of -200V
dc
.
SEM images of etched HfN surface in Cl
2
with etching time; (a) 10s,
(b) 15s, (c) 20s, and (d) 25s. The inset shows an evolution of surface
topography (height) using AFM with various etching time; X: 0.25
um/div, Y: 70nm/div. The experiments were performed at a pressure
of 10mTorr, source power of 400W, and bias voltage of -200V
dc
.
SEM images of TaN gate stack with photoresist masks after etching
(a) in pure Cl
2
and (b) Cl
2
/ O
2
. The experiments were performed at a
pressure of 10mTorr, source power of 400W, and bias voltage of -
200V
dc
.
SEM images of (a) TaN, (b) TiN and (c) HfN gate stack with SiO
2
mask after etching in Cl
2
. The experiments were performed in the
same condition as in fig. 2.12.
(a) TEM image of TaN metal electrode gate stack after Cl
2
etching,
revealing thick residues formation on the sidewall (etching was done
in DPS); SEM image of TaN metal electrode (b) before and (c) after
DHF cleaning.
XPS spectra from the residues on the gate stack after Cl
2
etching: (a)
and (b) Si 2p, (c) and (d) Cl 2p: (a) and (c) top view: (b) and (d) side
view.
AFM images of etched surface of HfN films after 1% DHF dipping
with the time; (a) 5 s, (b) 15 s, (c) 40 s; (d) SEM image of metal gate
stack after etching 5min in 1% DHF, showing HfN film is laterally
etched.
44
46
47
47
48
49
50
List of Figures xi
Fig. 3.1 XRD intensity as a function of x in the (HfO
2
)
x
(SiON)
1-x
; square: as-
deposited, circle: annealed at 1000
o
C for 30 s in N
2
environment,
the thickness of the each film is around 9 nm.
60
Fig. 3.2 (a) SIMS data showing intensity changes (I
after
/ I
before
) of atomic
percentage of Hf, O, Si, and N on 9 nm (HfO
2
)
0.6
(SiON)
0.4
on Si
substrate before and after the N
2
plasma. It was performed at the
source power of 400 W, bias power of 400W for 3 min. (b) N
2
plasma affected depth at various bias power and treatment time. The
damaged depth was estimated by the etch rates in 1% DHF,
assuming that the initial fast etching of the film within 5 s upon the
N
2
plasma is attributed to the amorphous structure. The damaged
region of amorphous (HfO
2
)
x
(SiON)
1-x
was removed completely in
the same condition.
62
Fig. 3.3 Wet etching rates of the 3.5 nm (HfO
2
)
0.6
(SiON)
0.4
which was
annealed and N
2
plasma was conducted at various bias power for 15
s (wet etching: 1% DHF).
64
Fig. 3.4 XPS spectra of (a) Si 2p, (b) Hf 4f, and (c) N 1s from
(HfO
2
)
0.6
(SiON)
0.4
. Each of XPS signals is taken before and after the
N
2
plasma for comparison.
65
Fig. 3.5 XPS spectra from TaN / (HfO
2
)
0.6
(SiON)
0.4
/ Si gate stack after ion
assisted wet removal of (HfO
2
)
0.6
(SiON)
0.4
using N
2
plasma; initial
physical thickness of (HfO
2
)
0.6
(SiON)
0.4
was 3.5nm. N
2
plasma was
generated at various bias powers for 15s, followed by 1% DHF
etching for 1 min except the case of no N
2
plasma process which
went through in DHF for 20 min.
67
Fig. 3.6 Threshold voltage (V
th
) of TaN / (HfO
2
)
0.6
(SiON)
0.4
/ p-Si gate stack
as a function of gate length from the various N
2
plasma conditions
for high-K wet removal. (a) The N
2
plasma was performed at
69
List of Figures xii
various bias power for 15s, followed by 1% DHF wet etch. For
comparison, the result of the wet-etch-only process is included; it is
obtained after dipping in DHF for 20 min, however, the film is not
clearly removed as shown in Fig. 6. (b) The N
2
plasma was
conducted for various times.
Fig. 4.1 Gate stacks of metal nitrides (TaN, HfN and TiN) or poly-Si / HfO
2
/ Si wafer with (a) SiO
2
, (b) Si
3
N
4
, and (c) PR masks; thin SiO
2
layer
is inserted between Si
3
N
4
mask and TiN to enhance adhesion under
Si
3
N
4
mask in (b).
77
Fig. 4.2 Etch rates of (a) TiN and (b) poly-Si as a function of etch time for
different masks (SiO
2
, Si
3
N
4
, and PR).
79
Fig. 4.3 Cross-sectional SEM images of etched TiN gate stacks with
different masks; (a) SiO
2
mask, (b) Si
3
N
4
mask, and (c) PR mask.
80
Fig. 4.4 XPS spectra of (a) Ti 2p from TiN gate stacks and (b) Si 2p from
poly-Si gate stacks with various masks; solid data points: before
etching, open data points: after etching for 15s. All samples were
dipped into 1% diluted hydrofluoric acid (DHF) for 20s before
etching in order to remove any native grown metal oxides. The Ti 2p
peak is composed of spin orbit doublets, each separated by 6 eV.
Only Ti 2p
3/2
is indicated in (a). All XPS analyses were performed
using a monochromatized Mg Kα source on constant pass energy of
10eV.
83
Fig. 4.5 XPS spectra of O 1s peak after etching for 15s with various masks.
(TiO
2
)
1-X
(SiO
2
)
X
shows a wide range of binding energy according to
the ratio of TiO
2
to SiO
2
.
84
Fig. 4.6 Schematic illustration on the behavior of various byproducts
generated from the etching of TiN gate stacks for different masks;
86
List of Figures xiii
(a) SiO
2
mask, (b) Si
3
N
4
mask, and (c) PR mask. Oxygen generated
from inside the chamber can be a source for the reaction since
working pressure is 10 mTorr and base pressure is 1 mTotrr in these
experiments. There is thin SiO
2
layer inserted between Si
3
N
4
mask
and TiN to enhance adhesion under Si
3
N
4
mask.
Fig. 4.7 Concentration of elements from the etched TiN gate stacks as a
function of etch time for different masks; (a) SiO
2
mask, (b) Si
3
N
4
mask, and (c) PR mask.
87
Fig. 4.8 Change of RMS roughness of the etched TiN surface for various
masks; negative and positive values in y axis represent the decrease
and increase of surface roughness after etching compared to before
etching respectively.
88
Fig. 4.9 AFM morphology of TiN surface as a function of etch time. The
etching experiments are performed at a pressure of 10 mTorr, a
source power of 400W, and a bias voltage of -200V
dc
; (a) 0 s, (b) 10
s, (c) 15 s, and (d) 20 s; 0.2μm/x, 10nm/y.
89
Fig. 5.1 XPS spectra of the sputtered (a) TaC , (b) HfC, (c) WC, and (d) VC
after RTA at 950
o
C for 30s. Existence of phase is consistent with
phase diagram information; one phase for HfC, two phases for TaC,
and four phases for VC, in addition, there is no stable single phase
for WC below 1000
o
C, in other word, W and WC coexist.
95
Fig. 5.2
Fig. 5.3
Carbon- (a)Ta, (b)Hf, (c)W, and (d)V phase diagram. Homogeneity
range is shown in shadow section. The trend of homogeneity phase
of each metal carbide is consistent with XPS results as shown in
fig.5.1.
The normalized C-V curves of various metal carbides on SiO
2
.
96
97
List of Figures xiv
Fig. 5.4 Heats of formation of interstitial carbides. Heat of formation
indicates thermal stability. Lower (more negative) heat formation
value indicates better thermal stability.
98
Fig. 5.5 ΔEOT ( EOT after RTA minus EOT before RTA) for various metal
electrodes. ΔEOT results are well matched to the heat of formation
trend.
99
Fig. 5.6 AES depth profiles of TaN / HfC
/ HfO
2
and TaN / TaC
/ HfO
2
gate
stacks.
100
Fig. 5.7 V
FB
versus EOT for metal carbides on HfO
2
or SiO
2
gate dielectrics.
101
Fig. 5.8 Effective work functions for various gate electrodes and dielectrics
102
Fig. 5.9 Gate leakage currents of TaC, TaN, and HfC on SiO
2
under negative
gate bias.
102
Fig. 5.10 TEM images of HfC, TaC, and TaN on HfO
2
after annealing at
950
o
C for 30s. Interfacial layer (IL) between HfO
2
and Si is minimal
for HfC, demonstrating good oxygen diffusion barrier property of
HfC.
103
Fig. 5.11
Fig. 5.12
Thickness dependence of work function for TaC, TaN, and HfC on
HfO
2
. Thicker (at least 20 nm or more) HfC is required to ensure
band-edge work function.
XRD patterns of HfC film. The HfC lattice increase due to oxygen
residual.
104
105
Fig. 5.13 TEM images of HfC on HfO
2
. FCC HfC and HfO
2
coexist in HfC
when thickness of HfC is thin, whereas only FCC HfC exists in HfC
for thicker deposited HfC.
105
List of Tables xv
LIST OF TABLES
Table 1.1 Gate dielectric technology requirements – selected data from latest
ITRS- 2006 update.
4
Table 1.2
CD increase of gate length @ 89
o
=3.5nm.
12
Table 2.1
Thermodynamic data of reaction of various etch products and
residues that can be generated by etching the metal nitride films in
Cl
2
/ HBr / O
2
plasma.
34
Table 2.2 Composition (atomic %) of residues detected by XPS from SiO
2
/
TaN / HfO
2
/ Si gate stack after Cl
2
or HBr etching (refer to Fig.
2.1).
41
Table 3.1 Wet etching properties of Hf-based high-K dielectrics with dielectric
constants and crystallization temperatures. Nitridation also helps to
increase crystallization temperature all the cases. *source/drain
(S/D) activation annealing at 900
o
C for 30s.
59
List of Tables xvi
LIST OF SYMBOLS
C
ox
Gate dielectric capacitance
E
i
Ion energy
E
c
Silicon conduction band edge
E
F,m
Fermi level of metal electrode
E
g
Silicon bandgap
E
th
Threshold ion energy
E
vac
Vacuum energy level
E
v
Silicon valence band edge
ΔG
f
º
Gibb’s free energy of formation
hp
Industry’s most aggressive half-pitch target
J
g
Gate leakage current density
J
i
Ion current density
K
Dielectric permittivity constant
N
b
Doping concentration of Si substrate
P
b
Bottom power
Q
d
Total depletion charge in the channel region
Q
ox
Equivalent oxide charge density at the oxide/Si
S
Surface area of the wafer
t
eq
Equivalent oxide thickness
T
high-k
Thickness of high-k film
V
d
Drain voltage
V
dc
Self-bias voltage
V
FB
Flat-band voltage
V
g
Gate voltage
V
th
Threshold voltage
W
d poly
Thickness of poly-Si depletion layer
ε
M
Effective permittivity of M film
Φ
B
Difference between Fermi-level and intrinsic level
Φ
M
Metal work function
Φ
MS
Work function difference between metal electrode and
silicon substrate
Φ
Si
Silicon work function
List of Acronyms xvii
LIST OF ACRONYMS
AES Auger electron spectroscopy
ALD Atomic layer deposition
AFM Atomic force microscopy
CD Critical dimension
CES Constant field scaling
CMOS Complimentary metal oxide semiconductor
C-V, CV Capacitance versus Voltage
CVD Chemical vapor deposition
CVS Constant voltage scaling
DHF Diluted hydro fluoric acid
DPS
TM
Decoupled plasma source
EOT Equivalent oxide thickness
FCC Face-centered cubic
FDSOI Fully-depleted silicon on insulator
FET Field effect transistor
F-N Fowler-Nordheim
FGA Forming gas annealing
FinFET Fin field effect transistor
FLP Fermi-level pinning
FUSI Fully silicided
HRTEM High resolution transmission electron microscopy
HP High performance
IC Integrated circuit
ICP Inductively coupled plasma
I-V, IV Current versus voltage
ITRS International technology roadmap of semiconductors
LOP Low operation power
LPCVD Low pressure chemical vapor deposition
LSTP Low standby power
NMOS(FET) n-channel MOSFET
List of Acronyms xviii
MOCVD Metal organic chemical vapor deposition
MOSFET Metal-oxide-semiconductor field effect transistor
MPU Microprocessor unit
OES Optical emission spectroscope
PECVD Plasma enhanced chemical vapor deposition
PDA Post deposition anneal
PMOS(FET) p-channel MOSFET
PR Photo resist
PVD Physical vapor deposition
RF Radio frequency
RMS Root mean square
RTA Rapid thermal annealing
S/D Source and drain
SEM Scanning electron microscope
SIMS Secondary ion mass spectroscopy
STI Shallow trench isolation
TEM Transmission electron microscopy
WF Work function
XPS X-ray photoelectron spectroscopy
XRD X-ray diffraction
CHAPTER 1
I
NTRODUCTION
1.1 Overview
From everyday experience, we cannot imagine life without the microelectronic
devices. The silicon based microelectronic devices have successfully been evolved for the
last 40 years since the invention of the first integrated circuit (IC) in 1958. The evolution
with higher speed, greater performance, and lower production cost has been led by simply
reducing the dimensions of the active area of transistor such as gate dielectric thickness
and gate length. The scaling down of device dimensions is quite accurately governed by
Moore’s law [1.1] which predicts that the number of transistors on a chip doubles every
two years, resulting in higher performance, lower production cost, and smaller chip with
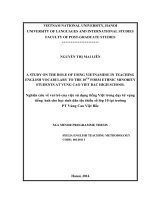
greater functionality. Figure 1.1 illustrates the number of devices integrated in the
different generations of Intel’s microprocessors as a function of the production year [1.2].
It indicates that over the past 35 years from 1971 to 2007, the minimum feature size in a
typical semiconductor process technology has been reduced from 8 μm in 1972 to the
current 65 nm technology.
Chapter 1: Introduction
2
1970 1980 1990 2000 2010
10
3
10
4
10
5
10
6
10
7
10
8
10
9
10
10
Itanium® II CPU
Itanium
® CPU
Dual-Core Itanium
® II CPU
Pentium
® 4 CPU
Pentium
® III CPU
Pentium
® II CPU
Pentium
® CPU
486
TM
CPU
386
TM
CPU
286
Number of transistors in CPU
Year
Moores's law
Fig. 1.1 Number of CPU transistor from 1970s to present, showing the device scaling
according to Moore’s Law; © Intel Corporation [1.2].
1.2 MOSFET Scaling: Opportunities and Challenges
MOSFET scaling has been aided by the rapid advancement of lithographic
techniques. Several scaling rules such as constant-field scaling (CES), constant-voltage
scaling (CVS), and generalized scaling were proposed to provide a basic guideline to the
design of scaled MOSFETs [1.3]. In reality, scaling rules have followed mixed rule of
CES and CVS. The principle of the generalized scaling is to scale both the electric field
and the physical dimensions (both lateral and vertical) of MOSFET by different factors
respectively. The requirement of reducing the supply voltage (V
d
) by the same factor as
the physical dimensions it too restrictive; therefore, the supply voltage (V
d
) typically
Chapter 1: Introduction
3
scales slower than the channel length, which leads to the increase of electric field by a
factor of α, as well as the increase of power density by a factor of α
2
to α
3
. It leads to
higher power dissipation of chips. This higher power dissipation becomes a considerable
challenge for the continuous scaling of CMOS into deep-submicron regimes. In order to
cope with the challenge of high power dissipation while maintaining higher performance,
innovative device structures as well as new materials have to be explored.
1.2.1 Limitation of SiO
2
as the Gate Dielectrics
The excellent physical, chemical, and electrical properties of SiO
2
as a gate
dielectric enable the Si-based MOSFET to successfully scale down for several decades
[1.4]. However, as SiO
2
dielectric continues to shrink less than 2nm, only several atoms
in thickness, several serious challenges are identified [1.5, 1.6]. The main issue is the
direct tunneling current through the ultra thin SiO
2
which rise exponentially as the
thickness of SiO
2
decrease [1.6]. The gate leakage will be dominated by direct tunneling
rather than Fowler-Nordheim (F-N) tunneling through a triangular barrier, resulting in
high standby power dissipation, high sub-threshold current, and poor controlling of field
effect. Besides the direct tunneling, ununiformity, variability, will be another issue. It
means only one atom variation over the large wafer size causes the more than 20%
ununiformity over the entire devices; once thickness of SiO
2
is below 1.2nm. In addition,
it was reported that there is a minimum thickness, 0.7nm, for SiO
2
to maintain its bulk
properties, which means SiO
2
as a gate dielectric is invalid beyond 2010 according to
table 1.1 [1.7]. Therefore, an alternative, instead of SiO
2
, must be proposed.
Chapter 1: Introduction
4
Table 1.1 Gate dielectric technology requirements – selected data from latest ITRS- 2006
update.
1.2.2 Post SiO
2
Dielectric: High-K Dielectric
Alternative gate dielectrics had been focused on SiON and SiO
2
/ Si
3
N
4
stacks in
order to figure out whose permittivity is higher than that of SiO
2
. Even if it leads to
reduction of leakage and better reliability characteristics [1.8, 1.9], the SiON and
SiO
2
/Si
3
N
4
stacks work well only down to 1.5nm. Below this, either high gate leakage or
degradation of electron channel mobility limits the further improvements in these
approaches. As an alternative to these gate stacks, lot of works have been done on high
Year of Production 2007 2008 2009 2010 2011
Technology node
Hp65 Hp57 Hp50 Hp45 Hp40
Physical gate length for
HP (nm)
25 22 20 18 16
Physical gate length for
LOP (nm)
32 28 25 22 20
Physical gate length for
LSP (nm)
45 37 32 28 25
EOT for HP (nm) 1.1 1.0 0.9 0.65 0.5
EOT for LOP (nm) 1.2 1.1 1.0 0.9 0.9
EOT for LSP (nm) 1.9 1.6 1.5 1.4 1.4
Gate leakage at 25°C for
HP (A/cm
2
)
800 1180 1100 1560 2000
Gate leakage at 25°C for
LOP (A/cm
2
)
78 154 161 110 450
Gate leakage at 25°C for
LSP (A/cm
2
)
0.022 0.027 0.031 0.036 0.048
Chapter 1: Introduction
5
permittivity (k) materials [1.10] such as Ta
2
O
5
[1.11, 1.12], TiO
2
[1.13], Al
2
O
3
[1.14], and
HfO
2
[1.15] to replace SiO
2
or SiON. The high-k dielectrics provide a physically thicker
film while maintaining same or low electrical thickness, resulting in reduction of direct
tunneling current and improving the gate capacitance as shown in equation (1.1).
2
,
SiO
high Phy
high
EOT T
κ
κ
ε
ε
−
−
=
(1.1)
The candidate high-k dielectrics should have suitable permittivity (k
≈
15-25),
large barrier height for both electron and hole, high crystallization temperature, good
thermal stability, and high carrier mobility for both electrons and holes. Among the
various candidates of high-k dielectric, the HfO
2
has been extensively studied due to the
appropriate k-values and relatively high barrier heights for both electrons and holes [1.10,
1.16, and 1.17]. Figure 1.2 shows the scalability of some higk-k dielectrics compared with
the ITRS requirements [1.18]. It clearly shows that the gate leakage reduction can be
achieved by 2 ~ 4 orders compared to SiO
2
by using high-k dielectrics.