Centrifuge and numerical modelling of sand compaction pile installation
Bạn đang xem bản rút gọn của tài liệu. Xem và tải ngay bản đầy đủ của tài liệu tại đây (5.53 MB, 270 trang )
CENTRIFUGE AND NUMERICAL MODELLING OF
SAND COMPACTION PILE INSTALLATION
YI JIANGTAO
(B.Eng.)
A THESIS SUBMITTED FOR THE DEGREE OF
DOCTOR OF PHILOSOPHY
DEPARTMENT OF CIVIL ENGINEERING
NATIONAL UNIVERSITY OF SINGAPORE
2009
i
ACKNOWLEDGEMENTS
I wish to express my deepest and heartfelt gratitude to my supervisors, Professor Lee
Fook Hou and Dr. Goh Siang Huat, for their constant guidance and dedicated
assistance throughout this research program. It is with their invaluable advice,
continuous support, and crucial encouragement that I can tackle various challenges
and achieve my research goals.
I would like to convey my sincere gratitude to Professor Mark Randolph
(UWA) for his guidance and encouragement on the research of cone penetration rate
effect (Chapter 5).
I also feel grateful to the technicians in the NUS Geotechnical Centrifuge
laboratory, Mr. Wong Chew Yuen and Dr. Shen Rui Fu, for their help in operating the
centrifuge equipment and improving the experimental set-up. My sincere
appreciation is also extended to Mr. Tan Lye Heng, Mr. John Choy, Madam Jamilah,
Mr. Foo Hee Ann and Mr. Shaja Khan for the assistance they provided me in the
course of the experimental work.
The support from the National University of Singapore is gratefully
acknowledged, both for granting me the research scholarship and providing me with a
stimulating research environment from which I benefited greatly.
Special thanks are given to my fellow research scholars in the Center for Soft
Ground Engineering for their friendship, kindness and help.
ii
TABLE OF CONTENTS
Page
ACKNOWLEDGEMENTS i
TABLE OF CONTENTS ii
SUMMARY vii
LIST OF TABLES ix
LIST OF FIGURES x
LIST OF SYMBOLS xviii
Chapter 1: INTRODUCTION 1
1.1 Background 1
1.2 The “Set-up” effect in soil 4
1.3 Research scope and objective 6
Chapter 2: LITERATURE REVIEW 11
2.1 Introduction 11
2.2 Design methodology for the SCP-treated ground 11
2.2.1 Bearing capacity evaluation 12
2.2.2 Settlement analysis 18
2.2.3 Stability analysis 24
2.3 Research investigation on the sand compaction pilling 25
2.3.1 Field studies 25
2.3.2 Reduced-scale 1g-model tests 29
2.3.3 Centrifuge model tests 31
2.3.4 Numerical analysis 40
iii
2.4 Knowledge gaps and outstanding issues 44
Chapter 3: CENTRIFUGE EXPERIMENTAL PROCEDURE 64
3.1 Fundamentals of centrifuge modelling 64
3.2 Centrifuge experimental set-up 65
3.2.1 NUS in-flight SCP installation system 66
3.2.2 Further modification to the in-flight SCP installer 67
3.3 Centrifuge experimental procedure 70
3.3.1 Sample preparation 70
3.3.2 SCP In-flight installation 72
3.3.3 In-flight shear strength profiling 73
3.4 Instrumentation in centrifuge testing 74
3.4.1 Linear-motion potentiometer 74
3.4.2 Pore pressure transducer (PPT) 74
3.4.3 Total stress transducer (TST) 75
3.4.4 T-bar penetrometer 78
Chapter 4: CENTRIFUGE MODEL TESTING: RESULTS AND ANALYSIS 89
4.1 Introduction 89
4.2 Results and discussion of Type I tests 92
4.2.1 Stress and pore pressure variations during SCP installation 92
4.2.2 Comparison with previous centrifuge studies 97
4.2.3 Initial strength state of clay bed 100
4.2.4 Comparison of measured radial stress and pore pressures with
analytical solutions 102
iv
4.2.5 Summary of the single pile installation 108
4.3 Results and discussion of Type II Tests 109
4.3.1 Overview of tests 109
4.3.2 Consolidation effect 112
4.3.3 Pile group effect 115
4.3.4 Conclusion remarks 116
Chapter 5: NUMERICAL STUDY OF CONE PENETRATION RATE EFFECTS
131
5.1 Introduction 131
5.2 Literature review 132
5.3 Numerical modelling aspects 139
5.3.1 Model geometry 139
5.3.2 Large-sliding soil-cone interface 141
5.3.3 Large deformation formulation 142
5.3.4 Elastic-plastic soil behavior 142
5.4 Analysis results 143
5.4.1 Effect of different penetration rates 144
5.4.2 Fully undrained penetration response 145
5.4.3 Fully drained penetration response 147
5.4.4 Undrained and drained plastic zones 149
5.4.5 Partially drained response 149
5.4.6 Effect of soil stiffness and strength on backbone curves 151
5.4.7 Comparison with Randolph and Hope’s (2004) centrifuge
experimental results 152
v
5.4.8 Effect of volumetric yielding 153
5.4.9 Effect of modulus profile 155
5.5 Application to soil properties evaluation 156
5.6 Concluding remarks 158
Chapter 6: FINITE ELEMENT ANALYSIS OF SAND COMPACTION PILE
INSTALLATION 180
6.1 Overview 180
6.2 Finite element model 180
6.2.1 Model geometry and boundary conditions 181
6.2.2 Model discretization 184
6.2.3 Modeling procedure 188
6. 3 Computed soil responses during SCP installation 188
6.3.1 Soil deformation and strain 189
6.3.2 Soil stresses and pore water pressure 191
6.3.3 Comparison of ABAQUS results with centrifuge data using
kaolin clay 193
6.3.4 Comparison of ABAQUS results with previous experimental data by
Juneja (2002) 196
6.4 Post-installation stress and strength conditions in the soil 197
6.4.1 Pore pressure and stress field following pile installation 198
6.4.2 Strength improvement effect 199
6.5 Strength improvement profile – Parametric studies 201
6.5.1 Changes in numerical modeling aspects 202
6.5.2 Strength improvement profiles 202
vi
6.5.3 Effects of friction angle and modulus ratio 203
6.6 Concluding remarks 206
Chapter 7: CONCLUSIONS 231
7.1 Summary of findings 231
7.2 Recommendations for future research 235
REFERENCES 237
vii
SUMMARY
The installation of sand compaction pile (SCP) has been known to have a
considerable impact on the surrounding soils. This research work focuses on
evaluating the influence of sand compaction piling, particularly the resulting strength
set-up in the adjacent clay. The study comprises both centrifuge experimental and
numerical modelling.
The centrifuge tests were carried out to measure the changes in radial stresses
and pore pressures in soft clays during and after the in-flight installation of sand
compaction piles. It was noted that the measured peak increases in stress and pore
pressure could be reasonably estimated by cavity expansion theory. Substantial
strength improvements in the clay were observed after pile installation. The strength
enhancement was considerably affected by consolidation effects, as well as the
number of piles. For pile group installation, the dissipation of excess pore pressures
between successive pile installations had a significant influence on the strength set-up
effect.
The numerical analysis work in this study comprises two phases. The first
phase was undertaken to validate the proposed numerical approach for modeling deep
penetration problems involving consolidation effects. For this phase, the study
problem was selected as the penetration of the cone penetrometer under various rates.
Coupled consolidation finite element analyses were carried out to simulate the deep
cone penetration using ABAQUS/Standard V6.6. A wide range of penetration rates
was considered to cover the full spectrum of consolidation or drainage conditions.
viii
As the penetration rate decreased, the transition from undrained to partially drained,
and then to fully drained was clearly observed. The numerical results from the
extremely fast and slow penetration, corresponding to the limiting undrained and
drained conditions, compare favorably with various analytical and numerical solutions.
The computed normalized backbone curve, which illustrates the effect of cone
penetrate rate, was found to agree well with published centrifuge results. Using the
hyperbolic curve fitting approach, a simplified procedure was proposed to derive the
backbone curve for a soil with given strength and stiffness properties.
The second phase of the numerical study uses the deep penetration modeling
techniques established in the first phase to carry out finite element analysis of sand
compaction pile installation. Reasonable agreement was obtained between the
numerical results and those obtained from the centrifuge experiments. By carrying
out additional parametric studies, the numerical results provide a comprehensive
information database which describes changes in the strains, stresses, pore pressures,
and strengths during and after pile installation. More importantly, the extent and
magnitude of the strength set-up effect may be defined and quantified by the
computed strength improvement radial profiles. A logarithmic function was
proposed to approximate these strength improvement profiles, which uses two fitting
parameters that are correlated with the soil’s properties. This led to the development
of a simple and practical means for predicting the long-term strength increase due to
the sand compaction pile installation.
ix
LIST OF TABLES
Table 3.1 Centrifuge scaling rules (after Schofield, 1980 & 1988; Taylor, 1995) 82
Table 3.2 Properties of the kaolin clay (after Goh, 2003, Purwana et al. 2005) 82
Table 4.1 Centrifuge models test details 118
Table 4.2 Estimation of dimensionless time T 118
Table 4.3 Summary of Juneja’s (2002) centrifuge experimental information from
selected tests 118
Table 4.4 Cam-clay properties of kaolin clay (Goh, 2003) 119
Table 5.1 Soil Properties for SR 18 and SR 49 (data from Kim (2005)) 161
Table 5.2 Back-fitted parameters and estimated soil properties for SR 18 and SR 49
161
Table 6.1 Summary of Juneja’s (2002) centrifuge experimental information from
selected tests 208
x
LIST OF FIGURES
Figure 1.1 Cumulative length of sand compaction piles constructed (after Kitazume,
2005). 8
Figure 1.2 Execution equipment for SCP on-land construction (after Kitazume, 2005).
8
Figure 1.3 Execution equipemnt for the SCP off-shore construction (after Kitazume,
2005). 9
Figure 1.4 Compozer method of the SCP installation (after Aboshi & Suematsu, 1985).
9
Figure 1.5 Non-vibratory SCP installation (after Tsuboi et al., 2003). 10
Figure 2.1 Unit cell concept (after Aboshi & Suematsu, 1985). 48
Figure 2.2 Sliding failure of the composite ground (after Kitazume, 2005). 48
Figure 2.3 General shear failure of the composite ground (after Kitazume, 2005) 49
Figure 2.4 Shear failure of the composite ground (after Barksdale & Bachus, 1983).
49
Figure 2.5 Bulging failure of the composite ground (after Greenwood, 1970). 49
Figure 2.6 Design chart for estimation of settlement improvement (after Priebe, 1995).
50
Figure 2.7 Replacement of granular columns with continuous walls (after Van Impe &
De Beer, 1983). 50
Figure 2.8 Design chart for estimation of settlement reduction (after Van Impe & De
Beer 1983) 51
Figure 2.9 Slope stability analysis of the composite ground (after Aboshi et al., 1991).
51
Figure 2.10 Cross-section of embankment founded on (a) untreated ground; (b)
ground treated by the sand drain with steel sheet reinforcement; (c) ground
treated by the sand compaction pile (after Aboshi & Suematsu 1985) 52
Figure 2.11 Settlement histories of embankments (after Aboshi & Suematsu, 1985).
53
xi
Figure 2.12 Vertical earth pressures measured in the SCP-improved ground (after
Aboshi & Suematsu, 1985). 53
Figure 2.13 Set-up of full scale test at the Maizuru Port (after Yagyu et al., 1991) 54
Figure 2.14 Failure surface obtained from the post-test investigation (after Yagyu et
al., 1991). 54
Figure 2.15 Sectional view of construction site at the Uno Port (after Kitazume, 2005).
55
Figure 2.16 SPT N-value with depth (after Kitazume, 2005) 55
Figure 2.17 Vibration and noise levels at various distances away from the construction
site: (a) vibration level; (b) noise level (after Kitazume, 2005) 56
Figure 2.18 Comparison of vibro and non-vibro method in terms of compaction
efficacy (after Kitazume, 2005). 56
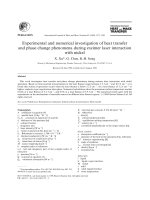
Figure 2.19 Schematic illustration of experimental set-up (after Kim et al., 2004). .57
Figure 2.20 Unit cell test device (after Kim et al., 2006). 57
Figure 2.21 Schematic illustration of centrifuge experimental set-up (after Terashi et
al., 1991a) 58
Figure 2.22 The combination of horizontal and vertical loads upon failure (after
Terashi et al., 1991b) 58
Figure 2.23 Displacement vectors of the SCP-improved ground under (a) vertical
loading; (b) inclined loading conditions (after Terashi et al., 1991a). 59
Figure 2.24 Schematic illustration of centrifuge experimental set-up (after Rahman et
al., 2000a) 59
Figure 2.25 Schematic illustration of centrifuge experimental set-up (after Al-Khafaji
& Craig, 2000). 60
Figure 2.26 Centrifuge experimental set-up: (a) photo; (b) schematic illustration (after
Nakamura et al., 2006) 60
Figure 2.27 Displacement vectors of the ground improved by (a) fixed type SCPs; (b)
floating type SCPs (after Nakamura et al., 2006). 60
xii
Figure 2.28 Schematic illustration of centrifuge experimental set-up (after
Daramalinggam, 2004). 61
Figure 2.29 Variation of measured to calculated increase in total horizontal stress and
excess pore pressure ratio (post-installation) (after Lee et al., 2004). 61
Figure 2.30 Variation of measured stress and excess pore pressure against calculated
values inferred from modified cavity expansion theory: (a) peak jack-in;
(b) post-installation (after Lee et al., 2004). 62
Figure 2.31 Failure behavior of ground improved by (a) fixed of SCPs; (b) floating
type of SCPs (after Takahashi et. al., 2006). 62
Figure 2.32 Idealized SCP installation process for FEM implementation (after Farias
et al. 2005). 63
Figure 2.33 Numerical procedure named “Dummy material” for column installation:
(a) model of improved soil; (b) modelling column expansion; (c)
discretized improved soil (after Guetif et al. 2007). 63
Figure 3.1 Centrifuge test set-up for SCP installation (a) front view & (b) side view.
83
Figure 3.2 Miniature hydraulic motor, Archimedes’ screw and sand hopper casing
assembly (after Daramalinggam, 2004). 83
Figure 3.3 Miniature auger and Archimedes’ screw. 84
Figure 3.4 The control / power supply system of X-Y table. 84
Figure 3.5 1-g consolidation test set-up 85
Figure 3.6 SCP produced by in-flight installer. 85
Figure 3.7 Entran EPL-D12 stress transducer (after Juneja, 2002). 86
Figure 3.8 Layout for total stress transducer (TST) calibration test in the fully
saturated, normally consolidated clay. 86
Figure 3.9 Measured versus applied vertical stress (in vertical calibration test) 87
Figure 3.10 Measured versus applied lateral stress (in lateral calibration test) 87
Figure 3.11 T-bar penetrometer 88
xiii
Figure 4.1 Sketches of centrifuge experimental set-up: (a) in model scale; (b) in
prototype scale. 120
Figure 4.2 Measured total stress variation during the SCP installation of test S1 120
Figure 4.3 Measured pore pressure variation during the SCP installation of test S1.
121
Figure 4.4 Total lateral stress and pore pressure changes during SCP installation
(after Juneja, 2002). 121
Figure 4.5 Comparison of the present and previous test results: (a) total stress increase,
(b) excess pore pressure. 122
Figure 4.6 Initial strength state of soil bed. 123
Figure 4.7 Expansion of cylindrical cavity in an infinite medium. 123
Figure 4.8 Comparisons between measured total stresses and pore pressure increases
(
m,
u
m
) and calculated values (
c,
u
c
) from solutions by Vesic
(1972) (a) E
u
/s
u
=150, (b) E
u
/s
u
=200, (c) E
u
/s
u
=250. 124
Figure 4.9 Comparisons between measured total stresses and pore pressure increases
(
m,
u
m
) and calculated ones (
c,
u
c
) from solutions by Lee et al.
(2004) (a) E
u
/s
u
=150, (b) E
u
/s
u
=200, (c) E
u
/s
u
=250. 125
Figure 4.10 Comparisons between measured total stresses and pore pressure increases
(
m,
u
m
) and calculated ones (
c,
u
c
) from solutions by Cao et al.
(2001) 126
Figure 4.11 SCP layout and strength acquisition point positions of test (a) T1; (b) T2
and T3; (c) T4 and T5. 127
Figure 4.12 Dissipation of excess pore pressure after SCP installation, observed at
30mm radial distance from SCP axis, at different depths of 100mm-thick
soil sample. 128
Figure 4.13 Centrifuge measured strength profiles: P-O, P-A, and P-B. 128
Figure 4.14 Centrifuge measured strength profiles: P-O, P-C(T2), and P-C(T3). 129
Figure 4.15 Centrifuge measured strength profiles: P-O, P-D(T4), and P-D(T5). 129
Figure 4.16 Centrifuge measured strength profiles: P-O, P-B, P-C(T3), and P-D(T5).
130
xiv
Figure 4.17 Centrifuge measured strength profiles: P-O, P-C(T2), and P-D(T4). 130
Figure 5.1 Effect of penetration rate on cone resistance (after Randolph & Hope,
2004). 162
Figure 5.2 Axisymmetric finite element mesh for analysis: (a) initial mesh (b)
deformed mesh after cone insertion 162
Figure 5.3 Calculated cone resistance profiles for different penetration rates. 163
Figure 5.4 Computed excess pore pressure contours for different penetration rates.
163
Figure 5.5 Computed strain contours from the present FEM analysis at a penetration
depth of 40R 164
Figure 5.6 Strain contours during the penetration of a 60º cone obtained using the
strain path method (after Levadoux & Baligh, 1980). 165
Figure 5.7 Comparison of analytical predictions and calculated N
c
for undrained
condition. 166
Figure 5.8 Variation of normalized undrained cone resistance with G/p' 166
Figure 5.9 Variation of normalized undrained cone resistance with M. 167
Figure 5.10 Comparison of analytical predictions and calculated N
q
for drained
condition. The factor F in Yu’s (2004) results is a plastic zone shape
factor. 167
Figure 5.11 Variation of N
q
with friction angle ' 168
Figure 5.12 Cone factors N
q
for various dilation angles using Hu’s (2003)
parameters (' = 45 º, G/p' = 177, ' = 0.3, K
0
= 0.43, c' = 2 kPa) 168
Figure 5.13 Variation of normalized drained cone resistance with M 169
Figure 5.14 Variation of q
drained
/q
ref
with G/p'. 169
Figure 5.15 Variation of q
drained
/q
ref
with '. 170
Figure 5.16 Size of the elasto-plastic zone. 170
Figure 5.17 Normalized cone resistance versus non-dimensional velocity. 171
xv
Figure 5.18 Normalized cone resistance versus non-dimensional velocity for various
friction angles (G/p' = 35) 171
Figure 5.19 Normalized cone resistance versus non-dimensional velocity for various
G/p' ratios 172
Figure 5.20 Comparison with Finnie & Randolph (1994) experimental data. 172
Figure 5.21 Comparison between computed and experimental excess pore pressure
ratios
cnet
q/u . 173
Figure 5.22 Comparison between computed and experimental net cone resistance
profiles during undrained cone penetration (' = 23°). 173
Figure 5.23 Comparison between computed and experimental excess pore pressure
profiles during undrained cone penetration (' = 23°). 174
Figure 5.24 Modified Drucker-Prager/Cap model and its hardening curve. The
hardening curve in the inset is obtained using = 0.035 and = 5 = 0.176.
174
Figure 5.25 Effect of cap on normalized cone resistance versus non-dimensional
velocity plots 175
Figure 5.26 Resistance ratio versus G/p' for different / ratios 175
Figure 5.27 Effect of / on the normalized cone resistance reduction ratio F
r
176
Figure 5.28 Three idealized soil modulus distributions (G profiles) 176
Figure 5.29 Comparison of cone resistance profiles under different drainage
conditions for three idealized soil modulus profiles. 177
Figure 5.30 Computed vs predicted backbone curves at three depths in a uniform soil
with constant G = 5400 kPa and ' = 23° 177
Figure 5.31 Measured normalized cone resistance at various penetration speeds (Kim,
2005; Kim et al., 2008). 178
Figure 5.32 Fitting of normalized field data from Kim (2005) and Kim et al. (2008) to
solve for unknown parameters. 179
xvi
Figure 6.2 Modelling procedure: (a) casing starts to penetrate; (b) casing insertion
ends; (c) casing withdraws with simultaneous sand injection; (d) the
installation completes and post-installation consolidation of soil
commences 210
Figure 6.3 Mesh of the finite element model 211
Figure 6.4 Deformed mesh resulting from the use of (a) conical and (b) flat ends. 211
Figure 6.5 Deformed mesh recorded when (a) casing penetrates to the 2.5m depth and
(b) SCP is formed up to the 2.5m depth 212
Figure 6.6 Computed shear strain (ε
rz
) contours registered at the instant when (a)
casing penetrates to the 2.5m depth and (b) SCP is formed up to the 2.5m
depth 213
Figure 6.7 Computed radial strain (
r
) contours registered at the instant when (a)
casing penetrates to the 2.5m depth and (b) SCP is formed up to the 2.5m
depth 213
Figure 6.8 Computed radial stress ('
r
) contours captured at the instant when (a)
casing penetrates to the 2.5m depth and (b) SCP is formed up to the 2.5m
depth 214
Figure 6.9 Computed total pore water pressure (u) contours captured at the instant
when (a) casing penetrates to the 2.5m depth and (b) SCP is formed up to
the 2.5m depth 214
Figure 6.10 Radial distribution of (a) excess pore water pressure (Δu) and (b)
normalized excess pore water pressure (Δu/s
u
) at different depths, upon
the completion of the SCP installation 215
Figure 6.11 Comparison of measured and computed total stresses at depths of (a) 1.5
m; (b) 2.75 m; (c) 4 m 216
Figure 6.12 Comparison of measured and computed pore pressure at depths of (a) 1.5
m; (b) 2.75 m; (c) 4 m 217
Figure 6.13 Influence of (a) cavity contraction and (b) frictional soil-casing
interaction on the calculated total stress. 218
Figure 6.14 Comparison of measured (Juneja, 2002) and computed total stress. 219
Figure 6.15 Comparison of measured (Juneja, 2002) and computed pore pressure.
220
xvii
Figure 6.16 Computed total pore pressure (u) contours at instants of (a) 0s, (b) 5.2E4s,
(c) 2.6E5s, and (d) 4.0E6s after the SCP installation 221
Figure 6.17 Computed long-term, steady-state contours of radial stress ('
r
) 222
Figure 6.18 Computed long-term, steady-state contours of mean normal stress (p').
222
Figure 6.19 Computed post-installation, ultimate undrained shear strength (s
u
)
contours 223
Figure 6.20 Comparison between experimental measurements and numerical
predictions of strength profiles. 223
Figure 6.21 Comparison between experimental measurements and numerical
predictions of strength improvement ratio I
su
. 224
Figure 6.22 New and deeper finite element mesh for parametric study. 225
Figure 6.23 Strength improvement radial profile (I
su
~r/R
s
curve). 226
Figure 6.24 Strength improvement radial profile (I
su
~ln(r/R
s
) curve) 226
Figure 6.25 Strength improvement radial profiles for soil with the same modulus ratio
(G/p' = 20), but different friction angle: (a) ' = 18; (b) ' = 30; (c) ' =
35. 227
Figure 6.26 Strength improvement radial profiles for different friction angles. 228
Figure 6.27 Strength improvement radial profiles for soils with the same friction angle
(' = 23), but different modulus ratio: (a) G/p' = 40 and (b) G/p' = 80.
229
Figure 6.28 Strength improvement radial profiles for different modulus ratios 229
Figure 6.29 Fitted coefficient A for soils with G/p' ranging 20-120 and M ranging
0.7-1.2. 230
Figure 6.30 Fitted coefficient B for soils with G/p' ranging 20-120 and M ranging
0.7-1.2. 230
xviii
LIST OF SYMBOLS
A cross sectional areas of unit cell
A
c
cross sectional areas of the clay within the unit cell
A
f
Skempton pore pressure parameter at failure
A
s
cross sectional areas of the sand pile within the unit cell
a smallest center-to-center spacing within the pile grid
a
c
centrifuge acceleration level
a
s
area replacement ratio (as =A
s
/A)
B width of foundation
b, c, m hyperbolic constants
c' effective cohesion
c
v
coefficient of consolidation of soil
D' soil effective constrained modulus
d diameter of the cone
d
b
diameter of the cross bar of T-bar penetrometer
d
f
equivalent nominal thickness of the wall
d
s
diameter of the sand column
E
c
Young's modulus of the clay
E
s
Young's modulus of the sand
E
u
undrained Young's modulus of the soil
e void ratio
e
0
reference void ratio
F applied external load
F
r
reduction factor
F
s
factor of safety.
G soil shear modulus
G
i
initial soil shear modulus
G
z
shear modulus at depth z
G
0
shear modulus at the ground surface
H thickness of subsoil
xix
I
r
rigidity index
K
c
coefficient of earth pressure in the clay
K
p
passive earth pressure coefficient of tributary clay
K
s
coefficient of earth pressure in the sand column
K
0
coefficient of earth pressure at rest
k coefficient of permeability
M
friction coefficient (M = 6 sin '/(3 - sin'))
m
v
coefficient of volume change of clay
N
b
bar factor of the T-bar penetration
N
c
cone factor of the undrained penetration
N
q
cone factor of the drained penetration
N
α
bearing capacity factors for self-weight
N
β
bearing capacity factors for cohesion
n stress concentration ratio
P the force per unit length acting on the cylinder,
P
f
maximum load on the composite ground
p' mean effective normal stress
p'
c
pre-compression pressure
p'
0
initial mean effective stress
q deviator stress
q
c
cone tip resistance
q'
c
effective cone tip resistance
q
cnet
net cone resistance (q
cnet
= q
c
-
v0
)
q
drained
drained
net cone resistance
(
q
drained
= q
cnet-drained
)
q
f
ultimate bearing capacity
q
ref
reference (undrained) net cone resistance
(
q
ref
= q
cnet-undrained
)
q
t
surcharge per unit area.
R cone radius
R
c
radius of casing
R
i
isotropic overconsolidation ratio
xx
R
l
radius of slip circle
R
p
, Z
p
horizontal and vertical extent of plastic zone
R
s
radius of sand compaction pile
R
u
cavity radius.
r radial distance
S ground settlement
S
0
original ground settlement
s distance to the nearest drainage boundary
s
u
undrained shear strength
s
u-i
initial strength of the clay
s
u-l
post-installation, post-consolidation undrained shear strength
s
uo
cohesion of clay at surface
s
u
/q
t
ratio of undrained shear strength increase due to surcharge
T dimensionless time
t duration of the event
U degree of consolidation
u total pore pressure
V non-dimensional velocity
v penetration velocity
W weight of soil slice
x lever arm
z depth below surface
initial stress anisotropy (=(
v0
-
h0
)/2s
u
)
l
arc of slip circle
c,
u
c
calculated total stress and pore pressure increases
h
difference of lateral pressure increases between sand column and clay
m,
u
m
measured peak total stress and pore pressure increases
r
total radial stress increase
u
excess pore pressure
Λ
plastic volumetric strain ratio (Λ=
xxi
M
friction coefficient (M = 6 sin '/(3 - sin'))
'
effective friction angle
m
average friction angle of composite ground (
m
=tan
-1
(
s
a
s
tan
s
))
s
friction angle of sand
dilation angle
inclination of the failure surface measured from horizontal plane
settlement reduction factor
c
unit weight of clay
m
average unit weight of composite ground (
m
=
s
a
s
+
c
(1-a
s
))
max
maximum shear strain (
max
=(
1
-
3
)/2)
s
unit weight of sand pile
'
effective unit weight of soil
w
unit weight of water
1
,
3
major and minor principal strains
r
radial strain
rz
meridional shear strain
p
v
plastic volumetric strain
ξ shear strength increment rate with depth
re-compression index under isotropic loading
compression index under isotropic loading
c
ratio of stress on clay to the average loading intensity
s
ratio of stress on sand pile to the average loading intensity
ν' effective Poisson’s ratio
ν
c
Poisson’s ratio of clay
average loading intensity,
c
vertical stress on the clay
h
lateral confining stress on the cylindrical surface of sand pile
h0
in-situ total horizontal stress.
r
total radial stress
'
r
effective radial stress
xxii
s
vertical stress on the sand pile
v0
in-situ total vertical stress
'
v0
in-situ effective vertical stress
u
upper yield stress of clayey ground
σ
w
vertical load intensity applied by the overlying soil mass
sc
shear strength of the composite ground
angle between the postulated failure surface and foundation
angular rotational speed of centrifuge
1
Chapter 1: INTRODUCTION
1.1 Background
Construction works in soft grounds often encounter problems originating from weak
engineering properties of soft soils such as low bearing capacity, excessive
settlements and ground movements. Various ground improvement methods are
thereby developed and implemented to treat soft soil, one of which is the sand
compaction pile (SCP) method.
The method of sand compaction pile improves weak soil stratums by
introducing a number of well-compacted and large-diameter sand columns into soil,
with the latter being substantially strengthened and reinforced. The sand compaction
piling was originally developed to densify and improve the loose sandy ground
(Kitazume, 2005). Its applications soon extended to soft clayey soil, where it found
extensive usage in rapid and cost-effective bearing capacity improvement, stability
enhancement and settlement reduction (e.g. Aboshi & Suematsu, 1985; Nakata et al.,
1991; Kitazume, 2005). With its low-cost, rapid highly-automated installation
operation and versatility of usages, the method of sand compaction pile has been
practiced worldwide for the ground treatment, especially in East and Southeast Asia
(e.g. Japan, Korea, Singapore, etc). In Japan, the sand compaction piling is a popular
ground treatment method with wide applications in both on-land and near-shore
projects such as constructions of building foundation, embankment, port and harbor
facilities and sea revetment (e.g. Aboshi et al., 1979; Moroto & Poorooshasb, 1991;
Kitazume, 2005). As Figure 1.1 indicates, the cumulative length of sand compaction
2
pile in Japan increased rapidly in the last several decades and reached up to 350
thousand kilometer in 2001 (Kitazume, 2005). In Singapore, sand compaction piles
were adopted in land reclamation projects, such as those at Marina Bay, Tanjong Rhu
and Tuas (e.g. Wei & Khoo, 1992; Wei et al., 1995). In addition, sand compaction
piling was also used in the constructions of port and harbor facilities in Singapore. For
instance, sand compaction piles with diameters of 2m and area replacement ratio of
70% were used in the Pasir Panjang container terminal project to improve the
foundation system of caisson wharf structure (e.g. Ng et al., 1995).
Since its introduction in the 1950s (Murayama, 1957), the SCP construction
technique and machinery has evolved and undergone significant advancement.
During the 1950s and 1960s, the hammering compaction technique was adopted for
the construction of the compacted sand column. It was subsequently phased out and
replaced by the vibro-compaction technique, which is much more energy-efficient and
environmentally-friendly. The appearance of auto-control execution system in the
1980s undoubtedly expedited the construction speed and enhanced its capability to
accommodate variation in soil properties. The advancing construction technique also
helped to extend use of sand compaction pile from on-land to near-shore constructions
and allow for greater improvement depth. The maximum reported improvement depth
was 70m (Kitazume, 2005).
The most commonly practiced construction method of SCP is the “compozer
method” (Aboshi & Suematsu, 1985). Figures 1.2 and 1.3 illustrate the typical
equipment for on-land and near-shore constructions using the compozer method,