Growth and transmission electron microscopy studies of nanomaterials 5 7
Bạn đang xem bản rút gọn của tài liệu. Xem và tải ngay bản đầy đủ của tài liệu tại đây (3.48 MB, 52 trang )
Chapter 5 Growth of silicon carbide nanocones
128
Chapter 5 Growth of silicon carbide nanocones
In this chapter, we continue to use the VLS method to grow silicon carbide
nanocones.
5.1 Introduction
SiC is an important group IV semiconductor material with a bandgap of 2.3
eV. It has received much attention for its applications in high frequency, high power
and high temperature devices due to its high breakdown electric field, electron
mobility and good thermal conductivity [1-5]. Theoretical calculations and
experimental results show that the electricity and strength of SiC nanorods are better
than those of large whiskers and bulk crystalline SiC, [6-7] the elastic constant can
reach the theoretical value of 600 Gpa for (111) oriented SiC [6].
5.2 Motivation
Controlling nanostructure formation is one of the key steps in fabricating
nanomaterials and has been the focus of intensive research efforts. For example,
creating architectured assembly of dimensional nanostructures is essential for device
integration in field emission arrays, sensor arrays, multi-tip arrays for dip-pen
lithography, photonic waveguides etc [8-10]. There have been extensive research
efforts on the synthesis and assembly of nanorods and nanotubes for such
Chapter 5 Growth of silicon carbide nanocones
129
mechanical or electronic applications. However there have been relatively few
systematic studies on ways to precisely engineer the shape and form of the
components for functional nanoscale mechanical devices. For example, a conical
structure offers substantially higher mechanical and thermal stability than a narrow
cylinder. Structurally, nanocones can have nanometer-sized tips and micrometer
sized bases, rendering their manipulation easier than nanotubes.
Nanocones are also mechanically stiffer and less prone to bending and
thermal shock, making them ideal candidates for scanning probe tips, or as
nano-syringes for quantum dot injection into biological cells. Zhang [11] reported
the chemical vapor deposition (CVD) synthesis of tubular graphite cones consisting
of annular rings of graphene planes concentric with a hollow interior. The conical
structure is due to the progressively shorter terrace edges going from the inside to
outside, arising from the sequential growth of shorter secondary layers on the inner
layers as the central tube grows upward. Khrisnan [12] used arc discharge methods
to synthesize geometrically precise, hollow nanocones that consisted of folded
conical graphene planes. Vladmir [13] balanced the growth and etching effects of
the acetylene-ammonia mixtures to synthesize carbon nanocones made of cylindrical
carbon nanofibres surrounded by carbon precipitates on the outside. All the
nanocone structures reported thus far are straight-growing, crystalline cones made of
carbon.
Chapter 5 Growth of silicon carbide nanocones
130
Many researchers have been trying various methods to synthesize
one-dimensional SiC rods. The detailed methods are listed in table 5.1.
Table 5.1 Methods for synthesizing SiC nanorods and nanowires.
Researchers Shape of SiC Synthesis methods Year
Dai et al. SiC nanorods nanotube template and SiO or Si+I
2
1995[14]
Meng et al. SiC nanorod within
SiO
2
nanorod
carbothermal reduction of silica
xerogels at 1650 ˚C
1999[15]
Zhu et al. SiC-SiOx
heterojunction
nanowires
Heating SiC-Fe-Co mixtures under CO
atmosphere at 1500 ˚C
1999[16]
Lai et al. SiC nanorods hot filament CVD on Si substrate using
mixture of Si, SiO
2
and carbon above
2300 ˚C
2000[17]
Hu et al. SiC nanorods high pressure and low temperature
using CCl
4
, Si and Na
2000[18]
Li et al. SiC
nanorod/nanorod
SiC rod as the anode to arc discharge 2001[19]
Gao et al. Needle-Like SiC
Nanorods
carbothermal reduction (CNTs) of SiO
at 1410 ˚C, Fe
2001[20]
Kim et al. SiC–C coaxial
nanocables
silicon substrates and carbon deposition
using pyrolysis of CH
4
at 1100 ˚C, Fe
2003[21]
Li et al. SiC nanowire
networks
carbothermal reduction of Si and SiO
2
under 1250 ˚C
2003[22]
Although various methods have been applied for synthesizing SiC nanorods
and nanowires, the nanorods show no ordered arrangement on the specific substrates,
and are randomly deposited on the wall of the chamber, in the crucible or on the
cathode. Such fabrication methods are unsuitable for the manufacturing of
nanodevices. Moreover, since Si or SiO
2
were commonly used as the source,
Chapter 5 Growth of silicon carbide nanocones
131
temperatures of more than 1000 ˚C were needed for these reactions.
In this study, we report for the first time the synthesis of silicon
oxide-ensheathed silicon carbide nancones using tetramethylsilane as the single
source precursor at temperatures under 900 ˚C. It is discovered that the nanocones
show a propensity to undergo bending at various angles and we will discuss the
growth mechanism.
5.3 Growth conditions for SiC nanocones
Silicon wafers coated with 20 nm of nickel film were introduced into the
MW-PECVD system. The nickel-coated Si(100) substrate was pretreated at 800 ˚C
using a pure hydrogen plasma in order to remove the impurities and oxide film from
the substrate prior to growth. A single source precursor, tetramethylsilane, was used
for the deposition of the SiC nanocones. The details of sample pretreatment and the
growth conditions used in the MP-PECVD system are listed as follows:
H
2
pre-treatment Growth condition
Temperature (°C) 800 900
Flow rate (sccm) 100 H
2
10 Si(CH
3
)
4
100 H
2
Bias (V) -150 -20
Pressure (torr) 23 23
Time (minutes) 20 20
Chapter 5 Growth of silicon carbide nanocones
132
5.4 Growth and phase determination of SiC-SiO
2
nanocones
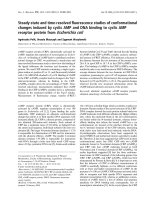
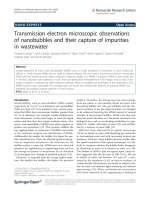
Figure 5.1 High Resolution SEM image of dense, uniform SiC nanocones
At the end of the deposition, a deep blue film could be seen on the Ni -coated
Si substrate. Visualization of the surface deposits by SEM reveals the growth of both
straight and bent conical fibres with an overall length of several micrometers, as
shown in figure 5.1. Beneath the nanocones, the substrate is covered by ball-like
deposits about 0.5 µm in diameter. The base of the cone is micrometer-sized and is
anchored to the micron-sized ball whilst the tip is nanometer-sized.
Chapter 5 Growth of silicon carbide nanocones
133
500 1000 1500 2000 2500
20
25
30
35
40
45
50
55
60
65
b
Si-O-Si
Si-C
Si-O
a
Si-Si
Transmittance
wavenumber (cm
-1
)
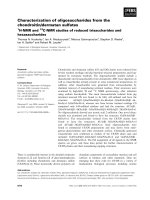
Figure 5.2 FTIR transmission spectra of the Si substrate (a) before deposition; (b) after
deposition with nanocones
The composition of the film was investigated by FTIR transmission
spectroscopy. Figure 5.2 shows IR spectra for the substrate before and after
deposition with tetramethylsilane. The band at 606 cm
−1
corresponds to the phonon
mode of the Si substrate. We also can see three transverse optic phonon bands of
SiO
2
in both spectra: the lowest frequency band at 458 cm
−1
corresponds to the Si–O
rocking vibration, the peaks at 792 cm
−1
and 1107 cm
−1
correspond to the symmetric
and asymmetric stretching vibrations of the Si–O–Si. The broad band of asymmetric
stretching vibrations at 1107 cm
-1
consists of two bands with peaks at 1088 cm
−1
and
1200 cm
−1
respectively [23,24]. The second band is originally IR-inactive but can be
Chapter 5 Growth of silicon carbide nanocones
134
activated by disorder-induced mode coupling. The intensity of SiO
2
peaks after
deposition becomes stronger compared to the peaks due to native oxide before
deposition, which indicates the film consists of large quantity of amorphous SiO
2
.
The additional peak at 820 cm
-1
was observed after deposition which is the
characteristic stretching vibration of crystalline SiC [25].
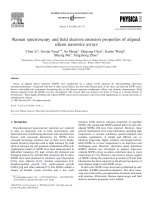
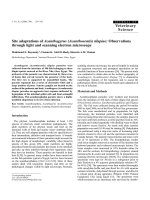
Figure 5.3 (a) TEM image of the tip of the cone. The size of the tip is around 20 nm, one
straight rod with diameter 10 nm is at the center of the cone; (b) High resolution TEM
image which shows that the inner nanorod is crystalline cubic SiC growing along the <111>
direction, the resolved {111} lattice planes are separated by 0.25 nm.
The internal microstructure of the nanocone was studied using TEM. Figure
5.3(a) shows a low magnification TEM image of a nanocone. The inset shows the
whole morphology of this nanocone. The peripheral wall of the cone is smooth and a
nanorod with diameter of 10 nm is concentric to the cone, tipped by a catalyst
particle. A high magnification view reveals that the center of the cone has a coaxial
crystalline rod of about 10 nm diameter. The HRTEM image of this coaxial rod in
(a)
(b)
Chapter 5 Growth of silicon carbide nanocones
135
figure 5.3(b) shows lattice fringe separations of 0.25 nm consistent with the cubic
β-SiC {111} interplanar separation, whilst the outer coat is amorphous. TEM
observation shows that the inner SiC nanorod grows preferentially along the <111>
direction.
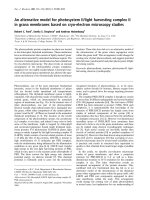
Figure 5.4 Energy filtered maps of silicon carbide/silicon dioxide nanocones. The maps
show that the center rod is crystalline silicon carbide and the outer layer is silicon dioxide.
The elemental distribution was verified by EELS mapping in figure 5.4. The
elemental maps were obtained from the L
23
edge of Si, and the K edge of C and O.
Silicon is found in both the body and the tip of the cone although the Si signal at the
tip arises from the overlap of the Ni M and Si L edge. Carbon existing at the center
of the cone and this indicates that the central rod is silicon carbide, whilst the outer
Chapter 5 Growth of silicon carbide nanocones
136
conical coat is silicon oxide. Since the atomic concentration of silicon in SiO
2
is
lower than that in SiC, the brightness indicates that the density of silicon atoms in
the outer sheath is lower than that of the center. The metal particle at the tip is nickel.
Elemental mapping clearly proves that center core of the nanocone is cubic SiC,
while the amorphous outer sheath layer is SiO
2
.
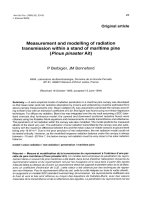
Figure 5.5 Electron energy loss spectra (a) collected at region ‘A’, focusing on the rod; (b)
collected at region ‘B’, focusing on the side of a cone.
More information on the SiC-SiO
2
nanocones is obtained by interpreting the
energy loss near edge structure (ELNES) of the Si, C and O edges. The near edge
energy loss structure arises from the excitation from core shell electrons to the
vacant levels above the Fermi level. The fine structure and position of the Si-L
2,3
edge depends on the ionicity of the bond with the ligand atoms. We can identify and
differentiate the SiX
2
(X=O, C, P, N) compound using ELNES as a fingerprint
100 200 300 400 500
0
2
4
6
8
10
12
14
Si-L
2
L
3
C-K
O-K
B
A
Intensity(x10
5
)
eV
Chapter 5 Growth of silicon carbide nanocones
137
method [26]. Background substracted EEL spectra taken from side and tip of the
cone are shown in figure 5.5. Focusing the electron beam on the narrower region ‘A’
of the cone where the rod is more prominent produces a spectrum with C and Si
edges characteristic of SiC. Focusing on the thicker region ‘B’ on the side produces
an EELS spectrum with Si and O edges, which are characteristic of the SiO
4
tetrahedral cluster. The Si L-edge consists of two sharp peaks at 107.3 and 113.9 eV,
and a third broad peak at 129.4 eV which is separated by about 22 eV from the first
peak. Such ELNES structures of SiC and SiO
2
had also been previously recorded by
L.A. Garvie [27]. The small C-K edge signal may come from the supporting holey
carbon film.
The composition of the SiC-SiO
2
cone was determined by the quantification
method which is described in chapter 3. The atomic ratio of the inner SiC rod and
side SiO
2
wall of the cone is Si/C=1.0:(0.9±0.12) and Si/O=1.0:(2.12±0.25)
respectively. All these results indicate the SiC-SiO
2
nanocone consists of the nearly
stoichiometric SiC nanorods covered by an amorphous SiO
2
layer.
The presence of nickel catalyst at the tip of the SiC rod suggests tip-catalyzed
growth following the classic vapor-liquid-solid mechanism [28]. The single source
precursor tetramethylsilane decomposed into SiC vapor and diffused into the Ni
catalyst particles. Since the {111} plane of β-SiC has the lowest surface free energy,
estimated to be about 2830 erg/cm
2
, which is much lower than those of other planes
Chapter 5 Growth of silicon carbide nanocones
138
such as the {110} (3450 erg/cm
2
), {211} (3990 erg/cm
2
) and {100} (4890 erg/cm
2
),
most of the SiC nanorods grow along the preferred <111> direction [29].
The presence of an outer amorphous SiOx coat indicates that lateral growth
of amorphous SiOx occurred on the SiC rod template simultaneously. There was no
intentional introduction of oxygen in the growth environment. Some leakage of the
oxygen into the chamber may have promoted the oxidation of the single organic
source. Unlike the hexagonal phase carbon nanotube, the stacking of cubic crystal
planes to form a rod in the case of β-SiC creates a high density of reactive edge sites
on the surface, these are also inevitably oxidized during the continuous adsorption of
reactive SiO
2
ions in the plasma environment [15, 16, 20, 22]. Depending on the rate
of lateral growth of SiOx relative to the vertical growth of the SiC rod, a rod-in-cone
structure results. The schematic growth process of SiC-SiO
2
nanocones is shown in
figure 5.6.
Figure 5.6 Schematic showing the growth process of SiC nanocones.
Chapter 5 Growth of silicon carbide nanocones
139
Since the lateral growth of the SiO
2
results from the rapid precipitation of
gaseous SiOx species in the plasma ball on the SiC rod, the position of the substrate
in the chamber and applied bias play important roles in the growth process. If we
place the substrate away from the center of the plasma ball, coaxially structured
SiC-SiO
2
nanorods instead of nanocones are obtained. These coaxial nanorods also
could be found when the bias was not directly loaded on the sample. The balance
between plasma etching and precipitation speed of SiO
2
accounts for the
morphology of the products.
5.5 Structural properties of bent SiC-SiO
2
nanocones
As mentioned, some bent nanocones were observed in the SEM images.
Figure 5.7(a) and (b) depict a nanocone with smooth curvature bent at 80˚. Since the
SiC wire acts as a template for the lateral growth of SiO
x
, the turning SiC wire
causes a similar turn in the conical SiO
x
deposit around it, resulting in the growth of
a bent nanocone. The amorphous nature of the SiO
2
deposit allows the smooth
merging of interfaces between the segments of the bent cones that would otherwise
be difficult for crystalline systems. The growth of the bent nanocone is a
phenomenon restricted to the unique material combination of a cubic phase wire and
an amorphous oxide sheath. Thus far, there have been no reports of bent nanocones
for the graphitic system because the growth mechanism precludes the sharp angular
Chapter 5 Growth of silicon carbide nanocones
140
bending of crystalline graphene sheets in the c-axis. The amorphous phase has no
such restrictions and remarkable branching and merging between interfaces of
silicon oxide nanowires to form branching networks have been recently reported.
Figure 5.7 TEM images showing (a) low mag image of bent SiC-SiO
2
nanocones; (b)
magnified image of bent area; (c) a SiC nanowire bent at 70˚; (d) a SiC nanowire bent at
110˚.
Chapter 5 Growth of silicon carbide nanocones
141
Figure 5.8 HRTEM and dark field image of bent SiC nanorod junction area.
A
B
C
Chapter 5 Growth of silicon carbide nanocones
142
However, the cumulated amorphous coating at the bent area is too thick to
permit enough electrons to pass though, preventing high quality electron imaging of
this elbow area. In order to understand the intrinsic properties of the bent cones, bent
SiC nanorods with a thinner SiO
2
sheath was prepared. Placing the sample away
from the plasma ball reduces the rate of SiOx precipitation, and nanofibres instead
of nanocones are obtained. We observe that the β-SiC nanorods has an intrinsic
propensity to undergo changes with certain angles, such as 70º and 110º. Two
typical examples are shown in figure 5.7(c) and (d). Previous studies of
SiO2-ensheathed SiC nanorods revealed that the growth axis changed frequently
between the {x11} family planes (x = 1, 2 or 3) in the course of growth to minimize
the surface energy, resulting in a zigzag coursing along the rod [30]. If the density of
twins is dominant, the nanorod grows along [111]. The growth direction changes to
[211] if a defect free block is grown, and to [311] if there is a constant translation
between adjacent growing blocks. The bending angles match the angles between
{111} planes very well. The corresponding plane angles of {111} and other
common faces are listed in table 2 [29]. Considering that the SiC growth follows the
VLS mechanism, SiC nanorods may grow along the <111> direction normal to the
lowest surface energy {111} family of planes. The {111} family of planes consist of
four planes: (111), (
11
1
), (
1
1
1
) and (
1
11
) and their opposites. The switch of
directions between these planes results in the bending of the nanorods.
Chapter 5 Growth of silicon carbide nanocones
143
Table 5.2 Corresponding plane angles in β-SiC crystal
Angle to {111} (º)
{111} 70.53
{100} 54.73
{110} 43.35
{211} 19.47
{221} 15.78
Figure 5.9 Schematic drawing of crystalline SiC structure constructed with (111) planes.
The red arrow indicates the growth direction of the nanocone.
[111]
(111)
(111)
[111]
110º
70 º
Chapter 5 Growth of silicon carbide nanocones
144
To achieve an understanding of how deformation stress and twinning defects
propagate to influence the bending of the cone, a detailed HRTEM image of the bent
nanorod junction is shown in figure 5.8. A schematic drawing of the SiC crystal
structure is shown in figure 5.9. The schematic shows the three layer stacking
sequence of A
Si
A
c
B
Si
B
C
C
Si
C
C
with alternating Si and C layers. Since the stacking
sequence along the [111] direction produces large quantities of dangling bonds on
the side of the crystal, the sides of the SiC nanorod are passivated by SiO
2
in the
plasma ball. Hence, 1-2 nm of SiO
2
layer is inevitably observed on the side of the
SiC nanorod in the HRTEM image.
A selected area diffraction pattern of the nanorod demonstrates that the rod is
a single crystal containing twins, and the two sections of the bending nanowires
grow along the [111] and [
1
11
] directions. A dark field image shows that both
nanowires have stacking faults, including the parts before bending. These stacking
faults and amorphous segments shown in HRTEM image are likely to change the
growth direction from [111] to [
1
11
], the defect free region.
The SiC wire-in-silicon oxide nanocones may offer applications for
structural applications due to their mechanical strength. For example the catalyst at
the SiC nanowire tip can be removed, exposing a SiC nanowire which has its stem
encapsulated by a mechanically stiff SiO
2
coat for support. Engineering straight SiC
wire-in-silicon oxide nanocones however is difficult since it is not known whether
Chapter 5 Growth of silicon carbide nanocones
145
the initial impetus for a change in growth direction of the SiC nanowire is purely
random, i.e. plasma process fluctuations, or entropy-driven etc. It is possible that
defects in stacking were influenced by oxygen ions in the plasma, because a much
higher density of bent nanowires was observed in this work compared to previous
studies. One possibility to direct the growth of the nanocone may be using templates
with nano-sized channels to externally constrict the bending angles.
5.6 Conclusion
In summary, we have synthesized a rod-in-cone structure using CVD. Our
results suggest that the SiC nanorod is inevitably ensheathed by an amorphous
silicon oxide coat to passivate the reactive edges. In a plasma chemical vapor
deposition system, lateral growth of the amorphous oxide deposits can result in a
conical sheath around the coaxially aligned cubic phase rod.
A change in the growth direction of this rod, due to stacking faults and
twinning defects intrinsic to the cubic phase, results in the growth of a bent
nanocone. The switch of directions between {111} planes results in the bent
nanocones. Such bent nanocones may offer nanomechanical applications as
nanocantilevers.
Chapter 5 Growth of silicon carbide nanocones
146
References
[1]
Harris, G.L.
Properties of Silicon Carbide, IEE emis Datareviews N.
1995,
13.
[2]
Davis, R.F.; Kelner, G.; Shur, M.; Palmour, J.W.; Edmond, J.A.
Proc. IEEE
1991,
79
, 677.
[3]
Morkoc, H.; Strite, S.; Gao, G.B.; Lin, M.E.; Svertlov, B.; Burns, M.
J. Appl.
Phys.
1994,
76,
1363.
[4]
Brown, D.M.; Downey, E.; Grezzo, M.
Solid State Electronics
1996,
59,
1531.
[5]
Nelson, W.E.; Halden, F.A.; Rosengreen, A.
J. Appl. Phys.
1966,
37,
333.
[6]
Wong, E.W.; Sheehan, P.E.; Lieber, C.M.
Science
1997,
277,
1971.
[7]
Macmillan, N.H.
J. Mater. Sci.
1992,
7,
239.
[8]
Piner R.D.; Zhu, J.; Xu, F.; Hong, S.H.; Mirkin, C.A.
Science
1999,
283,
661.
[9]
Teo, K.B.K.; Chhowalla, M.; Amaratunga, G.A.J.; Milne, W.I.; Pirio G,
Legagneux, P.; Wyczisk, F.; Pribat, D.; Hasko, D.G.
Appl. Phys. Lett.
2002,
80,
2011.
[10]
Greene, L.E.; Law, M.; Goldberger, J.; Kim, F.; Johnson, J.C.; Zhang, Y.F.;
Saykelly, R.J.; Yang, P.D.
Angew. Chem. Int. Ed.
2003,
42,
3031.
[11]
Zhang, G.Y.; Jiang, X.; Wang, E.G.
Science
2003,
300
, 472.
[12]
Krishnan, A.; Dujardin, E.; Treacy, M.M.J.; Hugdahl, J.; Lynum, S.; Ebbesen,
T.W.
Nature
1997,
388
, 451.
Chapter 5 Growth of silicon carbide nanocones
147
[13]
Merkulov, V.I.; Guillorn, M.A.; Lowndes, D.H.; Simpson, M.L.; Voelkl, E.
Appl. Phys. Lett.
2001
,
79
, 1178.
[14]
Dai, H.; Wong, E.W.; Lu, Y.Z.; Fan, S.S.; Lieber, C.M.
Nature
1995
,
375,
769.
[15]
Meng, G.W.; Zhang, L.D.; Mo, C.M.; Zhang, S.Y.; Qin, Y.; Feng, S.P.; Li, H.J.
J. Mater. Res.
1998
,
13,
2533.
[16]
Zhu, Y.Q.; Hu, W.B.; Hsu, W.K.; Terrones, M.; Grobert, N.; Hare, J.P.; Kroto,
H.W.; Walton, D.R.M.; Terrones, H.
J. Mater. Chem.
1999,
9
, 3173.
[17]
Lai, H.L.; Wong, N.B.; Zhou, X.T.; Peng, H.Y.; Au, F.C.K.; Wang, N.; Bello, I.;
Lee, C.S.; Lee, S.T.; Duan, X.F.
Appl Phys. Lett.
2000,
76,
294.
[18]
Hu, J.Q.; Lu, Q.Y.; Tang, K.B.; Deng, B.; Jiang, R.R.; Qian, Y.T.; Yu, W.C.;
Zhou, G.E.
J. Phys. Chem. B
2000,
104,
5251–5254.
[19]
Li, Y.B.; Xie, S.S.; Zou, X.P.; Tang, D.S.; Liu, Z.Q.; Zhou, W.Y.; Wang G.
J.
Cryst. Growth
2001,
223,
125.
[20]
Gao, Y.H.; Bando, Y.; Sato, T.; Kitami, Y.
Jpn. J. Appl. Phys.
2001,
40,
L1065.
[21]
Kim, H.Y.; Bae, S.Y.; Kim, N.S.; Park, J.
Chem. Commun. 2003,
20,
2634.
[22]
Li, H.J.; Li, Z.J.; Meng, A.L.; Li, K.Z.; Zhang, X.N.; Xu, Y.P.
J. Alloys Comp.
2003,
352,
279.
[23]
Ehrman, S.H.; Friedlander, S.K.; Zachariah, M.R.
J. Mater. Res.
1999,
14,
4551.
[24]
Kim, B.G.; Kang, S.Y.; Kim J.J.
J. Phys. D: Appl. Phys.
1997,
30,
1720.
Chapter 5 Growth of silicon carbide nanocones
148
[25]
Ehara, T.; Notake, K.; Handa, K.
Diamond Relat. Mater.
2001,
10,
1287.
[26]
Auchterlonie, G.L.; Mckenzie, D.R.; Cockayne, D.J.H.
Ultramicroscopy
1989,
31,
217.
[27]
Garvie, L.A.; Craven, A.J.; Brydson, R.
Am. Minera.
1984,
79,
411.
[28]
Wagner, R. S.; Ellis, W. C.
Appl. Phys. Lett.
1964,
4,
39.
[29]
Bootsma, G.A.; Knippenberg, W.F.; Verspui, G.
J. Cryst. Growth
1971, 11,
297.
[30]
Wang, Z.L.; Dai, Z.R.; Gao, R.P.; Bai, Z.G.; Gole, J.L.
Appl. Phys. Lett.
2000,
77
, 3349.
Chapter 6 Novel heterogeneous reaction route to Cu chalcopyrite thin films
149
Chapter 6 Novel heterogeneous reaction route to Cu
chalcopyrite thin films
The last three chapters focus on the synthesis of inorganic nanostructural
materials through VLS mechanism. In this chapter, a novel heterogeneous synthesis
route to copper chalcopyrite thin films by vapor-liquid method will be developed
and discussed.
6.1 Introduction
Thin solar cell technology with Cu multinary chalcopyrite absorbers has
received considerable interest over the past 20 years due to the potential of these
semiconductor materials to act as the absorber layer in solar cells. CuInSe
2
has been
the most intensely studied as it has achieved, on a laboratory scale, conversion
efficiency close to 19% from a recent development of CuInSe
2
and related
compounds [1]. CuInSe
2
thin film has a direct band gap of about 1.0 eV at room
temperature and possesses a high absorption coefficient of 10
4
-10
5
cm
-1
[2-4].
Having this large absorption coefficient, even a 1 µm thick CuInSe
2
film would be
able to absorb nearly 93% of radiation falling upon it [5]. It can be prepared as either
a
n
or
p
type semiconductor by adjusting its stoichiometry. It has good electrical and
thermal stability [6]. CuInS
2
has similar physical, chemical and electrical properties
as CuInSe
2
but it is studied to a lesser extent. Its direct band gap is about 1.5 eV. A
calculation by Meese
et
al.
[7] concluded that solar energy efficiencies between 27
and 32% are theoretically achievable in CuInS
2
p/n
homojunctions. Based on this
theoretical efficiency, the band gap of 1.5 eV is nearly the optimum for efficient
utilization of solar radiation [8]. The high absorption coefficient greater than 10
4
Chapter 6 Novel heterogeneous reaction route to Cu chalcopyrite thin films
150
cm
-1
[9] and the solar energy conversion efficiency of 10% make CuInS
2
a suitable
choice in photovoltaic applications.
For other chalcopyrite materials, InS (2.44 eV) and In
2
S
3
(2.07 eV) are
medium band gap semiconductors. GaS and Ga
2
S
3
(3.4 eV) have potential
applications as a passivating coating on GaAs [10, 11]. CuGaS
2
(2.49 eV) may be a
promising material for production of light-emitting devices in the green light region
[12].
6.2 Motivation
Since thin films of Cu ternary chalcopyrite have been regarded as a potential
candidate for photovoltaic applications [13, 14], various routes to prepare these
sulfide materials are well documented, such as solid state reaction synthesis [15], the
homogenous precipitation method
[16],
microwave irradiation of stoichiometric
amounts of the corresponding elements [17],
annealing of coevaporated In-Cu films
in H
2
S or H
2
Se atmosphere [18], solvothermal routes
[19, 20] and spray CVD from a
single source precursor [21].
Among these synthesis routes, the single source precursor process has
received much interest due to its potential approach to the deposition of thin films in
MOCVD systems. The single source approach presents a cleaner and simpler
technique. Compared to the conventional MOCVD precursors, these novel single
source compounds exhibit the following advantages [22]:
Air and moisture stability
Low toxicity
Pre-reaction is limited, only single source precursor in the supply stream
Maintenance/control of stoichiometry
Chapter 6 Novel heterogeneous reaction route to Cu chalcopyrite thin films
151
Ideal volatility for MOMBE
Impurity incorporation into films may be controlled by ligand design. Ligand
and metal are closely associated
Low temperature growth is possible
Therefore, in last two decades, chemists have been interested in synthesizing
stable and efficient molecular precursors for various metal chalcopyrite materials
[13, 14]. Unlike their III / V analogues, studies on single source precursors for group
III chalogenides are limited.
[In(SCONEt
2
)
3
] that has been synthesized and characterized by O’Brien and
coworkers [23] has a low boiling point of 98.5 ˚C, which makes it volatile and easily
evaporated. This precursor has been used for LPCVD and In
2
S
3
films which were
successfully deposited.
Thiolate, thiocarbamate and thiocarboxylate ligands have been used to
extensively synthesize single source precursors for various metal sulfide materials
[16-19]. Hampden-Smith and his coworkers have reported that thin films of
β
-In
2
S
3
could be obtained through aerosol assisted chemical vapor deposition from solutions
of the compound [HL][In(SC{O}Me)
4
] (L = 3,5 dimethyl pyridine) over the silicon
substrate [30].
In recent years, more ternary single source precursors (type I-III-VI
2
) have
been synthesized and characterized. [(Ph
3
P)
2
Cu(
µ
-ER)
2
M(ER)
2
] (M = Ga and In; E
= S, Se; R = Et and Bu
i
) and [Bu
2
In(SPr)Cu(S
2
CNPr
i
2
)] have been used to prepare
thin films of CuInS
2
, CuInSe
2
and CuGaS
2
[21, 24-27]. MOCVD from
[Bu
2
In(SPr)Cu(S
2
CNPr
i
2
)] leads to the formation of CuInS
2
, CuIn
5
S
8
, mixtures of
CuInS
2
and CuIn
5
S
8
or mixtures of In
6
S
7
and CuInS
2
depending on the carrier flow
Chapter 6 Novel heterogeneous reaction route to Cu chalcopyrite thin films
152
rate, base pressure and temperature employed [23,28]. Hepp and co-workers [29]
has even synthesized and characterized liquid single source precursors for the
ternary semiconductor CuInS
2
in order to improve the volatility of the precursor for
CVD. However, a possible disadvantage of such precursors is that their volatility is
rather low and an assisted delivery method such as aerosol assisted CVD or flash
evaporation has to be used. Moreover, despite the potential advantage of these
ternary compounds, the control of stoichiometry in complex compounds is difficult
which usually results in a low-quality film. This is attributed to some ternary species
(Metal-Metal-S-ligand) having lower surface diffusion rates than the separate groups
and species [22].
In general, the volatility of a binary precursor would be higher than a ternary
single source precursor. In this chapter, we present a novel and hitherto unknown
heterogeneous reaction route to high quality ternary CuInS
2
, CuInSe2 and CuGaS
2
thin films on Cu coated Si substrate. Binary neutral In(EPh)
3
(E= S, Se) precursors
and trialkylammonium salts of group 13 metals (Ga, In) thiocarboxylate compounds
have been employed for deposition of the corresponding ternary metal sulfides
(selenides) on Cu substrates through the heterogeneous reaction route.
This technique eliminates the use of toxic and hazardous gases like H
2
Se and
H
2
S and presents some advantages over the conventional preparative methods. There
is no need for precise control of flow rates as in multiple source MOCVD or spray
CVD and also the stoichiometry of the final product can be controlled and
maintained during the deposition.
The objective of this project is to deposit high quality ternary thin films with
the good crystallite, high purity and uniform grain size that are essential for the film
to exhibit the desired optical and structural properties to be used in photovoltaic