Structural investigations of redox regulation in ATFKBP13 3
Bạn đang xem bản rút gọn của tài liệu. Xem và tải ngay bản đầy đủ của tài liệu tại đây (242.62 KB, 17 trang )
Chapter 3 Materials and Methods
55
CHAPTER 3. MATERIALS AND METHODS
3.1 EXPRESSIONS AND PURIFICATION OF ATFKBP13
The mature AtFKBP13 gene, which codes 129 amino acids, was cloned into the
prokaryotic expression vector pGEX-KG [Rajeev Gupta et al., 2002]. The protein was
over expressed in
E. coli
BL21 (DE3) cells. The cells were grown in Luria-Bertani
medium to an OD
600
of 0.6 at 310 K and expression of the recombinant protein was
induced with 0.5 mM isopropyl -D-thiogalactopyranoside (IPTG) at 303 K. Cell growth
was continued at 303 K for 6 h after IPTG induction and cells were harvested by
centrifugation at 4,200g (6000 rpm, Beckman JA-8.1000 rotor) for 10 min at 277 K. The
cell pellet was suspended in ice-cold lysis buffer [20 mM Tris-HCl (pH 7.5), 0.5 M NaCl,
1mM DTT] and homogenized by sonication. The crude lysate was centrifuged at
42, 400g (18,000 rpm, Beckman JA-25.50 rotor) for 1 h at 277 K and the cell debris was
discarded. The supernatant was applied to a GST-affinity column (5 ml glutathione
Sepharose 4B) and the contaminant proteins were washed away with wash buffer (lysis
buffer plus 400 mM NaCl) and eluted with 50 mM Tris (pH 7.5), 10 mM reduced
glutathione. 150 units of thrombin were added to the eluate and incubated overnight at
277 K. The fusion protein was cleaved efficiently (Fig. 3-1). The eluate was dialyzed in
20 mM Tris (pH 7.5), 0.5 M NaCl using 3,500 Da molecular weight cut-off dialysis
tubing (Spectra). Thrombin and the cleaved GST were removed by passing through a
Chapter 3 Materials and Methods
56
5 ml HiTrap benzamidine FF (Pharmacia) column and a 5 ml GSTrap FF column. The
final purification step was achieved by gel filtration on a HiLoad 16/60 Superdex-75
prep-grade column (Pharmacia) previously equilibrated with a buffer solution containing
50 mM Tris-HCl (pH 7.5) and 150 mM NaCl. The purified protein was concentrated to
10 mg ml
-1
using an YM10 membrane (Amicon) and confirmed with Bradford protein
assay [Bradford, 1976]. The protein was then aliquoted as 50
µ
l per tube, flash frozen
with liquid nitrogen and stored at –80 ºC for later use. The purified protein was analyzed
on SDS-PAGE and native PAGE. The dynamic light-scattering data showed the protein
had 70-80% homogeneity as a monomer.
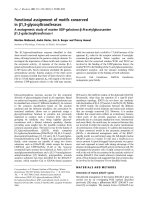
Figure 3-1.
SDS-Page showing the purification of recombinant
AtFKBP13 using Glutathione matrix. M- Marker, Lane 1- Lysate, Lane 2-
M 1 2 3 4 5 6 7
14.3
20.1
29.0
40.0
58.1
Chapter 3 Materials and Methods
57
Flow-through, Lane 3- Wash, Lane 4- Eluate, Lane 5- Thrombin cleaved,
Lane 6- FPLC purified.
3.2 CHLOROPLAST IMPORT ASSAYS AND PROTEIN LOCALIZATION
A radiolabeled AtFKBP13 precursor protein was synthesized by a coupled
transcription and translation procedure in wheat germ extract,
in the presence of
[
35
S]methionine and [
35
S]cysteine. Chloroplasts
were isolated from pea and incubated
with the precursor protein
as described [Mould and Gray,1998]. Import assays containing
intact chloroplasts
(0.5 mg chlorophyll ml
-1
), 5 mM methionine, 5 mM cysteine, and
10
mM MgATP in a final volume of 500 µl of import buffer
[50 mM Hepes•KOH (pH 8.0),
0.33 M sorbitol] and 45 µl
of products from
in vitro
translation were incubated in
light
(100 µmol photons m
–2
s
–1
) for
45 min. For protein import in the presence of nigericin or
sodium azide, isolated chloroplasts were incubated with 5 µM
nigericin or 10 mM sodium
azide for 10 min on ice. The
35
S-labeled
precursor protein was then added and samples
were incubated
at 25 °C for 25 min in light. After import, protein
samples were analyzed
by electrophoresis on 20% polyacrylamide
gels in the presence of SDS followed by
fluorography. For protein
localization,
Arabidopsis
chloroplasts were isolated from
protoplasts
according to an earlier method [Sommerville et al., 1981]. The stromal and
luminal
fractions were analyzed by western blotting to determine the
distribution of
AtFKBP13 (and plastocyanin) in these two fractions.
Chapter 3 Materials and Methods
58
3.3 IN VITRO PROTEIN–PROTEIN INTERACTION ASSAYS
The purified precursor or mature form of AtFKBP13 protein was mixed
with
GST-Rieske fusion proteins (1:1 molar ratio), immobilized
on glutathione beads in a final
volume of 500 µl
containing binding buffer [50 mM Tris•HCl (pH 7.5), 100
mM NaCl,
0.1% Tween 20, 1 mM PMSF]. After gentle shaking for
1.5 h at 22 ºC, the beads were
pelleted and washed
three times with the binding buffer. Proteins were eluted by
10 mM
glutathione, resolved by SDS/PAGE, and detected by western
blot analysis.
3.4 PROTEIN EXTRACTION AND WESTERN BLOT ANALYSIS
Total proteins from leaves of 4-week old plants were extracted
in a buffer [50 mM
Tris (pH 7.5), 100 mM NaCl, 1 mM EDTA, 0.1%
Triton X-100, 5 mM DTT, 1 mM
PMSF, 1 mM benzamidine, 5 µg ml
-1
leupeptin, 5 µg ml
-1
aprotinin, 5 µg ml
-1
pepstatin
A].
The homogenate was mixed for 15 s, incubated on ice for 5 min,
and centrifuged at
12,000g for 10 min at 4 °C. The supernatant
was collected, and proteins were quantified
by using the Bradford
assay kit (Bio-Rad). For western blot analysis, 30 µg
of total
proteins were separated in 12% SDS polyacrylamide
gel and proteins were transferred
onto nitrocellulose membrane.
Bound antibodies were detected with a
chemiluminescence kit (Amersham Pharmacia).
3.5 FKBP13 REDUCTION BY THIOREDOXIN
Reduction experiments were performed using recombinant AtFKBP13 purified
after cleavage by thrombin. Reduction by the NADP/thioredoxin system of
Escherichia
Chapter 3 Materials and Methods
59
coli
was performed as described [Wong et al., 2003]. Recombinant AtFKBP13 (1.5
µ
g)
was incubated with 0.25 mM NADPH, 0.3
µ
g NADP-dependent thioredoxin reductase
(NTR), and 0.3
µ
g thioredoxin in 50 mM Tris-HCl (pH 7.5) at 25 °C for 20 min. Newly
exposed cysteines resulting from disulfide reduction were labeled with the addition of
thiol-specific fluorescent probe monobromobimane (mBBr) to 2 mM. After labeling, the
protein sample was separated by SDS-PAGE [Laemmli, 1970] and the fluorescence
recorded using Gel Doc-1000 fitted with a UV 365 nm transilluminator and the Quantity
One analysis program (Biorad). Subsequently, the protein pattern was revealed by
staining with Coomassie Blue G-250 and captured using a scanner.
3.6 PPIASE ASSAY
All assays were carried out using the GST-AtFKBP13 fusion protein. GST alone
showed no PPIase activity, and the fusion protein showed no reduction of PPIase activity
compared to the thrombin-cleaved pure protein. PPIase assay was performed using the
protocol of Kofron et al. (1991), with modifications. 45 nM enzyme was incubated with
1.5 mg
α
-chymotrypsin in reaction buffer [50 mM HEPES (pH 8.0), 100 mM NaCl] and
the reaction was allowed to stabilize to 10
°
C. AtFKBP13 was reduced by incubation
with 0.5
µ
M of chloroplast
m
-type or
E. coli
thioredoxin and 500 µM DTT for 20 min at
25
°
C. The synthetic peptide Suc-Ala-Ala-Pro-Phe-paranitroanilide was dissolved in 470
mM LiCl in trifluoroethanol to maximize the amount of peptide present as the cis-isomer.
The reaction was started by adding peptide substrate to a final concentration of 60
µ
M
and the catalysis was monitored at 390 nm in a Cary 3E UV/visible spectrometer (Varian)
Chapter 3 Materials and Methods
60
and data were obtained with the Kinetics application. k
cat
/
K
m
values were calculated as
k
obs
-k
0
/[PPIase], where k
0
represents the first order rate constant for spontaneous cis-trans
isomerisation [Liu et al., 1990].
3.7 BIOPHYSICAL PROPERTIES OF ATFKBP13
3.7.1 Circular dichroism spectroscopy
CD spectroscopy is a monitor of the overall protein secondary structure and is
sensitive to conformational changes [Drake, 1994]. For CD studies, recombinant
AtFKBP13 was prepared, which was eluted as a single peak from the HiLoad 16/60
Superdex-75 gel filtration column. The protein were then dialyzed against phosphate
buffer of varying pH. The secondary structures of the above protein under different pH
conditions were examined using their CD spectra. Each CD spectrum showed a large
negative differential molar extinction coefficient between 210 nm and 220 nm, with a
small trough between these wavelengths, as expected for proteins with α-helix and β-
sheet contents [Drake, 1994]. These characteristics of the native CD spectra are lost at pH
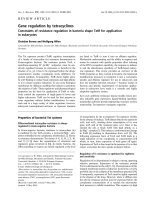
2.5, where the protein is in the substantially unfolded state. Fig. 3-2 shows the Far-UV
spectra of the native state and the unfolded state of this protein. The AtFKBP13 at pH 7.0
and at pH 6.0 spectra are very similar, and indicate that they have similarly folded
structures. They are readily distinguishable from AtFKBP13 at pH 2.5, which shows
more of random coil. The protein seems to be more stable at pH 4.0 but reveals a
reduction of β-strand by 4%.
Chapter 3 Materials and Methods
61
Figure 3-2.
CD spectra AtFKBP13 at 20 ºC and varying pH conditions.
The differential molar extinction coefficient is shown as a function of
wavelength. The sample concentration was 1.5 mg ml
-1
. Color codes used:
blue (pH 8.5), red (pH 7.0), yellow (pH 6.0), brown (pH 4.0), and green
(pH 2.5).
These results were obtained in three CD sessions with three independent preparations.
These results suggest that the protein at physiological acidic pH is active and retains its
secondary structure.
Chapter 3 Materials and Methods
62
3.7.2
Mass spectrometry
The precise mass of the protein was determined by MALDI TOF-MS (
Matrix
Assisted Laser Desorption Ionization Time-of-flight Mass Spectrometry
) here using a
Voyager-DE™ Biospectrometry™ workstation equipped with a 337-nm nitrogen laser.
To obtain a good signal-to-noise ratio, 150-200 single shot spectra were collected.
Saturated sinapinic acid in 50 % acetonitrile was used as the matrix. The fractionated
protein (0.5
µ
L) was mixed with 0.5
µ
L of the matrix and dried on 96
×
2 sample holder
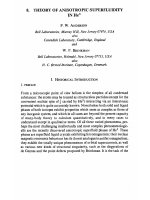
prior to the analysis. The molecular weight was determined to be 13,527 ± 1.07 Da (Fig.
3.3). This showed that the protein was >95% pure.
Figure 3-3.
Mass Spectrometry for AtFKBP13
Chapter 3 Materials and Methods
63
3.8 CRYSTALLIZATION AND DATA COLLECTION
3.8.1 Crystallization of AtFKBP13-S2
Initial screening of crystallization conditions followed the sparse-matrix sampling
method [Jancarik and Kim, 1991] using Crystal Screen (Hampton Research) and Protein
Crystallography Basic Kit (Sigma-Aldrich). Crystallization was performed using the
hanging-drop vapor-diffusion method [McPherson, 1990] at 293 K using a 24-well VDX
plate (Hampton Research). The size of the droplet, which consisted equal volumes of
AtFKBP13-S2 (oxidized AtFKBP13) and reservoir solution, was 5 µl. After 3 d, clusters
of twinned plate-like `sheaves' or needle-like crystals were found in three conditions at
2.0 M ammonium sulfate, 5% v/v isopropanol (Crystal Screen II, No. 5), 0.1 M HEPES
(pH 7.5), 2% PEG 400, 2.0 M ammonium sulfate (Crystal Screen I, No. 39) and 0.1 M
trisodium citrate (pH 5.6), 20% v/v isopropanol, 20% w/v PEG 4000 (Crystal Screen I,
No. 40).
Figure 3-4.
AtFKBP13-S2 crystal
Chapter 3 Materials and Methods
64
These conditions were used as the starting points for optimization experiments using
selected reagents from Additive Screens (Hampton Research) and varying the buffer,
temperature and protein concentration. Single crystals (Fig. 3-4) were grown at 293 K in
100 mM Tris (pH 7.9), 8-11% PEG 550 MME, 2.5 M ammonium sulfate. Nucleation
occurred within 3 days and crystals reached their maximum size in approximately two
weeks.
3.8.2 Crystallization of AtFKBP13-(SH)2
Crystals of reduced AtFKBP13 [AtFKBP13-(SH)2] were produced in the same
way as the oxidized AtFKBP13 crystals. The protein was maintained in the reduced form
throughout, over a period of two months, by the addition of DTT after crystallization.
3.8.3 Data collection and analysis
Prior to data collection, single crystals were rapidly swept through mother liquor
containing 20% (v/v) glycerol as a cryoprotectant and were flash-frozen in liquid nitrogen
at 100 K. Frozen crystals were screened at 100 K using an in-house X-ray facility
(Rigaku RU-H3R rotating-anode X-ray generator operated at 50 kV and 100 mA with an
R-AXIS IV imaging-plate detector).
Diffraction data for AtFKBP13-S2 and reduced AtFKBP13 were collected using
synchrotron radiation at 100 K (Oxford Cryostream). All diffraction intensities were
integrated and scaled using the HKL software package [Otwinowski and Minor, 1997].
The crystal data information is given Table 3-1.
Chapter 3 Materials and Methods
65
Table 3-1.
Crystal parameters, data-collection and processing statistics.
Values in parentheses are for the highest resolution shell, (1.92-1.85) and
(1.95-1.88 Å) respectively.
AtFKBP13-S2 AtFKBP13-(SH)2
Unit-cell parameters
Space group C222
1
C222
1
a (Å) 89.026 88.898
b (Å) 126.606 125.753
c (Å) 119.404 119.424
Matthews coefficient (Å
3
/Da) 2.5 2.5
Percentage solvent 50.3 50.3
No. of molecules in ASU 5 5
Data collection
X-ray source NSLS, BNL (X12B) APS (17-ID)
Detector ADSC Q315 CCD ADSC Q210 CCD
Resolution (Å) 1.85 1.88
Total observations 199040 3,190,736
Unique reflections 53,794 54,269
Completeness (%) 93.6 (71.3) 99.8 (98.4)
Redundancy 3.7 7.2
1
R
sym
0.080 (0.537) 0.089 (0.621)
1
R
sym
=
∑
hkl
∑
i
[|
I
i
(
hkl
) – <
I
(
hkl
)>| /
I
i
(
hkl
)]
Chapter 3 Materials and Methods
66
3.9 STRUCTURE DETERMINATION
3.9.1 Molecular replacement candidates
Sequence alignment with AtFKBP13 as well as spectroscopic studies suggests
that FKBPs are structurally homologous. After eliminating the NMR structures and the
structure of complexes, three possible candidates, human native Fkbp [PDB code: 1D6O,
Burkhard et al., 2000]; yeast Fkbp [PDB code: 1YAT Rotonda et al., 1993];
Bos taurus
Fkbp12 [PDB code: 1FKK, Wilson et al.,1995] were considered as probes for molecular
replacement. The statistics of each candidate are presented in Table 3-2.
Table 3-2.
Statistics of Fkbp probe candidates
From the alignment we see that all candidates share high sequence identities with
AtFKBP13. The structural homology was also confirmed by making a three-dimensional
Candidate PDB
code
Resolution,
Å
R-
value
Sequence
identities
Sequence
positives
Human native
Fkbp
1D6O 2.2 16.2% 32.71% 46.5%
Yeast Fkbp 1YAT 2.5 17.7% 38.93% 48.00%
Bos taurus
Fkbp12
1FKK 2.20 15.8% 32.71% 42.6%
Chapter 3 Materials and Methods
67
superposition of the given structures using the Dali program [Holm and Sander, 1993].
The root mean square deviation (r.m.s.d.) of the C
α
-atom positions in all three structures
is within 0.7 Å, confirming that each of these structures can be used as a molecular
replacement probe. However, yeast FKBP was chosen as the search probe since it has a
slightly higher percentage of positive sequence match.
3.9.2 Molecular replacement of AtFKBP13
The calculated solvent content of the oxidized AtFKBP13 crystal indicates that 5
AtFKBP13 molecules are present in the asymmetric unit. Different combinations of
resolution limits, integration radii, and temperature factor distributions were tested for
molecular replacement.
Table 3-3.
Translation function solutions for AtFKBP13-S2. α, β, γ are
Eulerian angles within the AMoRe conventions. t
x
, t
y
, t
z
are fractional
translations; R = R-factor.
Solution α β γ t
x
t
y
t
z
cc R
1-5 97.73 54.86 135.65 0.497 0.136 0.393 0.160 0.584
2-6 130.0 58.90 140.81 0.749 0.179 0.870 0.207 0.570
3-1 169.9 55.71 132.96 0.682 0.677 0.394 0.2550 0.552
4-1 19.66 56.55 140.87 0.034 0.416 0.377 0.295 0.543
5-5 31.13 29.99 77.24 0.659 0.600 0.970 0.303 0.541
Chapter 3 Materials and Methods
68
A rotational search using the 20 to 3 Å data in AMoRe [Navaza, 1994 ] resulted
in a set of 10 peaks with correlation coefficients larger than half of that of the first peak.
The translation search revealed the true nature of these peaks. The translation function
was performed on the best rotational peaks using the 20 - 3.0 Å resolution range data.
The height of the produced peaks was limited to half the height of the maximum peak.
The final output had a correlation coefficient of 30.3% and an R-factor of 54.1% (Table
3-3).
Rigid body fitting of these peaks improved the solution considerably. This rigid-
body refinement is considered to be another checking procedure, to prove the correctness
of the solutions. The least-squares minimization, with respect to the rotational and
positional parameters, is performed for each molecule while the others are kept fixed.
The rigid-body refinement of all the AtFKBP13 molecules yielded the final correlation
coefficient of 35.7% and R-factor of 49.2% for 20 to 3 Å data. These values confirmed
that these solutions were correct.
3.9.3 Molecular replacement of AtFKBP13-(SH)2
AtFKBP13-(SH)2 was solved by molecular replacement using the MOLREP
program (Vagin and Taplyakov, 1997) and the oxidized AtFKBP13 structure as the
probe. The Key active residues (Cys5, Cys17, Cys106 and Cys111) were mutated to
alanine to prevent any model bias. The final model had an R-factor of 35.7% and a
correlation value of 63.6%.
Chapter 3 Materials and Methods
69
3.10 STRUCTURE REFINEMENT
The
ARP
/
wARP
[Lamzin et al., 2001] software suite was used for automation of
model building and refinement using the molecular replacement solution.
The output of
warpNtrace
contained 80 to 98 % polypeptides fragments. Main-chain tracing and
building was performed using
XtalView
[McRee, 1999]. The remainder of the structure
(
cis
-prolines, poorly ordered loops and terminal residues for each fragment) was
manually completed using the
O
program [ Jones et al., 1991].
3.10.1 Structure refinement of AtFKBP13
Refinement of AtFKBP13 started with the calculation of 2F
obs
-F
calc
and F
obs
-F
calc
maps using the molecular replacement solutions. The first refinement started from an R-
factor of 0.49 with the atomic temperature factors fixed set at 20 Å
2
. In the initial stages,
only the atomic coordinates were refined. The restraints on geometry were adjusted by
adapting the relative weight of the contribution of the X-ray data. At the last stages,
temperature factors were allowed to refine isotropically and water was picked-up in five
cycles of the water-pick up program of CNS.
The model was checked for stereochemical correctness using the programs
PROCHECK and WHAT_CHECK [Laskowski et al., 1991; Hooft et al., 1996]. All
stereochemical parameters were flagged as either within normal limits or better when
compared to a structure at this resolution. There are two regions in the protein with
noticeably high temperature factors. These include both the N and C termini loop regions.
Chapter 3 Materials and Methods
70
We suggest that these loop regions may undergo a conformational change when the C-
terminal active site cysteins are reduced.
The error spikes in the PROCHECK [Laskowski
et al.
, 1993] output became
smaller in subsequent runs after the introduction of information suggested by the program
during the rebuilding stages. This indicated more geometrically acceptable changes are
incorporated and refinement is progressing in the right direction. Refinement of the water
molecules was made easier and more successful with when the automatic refinement
program ARP [Lamzin and Wilson, 1992].
3.10.2 Refinement of the reduced structure
Later it became clear that the N-terminus of the AtFKBP13-(SH)2 was poorly
defined, after which many omit maps were calculated (by setting the occupancy of
appropriate atoms to zero and performing a few cycles of refinement) and rebuilding was
attempted. To ensure that the structure was correct, a series of simulated-annealing
refinement was undertaken, followed by omit map calculations. Refinement was carried
out for each of the alternate conformations individually and also by co-refining them. The
final R-factor and other refinement statistics for both the molecules are given in Table 3-
4.
Chapter 3 Materials and Methods
71
Table 3-4.
Refinement parameters
AtFKBP13-S2 AtFKBP13-(SH)2
Resolution range (Å) 8–1.85 8–1.88
Reflections (working/test) 40,309/4,530 40,687/4,569
1
R
cryst
/ R
free
0.21 / 0.23 0.20 / 0.23
Final model:
Non-hydrogen atoms 4,630 4,630
Waters 463 313
Average B-factors (Å
2
):
Protein 21.497 32.367
Waters 32.060 39.379
R.M.S.D. in bond lengths (Å) 0.007 0.008
R.M.S.D. in bond angles (
°
) 1.7 1.6
1
R
-factor =
∑
hkl
||
F
o
(
hkl
)| – |
F
c
(
hkl
)|| /
∑
hkl
|
F
o
(
hkl
)|
The oxidized and reduced structures were superimposed and r.m.s.d calculations
were performed using the program O [Jones et al.,1991]. Coordinates of AtFKBP13-S2
and AtFKBP13- (SH2) have been deposited at the PDB with accession codes 1U79 and
1Y00 respectively.