A simulation by using cohesive zone model for indentation test in thin film substrate systems
Bạn đang xem bản rút gọn của tài liệu. Xem và tải ngay bản đầy đủ của tài liệu tại đây (1.14 MB, 98 trang )
A SIMULATION BY USING COHESIVE ZONE
MODEL FOR INDENTATION TEST IN
THIN-FILM/SUBSTRATE SYSTEMS
YIN YOU SHENG
(B.Sci. Fudan University)
A THESIS SUBMITTED FOR THE DEGREE OF MASTER OF ENGINEERING
DEPARTMENT OF MECHANICAL ENGINEERING
NATIONAL UNIVERSITY OF SINGAPORE
2007
1
ACKNOWLEDGEMENTS
The author of this master thesis would like to express his sincere appreciation to
his supervisor, Dr. Zeng Kaiyang, who has given the author much patient guidance
and invaluable advice during the course of this project. This master thesis may not
come out in time without Dr. Zeng’s encouragement and valuable suggestions. The
analysis methodology for scientific research he taught is an important experience for
the author.
The author also wants to express his gratitude to Mr. Yeap Kong Boon for both
his valuable theoretic advice and adequate experiment data, and these really help the
author significantly when performing finite element simulation in this project.
Last but not least, the author wants to thanks to all his family members, who have
given him so much support during his growth, and it is very lucky for him to have
them.
I
TABLE OF CONTENTS
Acknowledgement……………………………………………………………………I
Table of Contents……………………………………………………………………II
Summary…………………………………………………………………………….V
List of Figures…………………………………………………………………… VI
List of Tables………………………………………………………………………XI
Chapter 1 Introduction…………………………………………………………… 1
1.1 Background and Objectives……………………………………1
1.2 Nano Indentation Experiment………………….………………4
Reference…………………………………………………………………….…5
Chapter 2 Literature Review…… ….…………………………………………… 6
2.1 Theories of Indentation…………………… ………………… 6
2.1.1 Hardness…………………….……………………… 6
2.1.2 Nanoindentation……………… ………………… 7
2.1.3 Introduction to the theories of Wedge Indentation…….7
2.2 Introduction to Cohesive Zone Model… …………………… 12
2.2.1 Fundamental Theory of Cohesive Elements
Model in Interface……………………………………14
2.2.2 Review of Mixed mode Cohesive Zone Model… …17
2.2.3 Discussion on Cohesive Curve Shape
in Cohesive Zone Modeling… …………………… 19
II
2.2.4 Three-dimensional Cohesive Zone Model in
Finite Element Method…….………………………… 25
References………………………………….………………………………… 27
Chapter 3 Introduction to FEM Modeling of Wedge Indentations………………….31
3.1 Introduction……………… ….……………………………………31
3.2 Methodology………………….……………………………………33
3.3 Problem Formulation ….………………………………………….33
3.4 Introduction to Cohesive Element in ABAQUS………….… ……37
3.4.1 Overview………… ….…………………………………37
3.4.2 Cohesive Elements using a Traction-Separation
Description…………… ….…………………………….37
3.4.3 Damage Modeling……………………………………….41
References……………………………………………………………….… …43
Chapter 4 Modeling and Result………….………………………………….……….44
4.1 The Geometry ……………………………………….…………….44
4.2 The Material Properties of Film, Substrate and the Interface.….….45
4.3 The Analysis Technologies for Simulation….…… ………………48
4.4 The Interaction and Boundary Conditions for Case Study……… 48
4.5 Result Discussion…………………… …….………………….… 49
4.5.1 Indentation P-h Curves … ………………………….…49
4.5.2 Interface Cracking………………………………….……51
4.5.3 The Position of the Delamination Cracks….………….…52
III
4.5.4 The Evolution of Traction along this Path ….…….……54
4.6 Nanoindentation of the Films with Different Thickness… ……….56
4.6.1 Elastic Film case…………………………………………56
4.6.2 Film with Elastic-Plastic Behavior… ………………….62
4.7 Edge effect in Nano-indentation Experiment………………………68
4.7.1 Differences between the Simulation and
Indentation Experiment …………………………………68
4.7.2 Effects of Plane Strain Conditions… …………….…….69
4.7.3 Discussion……………………………………………….71
References………………………………….…………………………….…… 73
Chapter 5 Experiments and Discussion… …………………………………………74
5.1 Methodology…………………………………………………… 74
5.2 Compare Simulation with Experiment…………………………….74
5.3 The Results for Different Indenter Tip Angles…………………….80
References………………………………………………… ….………………83
Chapter 6 Conclusions and Future work ……………….…………………………84
6.1 Conclusions……………………………………………………… 84
6.1 Future Work……………………………………………………….86
IV
SUMMARY
This master thesis presents finite element simulation of interface adhesion
properties and interfacial delamination cracking processes of thin film systems
during indentation experiments using wedge-shape indenters. The cohesive zone
model based on traction separation law (T-S) is employed during the FEM
simulation. The cohesive zone model used in this thesis contains three important
parameters: interface strength, interface energy and the shape of the traction
separation law. This thesis studied the effect of interface strength and interface
energy on the initiation of interface delamination and effect of the thickness and
properties of the film on the interface adhesion and delamination processes. This
thesis also compared the FEM simulation results with the nanoindentation
experimental results obtained using two wedge indenters having 90
o
and 120
o
inclusion angles on thin-film/substrate systems. The similarity and differences
between the simulation and experiments are made. Commercial software ABAQUS
(version 6.5) is used in this simulation work.
V
LIST OF FIGURES
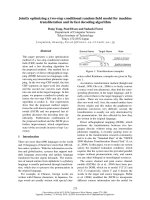
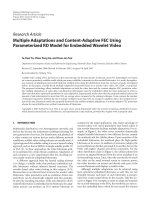
Fig 2-1 Schematic diagram showing the indentation of a surface by
a rigid wedge tip………………………………………………10
Fig 2-2 Idealized model of a hemispherical plastic ‘core’ attached
to the indenter surrounded by a symmetrically deformed
region [15]…………………………………………………… 11
Fig 2-3 Traction-separation relation governing separation of the
interface……………………………………………………… 15
Fig 2-4 A schematic of a Mode III crack containing a cohesive zone
ahead of the crack tip [17]…………………………………….19
Fig 2-5 The peel test by Volokh [31]…………………… … ……… 21
Fig 2-6
σ
-
δ
curve for bilinear cohesive zone model……………….…22
Fig 2-7
σ
-
δ
curve for parabolic cohesive zone model………….…….23
Fig 2-8
σ
-
δ
curve for sinusoidal cohesive zone model……………….23
Fig 2-9
σ
-
δ
curve for exponential cohesive zone model…………… 24
Fig 2-10 Local coordinate system for three-dimensional cohesive zone
element [23]……………………………………………….… 26
Fig 3-1 The geometry of the indenter tip and thin film/substrate system
used for FEM simulations in this research……………………34
Fig 3-2 The Model of thin film/substrate system……………… … …36
Fig 3-3 The structure of the mesh for the model of wedge indentation 36
VI
Fig 3-4 The deformation of the mesh during indentation and the initiation
of the crack at the interface…………………………………….37
Fig 3-5 A close-looking of the deformation of the mesh during
indentation and interfacial crack…………………………… 38
Fig 3-6 A typical traction-separation curve used for FEM simulation in
this project………………………………………………… 43
Fig 4-1 Geometry of the thin film/substrate system used in the FEM
model…………………………………………………………44
Fig 4-2 Geometry of the indenter used in the FEM model……………45
Fig 4-3 Boundary conditions used for the FEM model……………….49
Fig 4-4 FEM simulated indentation load-penetration curve for 400 nm
thickness film…………………………………………………50
Fig 4-5 The FEM simulation with cohesive elements at the interface
shows the crack formation at the indentation depth h=0.21….51
Fig 4-6 The geometry of cohesive zone model used for FEM
simulation…………………………………………………….52
Fig 4-7 Value of SDEG (overall value of the scalar damage variable)
along the interface (SDEG=1.0 indicated the position of the
cracking)…………………………………………………… 53
Fig 4-8 Shear stress component S
12
(Pa) along the interface……… 55
Fig 4-9 Normal stress component, S
22
(Pa) along the interface….… 55
Fig 4-10 The value of critical indentation load, P
c
, as function of the film
VII
thickness…………………………………………………… 58
Fig 4-11 The value of the critical indentation depth, D
c
, as function of the
film thickness…………………………………………… ….58
Fig 4-12 The value of critical indentation load, P
c
, as function of the
critical indentation depth, D
c
, for different film thicknesses 59
Fig 4-13 The FEM simulated load- penetration curve for thin film
system with the thickness of 0.5
m
μ
……………………….59
Fig 4-14 The FEM simulated load- penetration curve for thin film
system with the thickness of 0.6
m
μ
………………………60
Fig 4-15 The FEM simulated load- penetration curve for thin film
system with the thickness of 0.7
m
μ
………………………60
Fig 4-16 The FEM simulated load- penetration curve for thin film
system with the thickness of 0.8
m
μ
………………………61
Fig 4-17 The FEM simulated load- penetration curve for thin film
system with the thickness of 0.9
m
μ
………………………61
Fig 4-18 The FEM simulated load- penetration curve for thin film
system with the thickness of 1.0
m
μ
………………………62
Fig 4-19 The value of critical indentation load, P
c
, as function of film
thickness for the case of film is elastic-perfect plastic……64
Fig 4-20 The value of critical indentation depth, D
c
, as function of film
thickness for the case of film is elastic-perfect plastic……64
Fig 4-21 The FEM simulated indentation load- penetration curve for the
VIII
thin film system with the thickness of 0.5
m
μ
and the film is
assumed elastic-perfect-plastic………………………….… 65
Fig 4-22 The FEM simulated indentation load- penetration curve for the
thin film system with the thickness of 0.6
m
μ
and the film is
assumed elastic-perfect-plastic………………………….… 65
Fig 4-23 The FEM simulated indentation load- penetration curve for the
thin film system with the thickness of 0.7
m
μ
and the film is
assumed elastic-perfect-plastic………………………….… 66
Fig 4-24 The FEM simulated indentation load- penetration curve for the
thin film system with the thickness of 0.8
m
μ
and the film is
assumed elastic-perfect-plastic……………………… ……66
Fig 4-25 The FEM simulated indentation load- penetration curve for
the thin film system with the thickness of 0.9
m
μ
and the
film is assumed elastic-perfect-plastic…………………….67
Fig 4-26 (a) FEM simulation of the wedge indentation of fine line
structures (L>=b), and (b) Experimental wedge indentation of
continuous film (L<<film width)……………………………69
Fig 4-27 The geometry of the model for the continuous film case… 70
Fig 4-28 FEM simulated load-penetration curve for the case of the thin
film with 5
m
μ
width………………………………………72
Fig 4-29 FEM simulated load-penetration curve for the case of the thin
film with 30
m
μ
width…………………………………… 72
IX
Fig 5-1 FEM simulated load—penetration curve for thin film with
thickness of 100 nm………………………………….…….77
Fig 5-2 Experimental load—penetration curve for thin film with
thickness of 100 nm…………………………………………77
Fig 5-3 FEM simulated load—penetration curve for thin film with
thickness of 300 nm…………………………………………78
Fig 5-4 Experimental load—penetration curve for thin film with
thickness of 300 nm…………………………………………78
Fig 5-5 FEM simulated load—penetration curve for thin film with
thickness of 500 nm…………………………………………79
Fig 5-6 Experimental load—penetration curve for thin film with
thickness of 500 nm.…………………………………………79
Fig 5-7 FEM simulated load—penetration curve for thin film with
thickness of 100 nm (indenter tip angle is 120°)…………….81
Fig 5-8 FEM simulated load—penetration curve for thin film with
thickness of 300 nm (indenter tip angle is 120°)………….…82
Fig 5-9 FEM simulated load—penetration curve for thin film with
thickness of 500 nm (indenter tip angle is 120°)……….……82
X
LIST OF TABLES
Table 4-1 Material properties of thin film and substrate……….… …46
Table 4-2 Values of D
c
and P
c
for thin film/substrate systems with
different film thicknesses……………………….………….57
Table 4-3 The critical penetration depth and the critical load for
elastic-plastic cases……………………………….……… 63
Table 4-4 Material properties for film and substrate……………… 71
Table 5-1 The material properties for the three films….…… ………74
XI
Chapter 1 Introduction
1.1 Background and Objectives
Thin film/substrate systems are found in many important engineering
applications such as micro-electronics, optoelectronics, display panels and
many other devices. Many techniques, for instance, sputtering, vapor
deposition, ion implantation and laser glazing are employed to fabricate thin
film/substrate systems.
In the applications mentioned above, one of the most important issue is the
properties of interface between film and substrate. Since the delaminations
caused by a crack at the interface will lead to the failure of the devices
containing the thin film/substrate system, it is therefore very important to
study the mechanisms of delamination initiation, and its evolution as well as
how to improve the stability and reliability of the interface in the thin
film/substrate systems. Interface adhesion is one of the important properties
which characterizes the stability and reliability of the interface.
Many experimental techniques have been developed to determine the
interface adhesion properties. Nanoindentation is one of the methods used for
this purpose. Nanoindentation technique has been used as a convenient and
most straight forward method to measure the mechanical properties of thin
film/substrate systems for dozens of years. This method is also used to
characterize the interface adhesion properties. However, because of the
1
difficulties in interpreting experimental data, there are still many challenging
issues to be understood in order to make this method more useful to
characterize the interface properties.
This thesis therefore used a finite element method (FEM) with cohesive
zone model to simulate the nanoindentation experiments and to study the
mechanical characteristics of the thin film/substrate interfaces with (1)
different material properties of thin films and substrate; (2) the different
inclusion angles of the indenter tips. It is assumed that there is a cohesive zone
ahead of the crack tip at the interface, which consists of upper and lower
surfaces held by the cohesive traction. The cohesive traction of the interface is
related to the separation displacement between the upper and lower surfaces.
The relationship of cohesive traction and the separation displacement is often
called as “Traction-Separation law” (T-S law).
During the nanoindentation experiments, the relationship between the
applied load and the penetration depth of the indenter tip into the surface of
the materials is recorded and such a curve is usually called the
load-displacement curve. The FEM simulation performed in this work has
reported this load-displacement curve and the interface delamination initiation
is associated with the characteristics of this curve. Further more, these
characteristics in the load-displacement curves are discussed when comparing
the simulation and the nanoindentation experimental results. From the
load-displacement curve, one can find a critical indentation load and a critical
2
indentation depth associated with the initial delamination crack at the thin
film/substrate interface, and using the mechanical analysis, the general
properties of interface adhesion can be determined. However, to determine the
exact value of interface strength, interface energy and the shape of traction
separation law from the indentation load-penetration curve is very difficult due
to several complicated conditions such as environment temperatures and
different angles of indenter. In addition, the real thickness of the interface
adhesion is difficult to determine. This thesis simplified these conditions by
several methods, for example, by doing parameter normalization and assuming
a unit thickness for interface in order to simulate the crack at interface with
zero thickness.
The objectives of this research are:
1. To explore how to use the finite element simulation software –
ABAQUS with the cohesive zone model to study the initiation and
propagation of the delamination crack at the thin film/substrate interface
during the nanoindentation.
2. To establish an FEM model with cohesive zone model for analyzing
wedge indentation of thin film, and to develop a general methodology to
determine interface strength and interface energy through the wedge
indentation experiments
3. To study the effects of film thicknesses, material properties of the film
and the substrate, and indenter geometries on the interfacial delamination
3
based on the simulation.
4. To predict the critical indentation load and critical indentation depth for
the initiation of the delamination crack at the interface during the wedge
indentation experiments.
1.2 Nano Indentation Experiment
Nano-indentation is a powerful experimental technique to determine the
mechanical properties of materials at submicron to nanometer scales. These
properties include hardness and elastic modulus. Nanoindentation technique
was developed in early 1980s by Pethica et al. [1]. The basic analysis of the
nano-indentation was first developed by Doerner and Nix in 1986 [2], and
later on modified by Oliver and Pharr in 1992 [3].
During the nano-indentation tests, the penetration depth is in the order of
nanometers to microns. The load-penetration curve is recorded continuously
during indentation experiments, and such curve can be used to derive
important mechanical parameters, such as hardness and elastic modulus. For
most bulk materials the values of elastic modulus are consistent with those
obtained by standard tensile testing. In this thesis, nano-indentation
experiments using wedge sharp indenter are simulated using FEM method to
determine the value of interface adhesion strength, critical failure load, and
critical displacement for interfacial delamination during nano-indentations.
This thesis includes six chapters. After this introduction chapter, related
4
literature studies are summarized in Chapter 2. The literature studies include
two parts, indentation theory and cohesive zone model. Chapter 3 describes
the finite element modeling of the wedge indentation using ABAQUS with the
cohesive zone model. Chapter 4 discusses the simulation results and the main
factors affecting the simulation and the simulated results are compared with
experimental results in Chapter 5. Finally conclusions and recommendations
for future work are summarized in Chapter 6.
REFERENCES:
[1]. J.B.Pethica, R.Hutchings and W.C.Oliver, Philos. Mag.
A, 48, 593 (1983).
[2]. M.F.Doerner and W.D.Nix., J. Mater. Res., 1, 601,
(1986).
[3]. W.C.Oliver and G.M.Pharr, J.Mater. Res., 7, 1564,
(1992).
5
Chapter 2 Literature Review
2.1 Theories of Indentation
2.1.1 Hardness
Hardness is one of the commonly-measured mechanical properties by
indentation experiments. There are three main categories of hardness by
different measuring methods: scratch hardness, indentation hardness and
dynamic hardness [1].
The scratch hardness indicates the ability of one solid to be scratched by
another. The scratch experiment is simple but it is complicated in theory
therefore the scrach hardness can not be easily defined [2]. Indentation
hardness is determined by the load and the corresponding size of the
permanent impression formed in static indentations. Dynamic hardness is
expressed in terms of either the height of rebound of the indenter, or the
energy of impact and the size of the remaining indentation, which makes the
number of the test variables beyond manageable level.
Hertz [3] was the first one to relate the absolute value of hardness with the
least value of the pressure beneath a spherical indenter. Then Auerbach [4],
Meyer [5] and Hoyt [6] developed various measurements and theory, finally
the definition of hardness is generally accepted as:
max
P
H
A
=
(2.1)
where H is the hardness, P
max
is the maximum load of the indenter and A
6
represents the projected contact area of the specimen at the maximum load.
2.1.2 Nanoindentation
Nano-indentation is a later development of the indentation technique. It is
commonly used to determine the mechanical properties of thin film/substrate
systems. It has the capability to make the indentation at small load range, such
as millinewton range and be able to measure the very small deformation
created by the indentation, usually in the order of nanometers to microns.
In the conventional macro/micro indentation experiments, it is needed to
measure the contact area using microscopes, which usually leads to errors in
the measurement because of the small contact area and the elastic recovery
during the unloading process. On the contrary, nanoindentation technique can
record the load and the corresponding penetration depth continuously with
high resolution. Hence, the direct measurement of contact area is not necessary.
Therefore nanoindentation technique will get more accurate results in terms of
load and penetration depth. In addition, the elastic modulus and hardness of
the specimen can be obtained from the analysis of the experimental obtained
load and penetration depth data.
2.1.3 Introduction to the theories of Wedge Indentation
Hill et al. [7] gave a theoretical analysis for an experiment in which
elastic-plastic material is penetrated by a rigid and frictionless wedge. This
7
analysis based mainly on two assumptions:
1. The material is incompressible
2. The material is rigid until the yield strength is reached.
Hill tested lead specimens indented by sharp steel indenters with the largest
semi-angle of 30
o
and the results correlated with his theory well [7]. This
theory was further proved by Dugdale [8]. Later on, Grunzweig [9] presented
a solution for an indentation with a rough wedge indenter following Hilll’s
theory. The major difference is that the slip lines do not meet the wedge face at
45° when the wedge is rough and the effect of friction increases the apparent
indentation pressure depending on the angle of the wedge tip and the
coefficient of friction between the wedge tip and the specimen. Based on
theory of indentation test on elastic-perfectly-plactic solid, Tabor [10]
proposed the relationship of the mean contact pressure and the yield strength
of the material:
m
p
CY
=
(2.2)
where P
m
represents the mean contact pressure, Y is the yield strength, and C
is a constant around 3. Later on Mulhearn [11] found that different angles of
indenters might also contribute to the results of indentation tests. For example,
if the semi-angle of the indenter is less than about 30°, Hill’s theory works
well, but when it exceeds 30° there should be another theory to explain the
mechanism. When the indenter tip angle is lager than 30°, the deformation
field can be approximated as a radial compression centered at the bottom of
8
the indenter. Marsh [12] further linked Mulhearn’s mechanism to a cavity in
an elastic-plastic material being expanded by internal pressure. He found that
the elastic modulus of material played a critical role in this deformation
mechanism. When the value of the ratio of elastic modulus to yield strength
E/Y is high, the material would be amenable to radial compression and change
easily under radial flow mechanism of deformation. Under the same theory,
Hirst and Howse [13] measured indentation pressure for various materials by
using wedge indenters with different angles. Their result showed that there
were four main types of deformation and Hill’s theory for plastic rigid solid
could be applied when the angle of wedge indenter was acute enough and the
E/Y ratio of the material was high, for other situations the indentation pressure
should be written in another relation:
ln( / )
m
p
M
NEY
Y
=+
(2.3)
where M is a constant related to the angle of wedge indenter and N is almost a
constant when the angle of wedge exceeds 120°. For blunt wedges and highly
elastic materials, elastic deformation happens and it could be modeled as an
elastic solid indented by a rigid wedge. The pressure induced by the wedge
indenter at a point x is therefore can be found as [14]:
()
(
1
2
cot
cosh /
1
E
)
p
ax
v
θ
π
−
=
−
(2.4)
where x is the distance from the center of wedge indenter, a is the half-width
of the indentation,
θ
is the semi-angle of wedge. The mean pressure p
m
is
9
given by:
()
2
cot
21
m
E
p
v
θ
=
−
(2.5)
This elastic theory predicts the distribution of pressure and the mean
pressure well, but the pressure within a narrow central band under the indenter
is below the values it predicted.
In his famous work, Johnson [15] found that, for blunt wedge indenters and
materials with a low ratio of elastic modules to yield strength, the indentation
pressure correlated with a single parameter expressed as (E/Y) tan
β
, here
β
is the angle of inclination of indenter to the surface. Johnson modified the
expanding cavity model by replacing the cavity with an incompressible
hemispherical core expended by an internal pressure as shown in Fig (2-1) and
Fig (2-2):
Fig 2-1 Schematic diagram showing the indentation of a surface by a
rigid wedge tip.
10
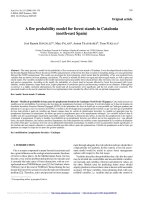
Fig 2-2 Idealized model of a hemispherical plastic ‘core’ attached to the
indenter surrounded by a symmetrically deformed region [15]
In Johnson’s model [15], similar to the case of an infinite elastic
perfectly-plastic body with a cylindrical or spherical cavity under pressure, the
pressure within the core was assumed to be hydrostatic, and the stress and
displacement outside the core were assumed to be radial symmetric. The
elastic-plastic boundary lies at a radius of c, and the radial stress and
displacement were given:
21
ln
2
3
r
ra
p
c
YY a
σ
=
⎡
⎤
⎡⎤ ⎛⎞
=− = +
⎜⎟
⎢
⎥
⎢⎥
⎝⎠
⎣⎦
⎣
⎦
(2.6)
(
)
(
)
31 2
254
22
3
du r v
Yvc
dc E r c
−
r
⎡
⎤
−
=−
⎢
⎥
⎣
⎦
(2.7)
Neglecting the compressibility of the core, then:
11
(
)
22tanadu a adh a da
π
β
==
(2.8)
Substitute r = a into equation (2.7), dc/da = c/a, and then we obtain:
() (
2
4
tan 5 4 3 1 2
Ec
v
Ya
β
π
⎛⎞
=− − −
⎜⎟
⎝⎠
)
v
(2.9)
From Eq.(2.6) and Eq.(2.9), we have:
() ()
14
1ln54 ln tan 312
3
pE
vv
YY
β
π
⎧⎫
⎡
⎤
=−−+ +−
⎨⎬
⎢
⎥
⎣
⎦
⎩⎭
(2.10)
If compressibility is neglected, the Poisson’s ratio should be 0.5, therefore
we obtain:
14
1ln tan
3
3
pE
YY
β
π
⎡⎤
⎛⎞
=+
⎜
⎢
⎝⎠
⎣⎦
⎟
⎥
(2.11)
This relation was obtained within small values of strain and
β
, however,
the result agreed well with the experiments untill
β
=30°. Therefore, this
relation is widely accepted and used in the analysis of wedge indentation
experiments.
2.2 Introduction to Cohesive Zone Model
Perhaps one of the greatest achievements of continuum mechanics in the
20th century is that researchers can predict crack propagation in many media
using fracture mechanics theory, such as the theory of Griffith’s fracture for an
ideal elastic material [16]. Linear elastic fracture mechanics (LEFM) predicts
that the stress at the crack tip in a brittle material is singular and infinite [17],
12
which is physically unrealistic. It is Barenblatt [18] who first described
fracture as a process of a material separation across a surface. This model
appears by different names, such as cohesive process zone model, cohesive
zone model, and so on. In recent years, the cohesive zone model has become
one of the most popular models to simulate fracture in materials and structures.
The cohesive zone model is originally applied to concrete and cementitious
composites and interface fracture (see, for example, [19]). It is assumed that
ahead of the physical crack tip, there is a cohesive zone which consists of
upper and lower surfaces held by a cohesive traction. The cohesive traction is
related to the separation displacement between the two surfaces. The
relationship between the cohesive traction and the separation displacement can
be called as “cohesive law” or “Traction-Separation law”. When an extended
is force applied to the models, the upper and lower surfaces separate gradually,
after the separation of these surfaces at the edges of the cohesive zone model
reaches a critical value, the separation of the two surfaces leads to the crack
growth. Although the cohesive zone model was originally proposed for model
I fracture for the purpose of removing the crack tip stress singularity [20], it
can also be applied in model III fracture process [17].
The necessary condition to eliminate stress singularity at the crack tip is
that the cohesive traction must be a nonzero value at an initial vanishing
separation displacement [21]. Additional fracture energy dissipation
mechanism is needed besides the fracture process in cohesive zone when the
13