Intruduction to statistical quality control
Bạn đang xem bản rút gọn của tài liệu. Xem và tải ngay bản đầy đủ của tài liệu tại đây (5.92 MB, 754 trang )
Sixth Edition
I
ntroduction to
Statistical
Quality Control
DOUGLAS C. MONTGOMERY
Arizona State University
John Wiley & Sons, Inc.
Executive Publisher: Don Fowley
Associate Publisher: Daniel Sayer
Acquisitions Editor: Jennifer Welter
Marketing Manager: Christopher Ruel
Production Manager: Dorothy Sinclair
Production Editor: Sandra Dumas
Senior Designer: Kevin Murphy
New Media Editor: Lauren Sapira
Editorial Assistant: Mark Owens
Production Management Services: Elm Street Publishing Services
Composition Services: Aptara, Inc.
This book was typeset in 10/12 Times by Aptara, Inc., and printed and bound by R. R. Donnelley (Jefferson City).
The cover was printed by R. R. Donnelley (Jefferson City).
The paper in this book was manufactured by a mill whose forest management programs include sustained yield
harvesting of its timberlands. Sustained yield harvesting principles ensure that the number of trees cut each year
does not exceed the amount of new growth.
This book is printed on acid-free paper.
Copyright © 2009 by John Wiley & Sons, Inc. All rights reserved.
No part of this publication may be reproduced, stored in a retrieval system or transmitted in any form or by any
means, electronic, mechanical, photocopying, recording, scanning or otherwise, except as permitted under Sections
107 or 108 of the 1976 United States Copyright Act, without either the prior written permission of the Publisher or
authorization through payment of the appropriate per-copy fee to the Copyright Clearance Center, 222 Rosewood
Drive, Danvers, MA 01923, (978) 750-8400, fax (978) 750-4470. Requests to the Publisher for permission should
be addressed to the Permissions Department, John Wiley & Sons, Inc., 111 River Street, Hoboken, NJ 07030,
(201)748-6011, fax (201)748-6008, E-mail: To order books or for customer service,
call 1-800-CALL-WILEY(225-5945).
Montgomery, Douglas, C.
Introduction to Statistical Quality Control, Sixth Edition
978-0-470-16992-6
Printed in the United States of America.
10 9 8 7 6 5 4 3 2 1
A
bout the Author
Douglas C. Montgomery is Regents’ Professor of Industrial Engineering and Statistics and
the Arizona State University Foundation Professor of Engineering. He received his B.S.,
M.S., and Ph.D. degrees from Virginia Polytechnic Institute, all in engineering. From 1969 to
1984 he was a faculty member of the School of Industrial & Systems Engineering at the
Georgia Institute of Technology; from 1984 to 1988 he was at the University of Washington,
where he held the John M. Fluke Distinguished Chair of Manufacturing Engineering, was
Professor of Mechanical Engineering, and was Director of the Program in Industrial
Engineering.
Dr. Montgomery has research and teaching interests in engineering statistics including
statistical quality-control techniques, design of experiments, regression analysis and empirical
model building, and the application of operations research methodology to problems in man-
ufacturing systems. He has authored and coauthored more than 190 technical papers in these
fields and is the author of twelve other books. Dr. Montgomery is a Fellow of the American
Society for Quality, a Fellow of the American Statistical Association, a Fellow of the Royal
Statistical Society, a Fellow of the Institute of Industrial Engineers, an elected member of the
International Statistical Institute, and an elected Academican of the International Academy of
Quality. He is a Shewhart Medalist of the American Society for Quality, and he also has
received the Brumbaugh Award, the Lloyd S. Nelson Award, the William G. Hunter Award, and
two Shewell Awards from the ASQ. He is a recipient of the Ellis R. Ott Award. He is a former
editor of the Journal of Quality Technology, is one of the current chief editors of Quality and
Reliability Engineering International, and serves on the editorial boards of several journals.
iii
This page intentionally left blank
P
reface
Introduction
This book is about the use of modern statistical methods for quality control and improvement. It
provides comprehensive coverage of the subject from basic principles to state-of-the-art concepts
and applications. The objective is to give the reader a sound understanding of the principles and the
basis for applying them in a variety of situations. Although statistical techniques are emphasized
throughout, the book has a strong engineering and management orientation. Extensive knowledge
of statistics is not a prerequisite for using this book. Readers whose background includes a basic
course in statistical methods will find much of the material in this book easily accessible.
Audience
The book is an outgrowth of more than 35 years of teaching, research, and consulting in the
application of statistical methods for industrial problems. It is designed as a textbook for students
enrolled in colleges and universities, who are studying engineering, statistics, management, and
related fields and are taking a first course in statistical quality control. The basic quality-control
course is often taught at the junior or senior level. All of the standard topics for this course are
covered in detail. Some more advanced material is also available in the book, and this could be
used with advanced undergraduates who have had some previous exposure to the basics or in a
course aimed at graduate students. I have also used the text materials extensively in programs for
professional practitioners, including quality and reliability engineers, manufacturing and devel-
opment engineers, product designers, managers, procurement specialists, marketing personnel,
technicians and laboratory analysts, inspectors, and operators. Many professionals have also
used the material for self-study.
Chapter Organization and Topical Coverage
The book contains five parts. Part I is introductory. The first chapter is an introduction to the
philosophy and basic concepts of quality improvement. It notes that quality has become a major
business strategy and that organizations that successfully improve quality can increase their pro-
ductivity, enhance their market penetration, and achieve greater profitability and a strong compet-
itive advantage. Some of the managerial and implementation aspects of quality improvement are
included. Chapter 2 describes DMAIC, an acronym for define, measure, analyze, improve, and
control. The DMAIC process is an excellent framework to use in conducting quality improvement
projects. DMAIC often is associated with six-sigma, but regardless of the approach taken by an
organization strategically, DMAIC is an excellent tactical tool for quality professionals to employ.
Part II is a description of statistical methods useful in quality improvement. Topics include
sampling and descriptive statistics, the basic notions of probability and probability distributions,
point and interval estimation of parameters, and statistical hypothesis testing. These topics are
usually covered in a basic course in statistical methods; however, their presentation in this text
v
is from the quality-engineering viewpoint. My experience has been that even readers with a
strong statistical background will find the approach to this material useful and somewhat dif-
ferent from a standard statistics textbook.
Part III contains four chapters covering the basic methods of statistical process control
(SPC) and methods for process capability analysis. Even though several SPC problem-solving
tools are discussed (including Pareto charts and cause-and-effect diagrams, for example), the
primary focus in this section is on the Shewhart control chart. The Shewhart control chart cer-
tainly is not new, but its use in modern-day business and industry is of tremendous value.
There are four chapters in Part IV that present more advanced SPC methods. Included are
the cumulative sum and exponentially weighted moving average control charts (Chapter 9), sev-
eral important univariate control charts such as procedures for short production runs, autocorre-
lated data, and multiple stream processes (Chapter 10), multivariate process monitoring and
control (Chapter 11), and feedback adjustment techniques (Chapter 12). Some of this material
is at a higher level than Part III, but much of it is accessible by advanced undergraduates or first-
year graduate students. This material forms the basis of a second course in statistical quality
control and improvement for this audience.
Part V contains two chapters that show how statistically designed experiments can be used
for process design, development, and improvement. Chapter 13 presents the fundamental con-
cepts of designed experiments and introduces factorial and fractional factorial designs, with par-
ticular emphasis on the two-level system of designs. These designs are used extensively in the
industry for factor screening and process characterization. Although the treatment of the subject
is not extensive and is no substitute for a formal course in experimental design, it will enable the
reader to appreciate more sophisticated examples of experimental design. Chapter 14 introduces
response surface methods and designs, illustrates evolutionary operation (EVOP) for process
monitoring, and shows how statistically designed experiments can be used for process robust-
ness studies. Chapters 13 and 14 emphasize the important interrelationship between statistical
process control and experimental design for process improvement.
Two chapters deal with acceptance sampling in Part VI. The focus is on lot-by-lot accep-
tance sampling, although there is some discussion of continuous sampling and MIL STD 1235C
in Chapter 14. Other sampling topics presented include various aspects of the design of
acceptance-sampling plans, a discussion of MIL STD 105E, MIL STD 414 (and their civilian
counterparts, ANSI/ASQC ZI.4 and ANSI/ASQC ZI.9), and other techniques such as chain sam-
pling and skip-lot sampling.
Throughout the book, guidelines are given for selecting the proper type of statistical tech-
nique to use in a wide variety of situations. Additionally, extensive references to journal articles
and other technical literature should assist the reader in applying the methods described. I also
have showed how the different techniques presented are used in the DMAIC process.
Supporting Text Materials
Computer Software
The computer plays an important role in a modern quality-control course. This edition of the
book uses Minitab as the primary illustrative software package. I strongly recommend that the
course have a meaningful computing component. To request this book with a student version of
Minitab included, contact your local Wiley representative at www.wiley.com and click on the tab
for “Who’s My Rep?” The student version of Minitab has limited functionality and does not
include DOE capability. If your students will need DOE capability, they can download the fully
functional 30-day trial at www.minitab.com or purchase a fully functional time-limited version
from e-academy.com.
vi
Preface
Supplemental Text Material
I have written a set of supplemental materials to augment many of the chapters in the book. The
supplemental material contains topics that could not easily fit into a chapter without seriously
disrupting the flow. The topics are shown in the Table of Contents for the book and in the indi-
vidual chapter outlines. Some of this material consists of proofs or derivations, new topics of a
(sometimes) more advanced nature, supporting details concerning remarks or concepts presented
in the text, and answers to frequently asked questions. The supplemental material provides an
interesting set of accompanying readings for anyone curious about the field. It is available at
www.wiley.com/college/montgomery.
Student Resource Manual
The text contains answers to most of the odd-numbered exercises. A Student Resource Manual
is available from John Wiley & Sons that presents comprehensive annotated solutions to these
same odd-numbered problems. This is an excellent study aid that many text users will find
extremely helpful. The Student Resource Manual may be ordered in a set with the text or pur-
chased separately. Contact your local Wiley representative to request the set for your bookstore
or purchase the Student Resource Manual from the Wiley Web site.
Instructor’s Materials
The instructor’s section of the textbook Web site contains the following:
1. Solutions to the text problems
2. The supplemental text material described above
3. A set of Microsoft
®
PowerPoint
®
slides for the basic SPC course
4. Data sets from the book, in electronic form
5. Image Gallery, illustrations from the book in electronic format
The instructor’s section is for instructor use only and is password-protected. Visit the Instructor
Companion Site portion of the Web site, located at www.wiley.com/college/montgomery, to reg-
ister for a password.
The World Wide Web Page
The Web page for the book is accessible through the Wiley home page. It contains the supplemental
text material and the data sets in electronic form. It will also be used to post items of interest to
text users. The Web site address is www.wiley.com/college/montgomery. Click on the cover of
the text you are using.
ACKNOWLEDGMENTS
Many people have generously contributed their time and knowledge of statistics and quality
improvement to this book. I would like to thank Dr. Bill Woodall, Dr. Doug Hawkins, Dr. Joe
Sullivan, Dr. George Runger, Dr. Bert Keats, Dr. Bob Hogg, Mr. Eric Ziegel, Dr. Joe Pignatiello,
Dr. John Ramberg, Dr. Ernie Saniga, Dr. Enrique Del Castillo, Dr. Sarah Streett, and Dr. Jim
Alloway for their thorough and insightful comments on this and previous editions. They gener-
ously shared many of their ideas and teaching experiences with me, leading to substantial
improvements in the book.
Over the years since the first edition was published, I have received assistance and ideas
from a great many other people. A complete list of colleagues with whom I have interacted
Preface
vii
would be impossible to enumerate. However, some of the major contributors and their profes-
sional affiliations are as follows: Dr. Mary R. Anderson-Rowland, Dr. Dwayne A. Rollier, Dr.
Norma F. Hubele, and Dr. Murat Kulahci, Arizona State University; Mr. Seymour M. Selig,
formerly of the Office of Naval Research; Dr. Lynwood A. Johnson, Dr. Russell G. Heikes, Dr.
David E. Fyffe, and Dr. H. M. Wadsworth, Jr., Georgia Institute of Technology; Dr. Sharad
Prabhu and Dr. Robert Rodriguez, SAS Institute; Dr. Scott Kowalski, Minitab; Dr. Richard L.
Storch and Dr. Christina M. Mastrangelo, University of Washington; Dr. Cynthia A. Lowry,
formerly of Texas Christian University; Dr. Smiley Cheng, Dr. John Brewster, Dr. Brian
Macpherson, and Dr. Fred Spiring, the University of Manitoba; Dr. Joseph D. Moder, University
of Miami; Dr. Frank B. Alt, University of Maryland; Dr. Kenneth E. Case, Oklahoma State
University; Dr. Daniel R. McCarville, Dr. Lisa Custer, Dr. Pat Spagon, and Mr. Robert Stuart, all
formerly of Motorola; Dr. Richard Post, Intel Corporation; Dr. Dale Sevier, San Diego State
University; Mr. John A. Butora, Mr. Leon V. Mason, Mr. Lloyd K. Collins, Mr. Dana D. Lesher,
Mr. Roy E. Dent, Mr. Mark Fazey, Ms. Kathy Schuster, Mr. Dan Fritze, Dr. J. S. Gardiner, Mr.
Ariel Rosentrater, Mr. Lolly Marwah, Mr. Ed Schleicher, Mr. Amiin Weiner, and Ms. Elaine
Baechtle, IBM; Mr. Thomas C. Bingham, Mr. K. Dick Vaughn, Mr. Robert LeDoux, Mr. John
Black, Mr. Jack Wires, Dr. Julian Anderson, Mr. Richard Alkire, and Mr. Chase Nielsen, the Boeing
Company; Ms. Karen Madison, Mr. Don Walton, and Mr. Mike Goza, Alcoa; Mr. Harry Peterson-
Nedry, Ridgecrest Vineyards and The Chehalem Group; Dr. Russell A. Boyles, formerly of
Precision Castparts Corporation; Dr. Sadre Khalessi and Mr. Franz Wagner, Signetics Corporation;
Mr. Larry Newton and Mr. C. T. Howlett, Georgia Pacific Corporation; Mr. Robert V. Baxley,
Monsanto Chemicals; Dr. Craig Fox, Dr. Thomas L. Sadosky, Mr. James F. Walker, and Mr. John
Belvins, the Coca-Cola Company; Mr. Bill Wagner and Mr. Al Pariseau, Litton Industries; Mr. John
M. Fluke, Jr., John Fluke Manufacturing Company; Dr. Paul Tobias, formerly of IBM and
Semitech; Dr. William DuMouchel and Ms. Janet Olson, BBN Software Products Corporation. I
would also like to acknowledge the many contributions of my late partner in Statistical Productivity
Consultants, Mr. Sumner S. Averett. All of these individuals and many others have contributed to
my knowledge of the quality improvement field.
Other acknowledgments go to the editorial and production staff at Wiley, particularly Ms.
Charity Robey and Mr. Wayne Anderson, with whom I worked for many years, and Ms. Jenny
Welter; they have had much patience with me over the years and have contributed greatly toward
the success of this book. Dr. Cheryl L. Jennings made many valuable contributions by her care-
ful checking of the manuscript and proof materials. I also thank Dr. Gary Hogg and Dr. Ron
Askin, former and current chairs of the Department of Industrial Engineering at Arizona State
University, for their support and for providing a terrific environment in which to teach and con-
duct research.
I thank the various professional societies and publishers who have given permission to
reproduce their materials in my text. Permission credit is acknowledged at appropriate places in
this book.
I am also indebted to the many organizations that have sponsored my research and my
graduate students for a number of years, including the member companies of the National
Science Foundation/Industry/University Cooperative Research Center in Quality and Reliability
Engineering at Arizona State University, the Office of Naval Research, the National Science
Foundation, the Semiconductor Research Corporation, the Aluminum Company of America, and
the IBM Corporation. Finally, I would like to thank the many users of the previous editions of
this book, including students, practicing professionals, and my academic colleagues. Many of
the changes and improvements in this edition of the book are the direct result of your feedback.
DOUGLAS C. MONTGOMERY
Tempe, Arizona
viii
Preface
C
ontents
ix
PART 1
INTRODUCTION 1
1
QUALITY IMPROVEMENT IN
THE MODERN BUSINESS
ENVIRONMENT 3
Chapter Overview and Learning Objectives 3
1.1 The Meaning of Quality and
Quality Improvement 4
1.1.1 Dimensions of Quality 4
1.1.2 Quality Engineering Terminology 8
1.2 A Brief History of Quality Control
and Improvement 9
1.3 Statistical Methods for Quality Control
and Improvement 13
1.4 Management Aspects of
Quality Improvement 16
1.4.1 Quality Philosophy and
Management Strategies 17
1.4.2 The Link Between Quality
and Productivity 35
1.4.3 Quality Costs 36
1.4.4 Legal Aspects of Quality 41
1.4.5 Implementing Quality Improvement 42
2
THE DMAIC PROCESS 45
Chapter Overview and Learning Objectives 45
2.1 Overview of DMAIC 45
2.2 The Define Step 49
2.3 The Measure Step 50
2.4 The Analyze Step 52
2.5 The Improve Step 53
2.6 The Control Step 54
2.7 Examples of DMAIC 54
2.7.1 Litigation Documents 54
2.7.2 Improving On-Time Delivery 56
2.7.3 Improving Service Quality
in a Bank 59
PART 2
STATISTICAL METHODS USEFUL
IN QUALITY CONTROL
AND IMPROVEMENT 61
3
MODELING PROCESS QUALITY 63
Chapter Overview and Learning Objectives 63
3.1 Describing Variation 64
3.1.1 The Stem-and-Leaf Plot 64
3.1.2 The Histogram 66
3.1.3 Numerical Summary of Data 69
3.1.4 The Box Plot 71
3.1.5 Probability Distributions 72
3.2 Important Discrete Distributions 76
3.2.1 The Hypergeometric Distribution 76
3.2.2 The Binomial Distribution 77
3.2.3 The Poisson Distribution 79
3.2.4 The Pascal and Related Distributions 80
3.3 Important Continuous Distributions 81
3.3.1 The Normal Distribution 81
3.3.2 The Lognormal Distribution 86
3.3.3 The Exponential Distribution 88
3.3.4 The Gamma Distribution 89
3.3.5 The Weibull Distribution 91
3.4 Probability Plots 93
3.4.1 Normal Probability Plots 93
3.4.2 Other Probability Plots 95
3.5 Some Useful Approximations 96
3.5.1 The Binomial Approximation to
the Hypergeometric 96
3.5.2 The Poisson Approximation to
the Binomial 96
3.5.3 The Normal Approximation to
the Binomial 97
3.5.4 Comments on Approximations 98
4
INFERENCES ABOUT
PROCESS QUALITY 103
Chapter Overview and Learning Objectives 104
4.1 Statistics and Sampling Distributions 104
4.1.1 Sampling from a Normal
Distribution 105
4.1.2 Sampling from a Bernoulli
Distribution 108
4.1.3 Sampling from a Poisson
Distribution 109
4.2 Point Estimation of Process Parameters 110
4.3 Statistical Inference for a Single Sample 112
4.3.1 Inference on the Mean of a
Population, Variance Known 113
4.3.2 The Use of P-Values for
Hypothesis Testing 116
4.3.3 Inference on the Mean of a Normal
Distribution, Variance Unknown 117
4.3.4 Inference on the Variance of
a Normal Distribution 120
4.3.5 Inference on a Population
Proportion 122
4.3.6 The Probability of Type II Error
and Sample Size Decisions 124
4.4 Statistical Inference for Two Samples 127
4.4.1 Inference for a Difference in
Means, Variances Known 128
4.4.2 Inference for a Difference in Means
of Two Normal Distributions,
Variances Unknown 130
4.4.3 Inference on the Variances of Two
Normal Distributions 137
4.4.4 Inference on Two
Population Proportions 139
4.5 What If There Are More Than Two
Populations? The Analysis of Variance 140
4.5.1 An Example 140
4.5.2 The Analysis of Variance 142
4.5.3 Checking Assumptions:
Residual Analysis 148
4.6 Linear Regression Models 150
4.6.1 Estimation of the Parameters
in Linear Regression Models 151
x
Contents
4.6.2 Hypothesis Testing in Multiple
Regression 157
4.6.3 Confidance Intervals in Multiple
Regression 163
4.6.4 Prediction of New Observations 164
4.6.5 Regression Model Diagnostics 165
PART 3
BASIC METHODS OF STATISTICAL
PROCESS CONTROL AND
CAPABILITY ANALYSIS 177
5
METHODS AND PHILOSOPHY OF
STATISTICAL PROCESS
CONTROL 179
Chapter Overview and Learning Objectives 179
5.1 Introduction 180
5.2 Chance and Assignable Causes of
Quality Variation 181
5.3 Statistical Basis of the Control Chart 182
5.3.1 Basic Principles 182
5.3.2 Choice of Control Limits 189
5.3.3 Sample Size and Sampling
Frequency 191
5.3.4 Rational Subgroups 193
5.3.5 Analysis of Patterns on Control
Charts 195
5.3.6 Discussion of Sensitizing Rules
for Control Charts 197
5.3.7 Phase I and Phase II of Control
Chart Application 198
5.4 The Rest of the Magnificent Seven 199
5.5 Implementing SPC in a Quality
Improvement Program 205
5.6 An Application of SPC 206
5.7 Applications of Statistical Process
Control and Quality Improvement Tools
in Transactional and Service Businesses 213
6
CONTROL CHARTS
FOR VARIABLES 226
Chapter Overview and Learning Objectives 226
6.1 Introduction 227
6.2 Control Charts for
–
x and R 228
6.2.1 Statistical Basis of the Charts 228
6.2.2 Development and Use of
–
x and
R Charts 231
6.2.3 Charts Based on Standard
Values 242
6.2.4 Interpretation of
–
x and R
Charts 243
6.2.5 The Effect of Nonnormality on
–
x
and R Charts 246
6.2.6 The Operating-Characteristic
Function 246
6.2.7 The Average Run Length for
the
–
x Chart 249
6.3 Control Charts for
–
x and s 251
6.3.1 Construction and Operation of
–
x
and s Charts 251
6.3.2 The
–
x and s Control Charts with
Variable Sample Size 255
6.3.3 The s
2
Control Chart 259
6.4 The Shewhart Control Chart for Individual
Measurements 259
6.5 Summary of Procedures for
–
x, R,
and s Charts 268
6.6 Applications of Variables Control
Charts 268
7
CONTROL CHARTS
FOR ATTRIBUTES 288
Chapter Overview and Learning Objectives 288
7.1 Introduction 289
7.2 The Control Chart for Fraction
Nonconforming 289
7.2.1 Development and Operation of
the Control Chart 290
7.2.2 Variable Sample Size 301
7.2.3 Applications in Transactional
and Service Businesses 304
7.2.4 The Operating-Characteristic
Function and Average Run Length
Calculations 306
7.3 Control Charts for Nonconformities
(Defects) 308
7.3.1 Procedures with Constant Sample
Size 309
7.3.2 Procedures with Variable Sample
Size 319
7.3.3 Demerit Systems 321
Contents
xi
7.3.4 The Operating-Characteristic
Function 322
7.3.5 Dealing with Low Defect Levels 323
7.3.6 Nonmanufacturing Applications 326
7.4 Choice Between Attributes and Variables
Control Charts 326
7.5 Guidelines for Implementing Control
Charts 330
8
PROCESS AND MEASUREMENT
SYSTEM CAPABILITY ANALYSIS 344
Chapter Overview and Learning Objectives 345
8.1 Introduction 345
8.2 Process Capability Analysis Using a
Histogram or a Probability Plot 347
8.2.1 Using the Histogram 347
8.2.2 Probability Plotting 349
8.3 Process Capability Ratios 351
8.3.1 Use and Interpretation of C
p
351
8.3.2 Process Capability Ratio for an
Off-Center Process 354
8.3.3 Normality and the Process
Capability Ratio 356
8.3.4 More about Process Centering 357
8.3.5 Confidence Intervals and
Tests on Process Capability
Ratios 359
8.4 Process Capability Analysis Using a
Control Chart 364
8.5 Process Capability Analysis Using
Designed Experiments 366
8.6 Process Capability Analysis with Attribute
Data 367
8.7 Gauge and Measurement System
Capability Studies 368
8.7.1 Basic Concepts of Gauge
Capability 368
8.7.2 The Analysis of Variance
Method 373
8.7.3 Confidence Intervals in Gauge
R & R Studies 376
8.7.4 False Defectives and Passed
Defectives 377
8.7.5 Attribute Gauge Capability 381
8.8 Setting Specification Limits on Discrete
Components 383
8.8.1 Linear Combinations 384
8.8.2 Nonlinear Combinations 387
8.9 Estimating the Natural Tolerance Limits
of a Process 388
8.9.1 Tolerance Limits Based on the
Normal Distribution 389
8.9.2 Nonparametric Tolerance Limits 390
PART 4
OTHER STATISTICAL PROCESS-
MONITORING AND CONTROL
TECHNIQUES 397
9
CUMULATIVE SUM AND
EXPONENTIALLY WEIGHTED
MOVING AVERAGE CONTROL
CHARTS 399
Chapter Overview and Learning Objectives 400
9.1 The Cumulative Sum Control Chart 400
9.1.1 Basic Principles: The Cusum
Control Chart for Monitoring the
Process Mean 400
9.1.2 The Tabular or Algorithmic
Cusum for Monitoring the
Process Mean 403
9.1.3 Recommendations for Cusum
Design 408
9.1.4 The Standardized Cusum 410
9.1.5 Improving Cusum
Responsiveness for Large
Shifts 410
9.1.6 The Fast Initial Response or
Headstart Feature 410
9.1.7 One-Sided Cusums 413
9.1.8 A Cusums for Monitoring
Process Variability 413
9.1.9 Rational Subgroups 414
9.1.10 Cusums for Other Sample
Statistics 414
9.1.11 The V-Mask Procedure 415
9.1.12 The Self-Starting Cusum 417
9.2 The Exponentially Weighted Moving
Average Control Chart 419
9.2.1 The Exponentially Weighted
Moving Average Control
Chart for Monitoring the
Process Mean 419
xii
Contents
9.2.2 Design of an EWMA Control
Chart 422
9.2.3 Robustness of the EWMA to Non-
normality 424
9.2.4 Rational Subgroups 425
9.2.5 Extensions of the EWMA 425
9.3 The Moving Average Control Chart 428
10
OTHER UNIVARIATE STATISTICAL
PROCESS MONITORING AND
CONTROL TECHNIQUES 433
Chapter Overview and Learning Objectives 434
10.1 Statistical Process Control for Short
Production Runs 435
10.1.1
–
x and R Charts for Short
Production Runs 435
10.1.2 Attributes Control Charts for
Short Production Runs 437
10.1.3 Other Methods 437
10.2 Modified and Acceptance Control Charts 439
10.2.1 Modified Control Limits for
the
–
x Chart 439
10.2.2 Acceptance Control Charts 442
10.3 Control Charts for Multiple-Stream
Processes 443
10.3.1 Multiple-Stream Processes 443
10.3.2 Group Control Charts 443
10.3.3 Other Approaches 445
10.4 SPC With Autocorrelated Process Data 446
10.4.1 Sources and Effects of
Autocorrelation in Process Data 446
10.4.2 Model-Based Approaches 450
10.4.3 A Model-Free Approach 458
10.5 Adaptive Sampling Procedures 462
10.6 Economic Design of Control Charts 463
10.6.1 Designing a Control Chart 463
10.6.2 Process Characteristics 464
10.6.3 Cost Parameters 464
10.6.4 Early Work and Semieconomic
Designs 466
10.6.5 An Economic Model of the
–
x
Control Chart 467
10.6.6 Other Work 472
10.7 Cuscore Charts 473
10.8 The Changepoint Model for Process
Monitoring 475
10.9 Profile Monitoring 476
10.10 Control Charts in Health Care Monitoring
and Public Health Surveillance 481
10.11 Overview of Other Procedures 482
10.11.1 Tool Wear 482
10.11.2 Control Charts Based on Other
Sample Statistics 482
10.11.3 Fill Control Problems 484
10.11.4 Precontrol 484
10.11.5 Tolerance Interval Control
Charts 485
10.11.6 Monitoring Processes with
Censored Data 486
10.11.7 Nonparametric Control Charts 487
11
MULTIVARIATE PROCESS
MONITORING AND CONTROL 494
Chapter Overview and Learning Objectives 494
11.1 The Multivariate Quality-Control
Problem 495
11.2 Description of Multivariate Data 497
11.2.1 The Multivariate Normal
Distribution 497
11.2.2 The Sample Mean Vector and
Covariance Matrix 498
11.3 The Hotelling T
2
Control Chart 499
11.3.1 Subgrouped Data 499
11.3.2 Individual Observations 506
11.4 The Multivariate EWMA Control Chart 509
11.5 Regression Adjustment 513
11.6 Control Charts for Monitoring Variability 516
11.7 Latent Structure Methods 518
11.7.1 Principal Components 518
11.7.2 Partial Least Squares 523
12
ENGINEERING PROCESS
CONTROL AND SPC 527
Chapter Overview and Learning Objectives 527
12.1 Process Monitoring and Process
Regulation 528
12.2 Process Control by Feedback Adjustment 529
12.2.1 A Simple Adjustment Scheme:
Integral Control 529
12.2.2 The Adjustment Chart 534
12.2.3 Variations of the Adjustment
Chart 536
Contents
xiii
12.2.4 Other Types of Feedback
Controllers 539
12.3 Combining SPC and EPC 540
PART 5
PROCESS DESIGN AND
IMPROVEMENT WITH DESIGNED
EXPERIMENTS 547
13
FACTORIAL AND FRACTIONAL
FACTORIAL EXPERIMENTS FOR
PROCESS DESIGN AND
IMPROVEMENT 549
Chapter Overview and Learning Objectives 550
13.1 What is Experimental Design? 550
13.2 Examples of Designed Experiments
In Process and Product Improvement 552
13.3 Guidelines for Designing Experiments 554
13.4 Factorial Experiments 556
13.4.1 An Example 558
13.4.2 Statistical Analysis 558
13.4.3 Residual Analysis 563
13.5 The 2
k
Factorial Design 564
13.5.1 The 2
2
Design 564
13.5.2 The 2
k
Design for k ≥ 3 Factors 569
13.5.3 A Single Replicate of the 2
k
Design 579
13.5.4 Addition of Center Points to
the 2
k
Design 582
13.5.5 Blocking and Confounding in
the 2
k
Design 585
13.6 Fractional Replication of the 2
k
Design 587
13.6.1 The One-Half Fraction of the
2
k
Design 587
13.6.2 Smaller Fractions: The 2
k–p
Fractional Factorial Design 592
14
PROCESS OPTIMIZATION WITH
DESIGNED EXPERIMENTS 602
Chapter Overview and Learning Objectives 602
14.1 Response Surface Methods and Designs 603
14.1.1 The Method of Steepest
Ascent 605
14.1.2 Analysis of a Second-Order
Response Surface 607
14.2 Process Robustness Studies 611
14.2.1 Background 611
14.2.2 The Response Surface
Approach to Process
Robustness Studies 613
14.3 Evolutionary Operation 619
PART 6
ACCEPTANCE SAMPLING 629
15
LOT-BY-LOT ACCEPTANCE
SAMPLING FOR ATTRIBUTES 631
Chapter Overview and Learning Objectives 631
15.1 The Acceptance-Sampling Problem 632
15.1.1 Advantages and Disadvantages
of Sampling 633
15.1.2 Types of Sampling Plans 634
15.1.3 Lot Formation 635
15.1.4 Random Sampling 635
15.1.5 Guidelines for Using Acceptance
Sampling 636
15.2 Single-Sampling Plans for Attributes 637
15.2.1 Definition of a Single-Sampling
Plan 637
15.2.2 The OC Curve 637
15.2.3 Designing a Single-Sampling
Plan with a Specified OC
Curve 642
15.2.4 Rectifying Inspection 643
15.3 Double, Multiple, and Sequential
Sampling 646
15.3.1 Double-Sampling Plans 647
15.3.2 Multiple-Sampling Plans 651
15.3.3 Sequential-Sampling Plans 652
15.4 Military Standard 105E (ANSI/
ASQC Z1.4, ISO 2859) 655
15.4.1 Description of the Standard 655
15.4.2 Procedure 657
15.4.3 Discussion 661
15.5 The Dodge–Romig Sampling Plans 663
15.5.1 AOQL Plans 664
15.5.2 LTPD Plans 667
15.5.3 Estimation of Process
Average 667
xiv
Contents
16
OTHER ACCEPTANCE-SAMPLING
TECHNIQUES 670
Chapter Overview and Learning Objectives 670
16.1 Acceptance Sampling by Variables 671
16.1.1 Advantages and Disadvantages of
Variables Sampling 671
16.1.2 Types of Sampling Plans Available 672
16.1.3 Caution in the Use of Variables
Sampling 673
16.2 Designing a Variables Sampling Plan
with a Specified OC Curve 673
16.3 MIL STD 414 (ANSI/ASQC Z1.9) 676
16.3.1 General Description of the Standard 676
16.3.2 Use of the Tables 677
16.3.3 Discussion of MIL STD 414 and
ANSI/ASQC Z1.9 679
16.4 Other Variables Sampling Procedures 680
16.4.1 Sampling by Variables to Give
Assurance Regarding the Lot or
Process Mean 680
16.4.2 Sequential Sampling by Variables 681
16.5 Chain Sampling 681
16.6 Continuous Sampling 683
16.6.1 CSP-1 683
16.6.2 Other Continuous-Sampling Plans 686
16.7 Skip-Lot Sampling Plans 686
APPENDIX 691
I. Summary of Common Probability
Distributions Often Used in Statistical
Quality Control 692
II. Cumulative Standard Normal Distribution 693
III. Percentage Points of the
χ
2
Distribution 695
IV. Percentage Points of the t Distribution 696
V. Percentage Points of the F Distribution 697
VI. Factors for Constructing Variables
Control Charts 702
VII. Factors for Two-Sided Normal
Tolerance Limits 703
VIII. Factors for One-Sided Normal
Tolerance Limits 704
BIBLIOGRAPHY 705
ANSWERS TO
SELECTED EXERCISES 721
INDEX 729
Controlling and improving quality has become an important business strat-
egy for many organizations; manufacturers, distributors, transportation
companies, financial services organizations; health care providers, and gov-
ernment agencies. Quality is a competitive advantage. A business that can
delight customers by improving and controlling quality can dominate its
competitors. This book is about the technical methods for achieving success
in quality control and improvement, and offers guidance on how to success-
fully implement these methods.
Part 1 contains two chapters. Chapter 1 contains the basic definitions of qual-
ity and quality improvement, provides a brief overview of the tools and meth-
ods discussed in greater detail in subsequent parts of the book, and discusses
the management systems for quality improvement. Chapter 2 is devoted to
the DMAIC (define, measure, analyze, improve, and control) problem-
solving process, which is an excellent framework for implementing quality
improvement. We also show how the methods discussed in the book are used
in DMAIC.
PART
1
PART
1
I
ntroduction
I
ntroduction
This page intentionally left blank
Q
uality
Improvement in
the Modern
Business
Environment
Q
uality
Improvement in
the Modern
Business
Environment
1.1 THE MEANING OF QUALITY AND
QUALITY IMPROVEMENT
1.1.1 Dimensions of Quality
1.1.2 Quality Engineering
Terminology
1.2 A BRIEF HISTORY OF QUALITY
CONTROL AND IMPROVEMENT
1.3 STATISTICAL METHODS FOR
QUALITY CONTROL AND
IMPROVEMENT
1.4 MANAGEMENT ASPECTS OF QUALITY
IMPROVEMENT
1.4.1 Quality Philosophy and
Management Strategies
1.4.2 The Link Between Quality and
Productivity
1.4.3 Quality Costs
1.4.4 Legal Aspects of Quality
1.4.5 Implementing Quality
Improvement
1
1
CHAPTER OUTLINE
CHAPTER OVERVIEW AND LEARNING OBJECTIVES
This book is about the use of statistical methods and other problem-solving techniques to
improve the quality of the products used by our society. These products consist of manufac-
tured goods such as automobiles, computers, and clothing, as well as services such as the
generation and distribution of electrical energy, public transportation, banking, retailing, and
health care. Quality improvement methods can be applied to any area within a company or
organization, including manufacturing, process development, engineering design, finance and
accounting, marketing, distribution and logistics, customer service, and field service of prod-
ucts. This text presents the technical tools that are needed to achieve quality improvement in
these organizations.
In this chapter we give the basic definitions of quality, quality improvement, and other
quality engineering terminology. We also discuss the historical development of quality
3
improvement methodology and overview the statistical tools essential for modern profes-
sional practice. A brief discussion of some management and business aspects for implement-
ing quality improvement is also given.
After careful study of this chapter you should be able to do the following:
1. Define and discuss quality and quality improvement
2. Discuss the different dimensions of quality
3. Discuss the evolution of modern quality improvement methods
4. Discuss the role that variability and statistical methods play in controlling and
improving quality
5. Describe the quality management philosophies of W. Edwards Deming, Joseph
M. Juran, and Armand V. Feigenbaum
6. Discuss total quality management, the Malcolm Baldrige National Quality
Award, six-sigma, and quality systems and standards
7. Explain the links between quality and productivity and between quality and
cost
8. Discuss product liability
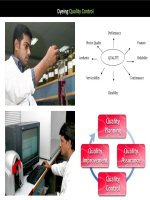
9. Discuss the three functions: quality planning, quality assurance, and quality control
and improvement
1.1 The Meaning of Quality and Quality Improvement
We may define quality in many ways. Most people have a conceptual understanding of qual-
ity as relating to one or more desirable characteristics that a product or service should pos-
sess. Although this conceptual understanding is certainly a useful starting point, we will give
a more precise and useful definition.
Quality has become one of the most important consumer decision factors in the selec-
tion among competing products and services. The phenomenon is widespread, regardless of
whether the consumer is an individual, an industrial organization, a retail store, a bank or
financial institution, or a military defense program. Consequently, understanding and improv-
ing quality are key factors leading to business success, growth, and enhanced competitive-
ness. There is a substantial return on investment from improved quality and from successfully
employing quality as an integral part of overall business strategy. In this section we provide
operational definitions of quality and quality improvement. We begin with a brief discussion
of the different dimensions of quality and some basic terminology.
1.1.1 Dimensions of Quality
The quality of a product can be described and evaluated in several ways. It is often very
important to differentiate these different dimensions of quality. Garvin (1987) provides an
excellent discussion of eight components or dimensions of quality. We summarize his key
points concerning these dimensions of quality as follows:
1. Performance (Will the product do the intended job?) Potential customers usually
evaluate a product to determine if it will perform certain specific functions and
determine how well it performs them. For example, you could evaluate spreadsheet
software packages for a PC to determine which data manipulation operations they
perform. You may discover that one outperforms another with respect to the execu-
tion speed.
4 Chapter 1 ■ Quality Improvement in the Modern Business Environment
2. Reliability (How often does the product fail?) Complex products, such as many appli-
ances, automobiles, or airplanes, will usually require some repair over their service life.
For example, you should expect that an automobile will require occasional repair, but
if the car requires frequent repair, we say that it is unreliable. There are many indus-
tries in which the customer’s view of quality is greatly impacted by the reliability
dimension of quality.
3. Durability (How long does the product last?) This is the effective service life of the prod-
uct. Customers obviously want products that perform satisfactorily over a long period of
time. The automobile and major appliance industries are examples of businesses where
this dimension of quality is very important to most customers.
4. Serviceability (How easy is it to repair the product?) There are many industries in which
the customer’s view of quality is directly influenced by how quickly and economically a
repair or routine maintenance activity can be accomplished. Examples include the appli-
ance and automobile industries and many types of service industries (how long did it take
a credit card company to correct an error in your bill?).
5. Aesthetics (What does the product look like?) This is the visual appeal of the product,
often taking into account factors such as style, color, shape, packaging alternatives, tac-
tile characteristics, and other sensory features. For example, soft-drink beverage man-
ufacturers have relied on the visual appeal of their packaging to differentiate their prod-
uct from other competitors.
6. Features (What does the product do?) Usually, customers associate high quality with
products that have added features; that is, those that have features beyond the basic per-
formance of the competition. For example, you might consider a spreadsheet software
package to be of superior quality if it had built-in statistical analysis features while its
competitors did not.
7. Perceived Quality (What is the reputation of the company or its product?) In many
cases, customers rely on the past reputation of the company concerning quality of
its products. This reputation is directly influenced by failures of the product that
are highly visible to the public or that require product recalls, and by how the cus-
tomer is treated when a quality-related problem with the product is reported.
Perceived quality, customer loyalty, and repeated business are closely intercon-
nected. For example, if you make regular business trips using a particular airline,
and the flight almost always arrives on time and the airline company does not lose
or damage your luggage, you will probably prefer to fly on that carrier instead of
its competitors.
8. Conformance to Standards (Is the product made exactly as the designer intended?)
We usually think of a high-quality product as one that exactly meets the require-
ments placed on it. For example, how well does the hood fit on a new car? Is it
perfectly flush with the fender height, and is the gap exactly the same on all sides?
Manufactured parts that do not exactly meet the designer’s requirements can cause
significant quality problems when they are used as the components of a more
complex assembly. An automobile consists of several thousand parts. If each one
is just slightly too big or too small, many of the components will not fit together
properly, and the vehicle (or its major subsystems) may not perform as the designer
intended.
We see from the foregoing discussion that quality is indeed a multifaceted entity.
Consequently, a simple answer to questions such as “What is quality?” or “What is quality
improvement?” is not easy. The traditional definition of quality is based on the viewpoint
that products and services must meet the requirements of those who use them.
1.1 The Meaning of Quality and Quality Improvement 5
There are two general aspects of fitness for use: quality of design and quality of con-
formance. All goods and services are produced in various grades or levels of quality. These vari-
ations in grades or levels of quality are intentional, and, consequently, the appropriate technical
term is quality of design. For example, all automobiles have as their basic objective providing
safe transportation for the consumer. However, automobiles differ with respect to size, appoint-
ments, appearance, and performance. These differences are the result of intentional design dif-
ferences among the types of automobiles. These design differences include the types of materi-
als used in construction, specifications on the components, reliability obtained through engi-
neering development of engines and drive trains, and other accessories or equipment.
The quality of conformance is how well the product conforms to the specifications
required by the design. Quality of conformance is influenced by a number of factors, includ-
ing the choice of manufacturing processes, the training and supervision of the workforce, the
types of process controls, tests, and inspection activities that are employed, the extent to
which these procedures are followed, and the motivation of the workforce to achieve quality.
Unfortunately, this definition has become associated more with the conformance aspect
of quality than with design. This is in part due to the lack of formal education most design-
ers and engineers receive in quality engineering methodology. This also leads to much less
focus on the customer and more of a “conformance-to-specifications” approach to quality,
regardless of whether the product, even when produced to standards, was actually “fit-for-
use” by the customer. Also, there is still a widespread belief that quality is a problem that can
be dealt with solely in manufacturing, or that the only way quality can be improved is by
“gold-plating” the product.
We prefer a modern definition of quality:
6 Chapter 1 ■ Quality Improvement in the Modern Business Environment
Definition
Quality means fitness for use.
Definition
Quality is inversely proportional to variability.
Note that this definition implies that if variability
1
in the important characteristics of a prod-
uct decreases, the quality of the product increases.
As an example of the operational effectiveness of this definition, a few years ago,
one of the automobile companies in the United States performed a comparative study of a
transmission that was manufactured in a domestic plant and by a Japanese supplier. An
analysis of warranty claims and repair costs indicated that there was a striking difference
between the two sources of production, with the Japanese-produced transmission having
much lower costs, as shown in Fig. 1.1. As part of the study to discover the cause of this
difference in cost and performance, the company selected random samples of transmis-
sions from each plant, disassembled them, and measured several critical quality charac-
teristics.
1
We are referring to unwanted or harmful variability. There are situations in which variability is actually good. As
my good friend Bob Hogg has pointed out, “I really like Chinese food, but I don’t want to eat it every night.”
Figure 1.2 is generally representative of the results of this study. Note that both distri-
butions of critical dimensions are centered at the desired or target value. However, the distri-
bution of the critical characteristics for the transmissions manufactured in the United States
takes up about 75% of the width of the specifications, implying that very few nonconforming
units would be produced. In fact, the plant was producing at a quality level that was quite
good, based on the generally accepted view of quality within the company. In contrast, the
Japanese plant produced transmissions for which the same critical characteristics take up only
about 25% of the specification band. As a result, there is considerably less variability in the
critical quality characteristics of the Japanese-built transmissions in comparison to those built
in the United States.
This is a very important finding. Jack Welch, the retired chief executive officer of
General Electric, has observed that your customer doesn’t see the mean of your process (the
target in Fig. 1.2), he only sees the variability around that target that you have not removed.
In almost all cases, this variability has significant customer impact.
There are two obvious questions here: Why did the Japanese do this? How did they do
this? The answer to the “why” question is obvious from examination of Fig. 1.1. Reduced
variability has directly translated into lower costs (the Japanese fully understood the point
made by Welch). Furthermore, the Japanese-built transmissions shifted gears more smoothly,
ran more quietly, and were generally perceived by the customer as superior to those built
domestically. Fewer repairs and warranty claims means less rework and the reduction of
wasted time, effort, and money. Thus, quality truly is inversely proportional to variability.
Furthermore, it can be communicated very precisely in a language that everyone (particularly
managers and executives) understands—namely, money.
How did the Japanese do this? The answer lies in the systematic and effective use of
the methods described in this book. It also leads to the following definition of quality
improvement.
1.1 The Meaning of Quality and Quality Improvement 7
Definition
Quality improvement is the reduction of variability in processes and products.
0
$
United
States
Japan
LSL
Japan
United
States
Target USL
■ FIGURE 1.1 Warranty costs for
transmissions.
■ FIGURE 1.2 Distributions of critical
dimensions for transmissions.
Excessive variability in process performance often results in waste. For example, consider
the wasted money, time, and effort that is associated with the repairs represented in Fig. 1.1.
Therefore, an alternate and frequently very useful definition is that quality improvement
is the reduction of waste. This definition is particularly effective in service industries,
where there may not be as many things that can be directly measured (like the transmission
critical dimensions in Fig. 1.2). In service industries, a quality problem may be an error or a
mistake, the correction of which requires effort and expense. By improving the service
process, this wasted effort and expense can be avoided.
We now present some quality engineering terminology that is used throughout the book.
1.1.2 Quality Engineering Terminology
Every product possesses a number of elements that jointly describe what the user or consumer
thinks of as quality. These parameters are often called quality characteristics. Sometimes
these are called critical-to-quality (CTQ) characteristics. Quality characteristics may be of
several types:
1. Physical: length, weight, voltage, viscosity
2. Sensory: taste, appearance, color
3. Time Orientation: reliability, durability, serviceability
Note that the different types of quality characteristics can relate directly or indirectly to the
dimensions of quality discussed in the previous section.
Quality engineering is the set of operational, managerial, and engineering activities
that a company uses to ensure that the quality characteristics of a product are at the nominal
or required levels and that the variability around these desired levels is minimum. The tech-
niques discussed in the book form much of the basic methodology used by engineers and
other technical professionals to achieve these goals.
Most organizations find it difficult (and expensive) to provide the customer with prod-
ucts that have quality characteristics that are always identical from unit to unit, or are at
levels that match customer expectations. A major reason for this is variability. There is a
certain amount of variability in every product; consequently, no two products are ever iden-
tical. For example, the thickness of the blades on a jet turbine engine impeller is not identi-
cal even on the same impeller. Blade thickness will also differ between impellers. If this
variation in blade thickness is small, then it may have no impact on the customer. However,
if the variation is large, then the customer may perceive the unit to be undesirable and unac-
ceptable. Sources of this variability include differences in materials, differences in the per-
formance and operation of the manufacturing equipment, and differences in the way the
operators perform their tasks. This line of thinking led to the previous definition of quality
improvement.
Since variability can only be described in statistical terms, statistical methods play a
central role in quality improvement efforts. In the application of statistical methods to qual-
ity engineering, it is fairly typical to classify data on quality characteristics as either attribu-
tes or variables data. Variables data are usually continuous measurements, such as length,
voltage, or viscosity. Attributes data, on the other hand, are usually discrete data, often taking
the form of counts. Such as the number of loan applications that could not be properly
processed because of missing required information, or the number of emergency room
arrivals that have to wait more than 30 minutes to receive medical attention. We will describe
statistical-based quality engineering tools for dealing with both types of data.
Quality characteristics are often evaluated relative to specifications. For a manufac-
tured product, the specifications are the desired measurements for the quality characteristics
of the components and subassemblies that make up the product, as well as the desired values
for the quality characteristics in the final product. For example, the diameter of a shaft used
in an automobile transmission cannot be too large or it will not fit into the mating bearing,
nor can it be too small, resulting in a loose fit, causing vibration, wear, and early failure of
the assembly. In the service industries, specifications are typically in terms of the maximum
amount of time to process an order or to provide a particular service.
8 Chapter 1 ■ Quality Improvement in the Modern Business Environment
A value of a measurement that corresponds to the desired value for that quality charac-
teristic is called the nominal or target value for that characteristic. These target values are
usually bounded by a range of values that, most typically, we believe will be sufficiently close
to the target so as to not impact the function or performance of the product if the quality char-
acteristic is in that range. The largest allowable value for a quality characteristic is called the
upper specification limit (USL), and the smallest allowable value for a quality characteris-
tic is called the lower specification limit (LSL). Some quality characteristics have specifi-
cation limits on only one side of the target. For example, the compressive strength of a com-
ponent used in an automobile bumper likely has a target value and a lower specification limit,
but not an upper specification limit.
Specifications are usually the result of the engineering design process for the product.
Traditionally, design engineers have arrived at a product design configuration through the use
of engineering science principles, which often results in the designer specifying the target val-
ues for the critical design parameters. Then prototype construction and testing follow. This
testing is often done in a very unstructured manner, without the use of statistically based
experimental design procedures, and without much interaction with or knowledge of the man-
ufacturing processes that must produce the component parts and final product. However,
through this general procedure, the specification limits are usually determined by the design
engineer. Then the final product is released to manufacturing. We refer to this as the over-the-
wall approach to design.
Problems in product quality usually are greater when the over-the-wall approach to
design is used. In this approach, specifications are often set without regard to the inherent
variability that exists in materials, processes, and other parts of the system, which results in
components or products that are nonconforming; that is, nonconforming products are those
that fail to meet one or more of its specifications. A specific type of failure is called a noncon-
formity. A nonconforming product is not necessarily unfit for use; for example, a detergent
may have a concentration of active ingredients that is below the lower specification limit, but
it may still perform acceptably if the customer uses a greater amount of the product. A non-
conforming product is considered defective if it has one or more defects, which are noncon-
formities that are serious enough to significantly affect the safe or effective use of the product.
Obviously, failure on the part of a company to improve its manufacturing processes can also
cause nonconformities and defects.
The over-the-wall design process has been the subject of much attention in the past 25
years. CAD/CAM systems have done much to automate the design process and to more
effectively translate specifications into manufacturing activities and processes. Design for
manufacturability and assembly has emerged as an important part of overcoming the inher-
ent problems with the over-the-wall approach to design, and most engineers receive some
background on those areas today as part of their formal education. The recent emphasis on
concurrent engineering has stressed a team approach to design, with specialists in manufac-
turing, quality engineering, and other disciplines working together with the product designer
at the earliest stages of the product design process. Furthermore, the effective use of the qual-
ity improvement methodology in this book, at all levels of the process used in technology com-
mercialization and product realization, including product design, development, manufacturing,
distribution, and customer support, plays a crucial role in quality improvement.
1.2 A Brief History of Quality Control and Improvement
Quality always has been an integral part of virtually all products and services. However, our
awareness of its importance and the introduction of formal methods for quality control and
improvement have been an evolutionary development. Table 1.1 presents a timeline of some
1.2 A Brief History of Quality Control and Improvement 9